Forest Research: Open Access
Open Access
ISSN: 2168-9776
+44 1300 500008
ISSN: 2168-9776
+44 1300 500008
Review Article - (2021)Volume 10, Issue 4
Land use-cover change (LULCC) is one of responsible with the anthropogenic activities that contribute the threat of biodiversity and the largest source of greenhouse gas emissions 12-20% in tropics and world that influence the human wellbeing and disturb functionality of ecosystem. The purpose of this review paper is to assess the LULCC causes, trends on forest land, consequences on plant species diversity and carbon stock and implications for sustainable landscape management in Ethiopia .Population growth, agricultural expansion, settlement, institutional factors, and weak policy enforcement and under value ecosystem were the main derivers of LULCC. At the regional, national and regional scales, these changes have profound influence plant species diversity and carbon stock potential for alterations of normal ecosystem function, particularly loss of plant biodiversity at genetic and species levels and rise of CO2 in atmosphere .the result of all these have direct impacts on livelihoods of local communities and sustainable development. Plant species diversity is reduced when land changed from a relatively undisturbed state to more intensive use. like farming, livestock grazing, selective tree harvesting, etc. while carbon stock also loss due to unsustainable agricultural land practice, conversion of native forest to agricultural land and less managed of degraded land.to revere this synergic conservation strategy is suggested like implement sustainable forest management and agricultural practice like agro-forestry.
Conservation; Carbon stock; Land use; Land cover; Sustainable; Wood diversity
Tropical forest, which include massive which called home to around half of terrestrial plant and animal species [1] and provide several ecosystem services. Such as climate regulation, water supply and regulation, maintaining biodiversity, carbon storage, pollination and cultural values. However, today become shrinking mainly land conversion was caused the 15% of the global GHG [2]. Similarly, according to [3] due to Land use changes the largest source of greenhouse gas emissions 12-20% in tropics and threat the world Biodiversity that serve the human wellbeing loss of Lehman and Tilman [4]. According to FAO [5] finding indicated, in Africa the dramatically loss of forest twice world rate of deforestation held four million hectare per year and poor agricultural practices caused to 65% emissions. Line with this, in tropic deforestation lead CO2 emissions in the 1990s, which accounted from 0.5 up to 2.7 Giga tone of carbon (GtC) per year [6]. This concerns led to extensive international discussions and negotiations to seek solution [3].
In Ethiopia also, the previous recorded rich of biological resources currently an alarming rate due to anthropogenic activities like conversation of land use land cover and happened fragmentation rapidly [7]. It’s also, one the fast population growth in Africa and facing huge LULC from natural vegetation to farming and settlement lead loss of biodiversity [8].This result subject for land degradation in Ethiopian high land [9]. Inappropriate agricultural practices and high human and livestock population pressure were the main reason lead to biodiversity loss, deforestation, soil erosion and soil quality in the highlands [10]. Besides, it becomes series effect CO2 of emission and the currently rate could rise more carbon emission into the atmosphere and enhancing the climate change [11] and loss of biodiversity [12].
To response and address above problem the understanding the impact of different land use on species diversity and carbon stock crucial for policy maker and effective land use management. As well essential for ecosystem functioning and stability [13] and calls for global attention for continuous monitoring of the changes [14]. Moreover, there was made little synthesize studies of biodiversity and carbon stocks in Ethiopia with respect to land use, ecosystem management practices and climate mitigation. Hence, this review subject to analysis the different paper and to seek compressive idea that helps implication to ensure sustainable development and understand the dynamics of the changing environment. Specifically, to examine the relevant effect of LULC change on plant diversity and carbon stock across different land use type and point out the effective land use practice also to find the best current state of knowledge reported by the scientific community help to suggest holistic sustainable conservation biodiversity and carbon at land escape and to formulate plat form improved policy and ensuring sustainable land use and C storage across different landscapes in tropical agro ecosystems.
Land use land cover change concept
As states different author, Land use and land cover are unlike however they are closely related features of the Earth’s surface in which one disturbs the other. Since that, Land use is, indicates the manner human population manipulate the biophysical attributes of the land and the purpose for which land is used, while Land cover is biophysical state of the earth’s surface and immediate subsurface [15]. For instance, the human use of land or immediate activities modifying or converting the land use [16], such as agriculture, grazing, urban development, logging and mining. While change in land cover refers to conversion of one land cover type to a new cover type or modification within one land cover category [15]. All process of LULCC called conversion and modification of terrestrial land surface [17]. Land cover conversion means the substitute of one cover type by another, whereas land cover modification refers to subtle changes that affect the character of land cover, but do not necessarily change its overall classification [10,15].
Land use land cover dynamics in Ethiopia
Ethiopia is one the fast population growth in Africa and facing huge LULC from natural vegetation to farming and settlement [8]. Likely reported, it has experiencing LU/LCC [14]. Still, a lot of studies have been conducted to enumerate LU/LCC in different part of Ethiopia. However, their reported have been shown heterogeneity in direction, pattern, type, and/or magnitude of LULC changes in the country. According to Tadesse [18] reports, land use in Ethiopia is categorized as 12% arable land, 1% permanent crops, 40% permanent pastures, 25% forest and woodland, and 22% other. In terms of magnitude for changes, Zeleke and Hurni [19] reported an increase in cultivated lands by 38% in 38 years (1957–1995) and results for a disappearance of 27% natural forest cover from 1957- 1997 in the North-western Ethiopian highlands, while Woldeamlak [20] found the opposite, i.e., an increasing trend. On the other hand Tegene [21], reported an increase in croplands only by 5.5% in 43 years (1957–2000).over similarly, as the Figures 1-4 the trend of forest and wood land become decrease over period of (1977-2017) in Babile elephant sanctuary (BES),while agricultural, bare and bare land were became increase [22]. Similarly, in Adei watershed over period of (1986-2009), forest land was decrease, while farm lands inversely increase [23]. As well as, Siemen mountain national park (SMNP) (1985–2015) described as in Figure 3, forest and grass land were decreased, while farm and bare land were increased [24]. Likely, in Bilate Alaba forest was decreased, while farm and settlement were become increased over period of (1972-2017) years [25]. Also, that farmland and settlement land expanded by 67.38 and 532% respectively, while, forest land, shrub land and grassland declined by 66.35 and 18.36% respectively within the Bilate Alaba. Over all, as estimated land use from 2000-2013 described by the Ethiopia forest reference level submission to UNFCCC [26], in Table 1 Ethiopia loss total 1,193 ha due to conversion of forest area other land use. This result subject for land degradation in Ethiopian high land [9] and lead to biodiversity loss, deforestation, soil erosion and soil quality in the highlands.
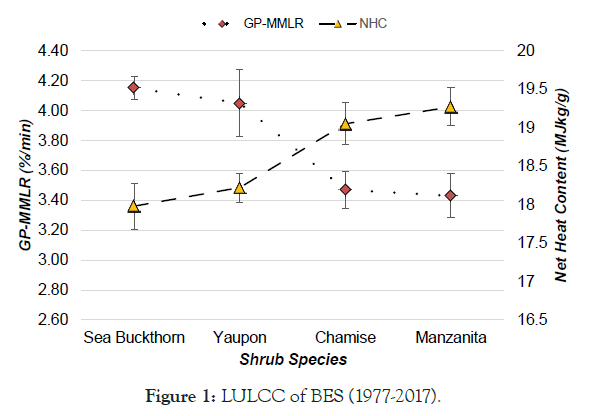
Figure 1: LULCC of BES (1977-2017).
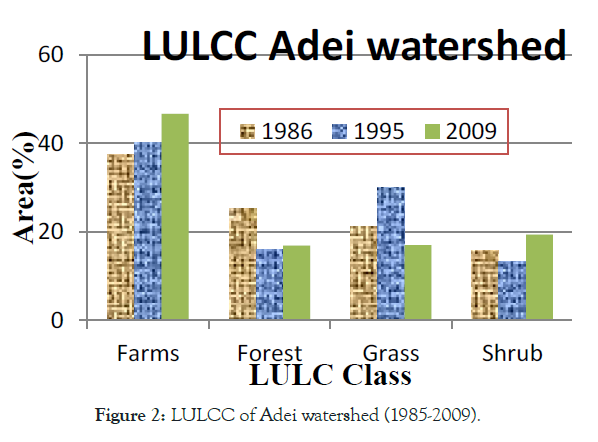
Figure 2: LULCC of Adei watershed (1985-2009).
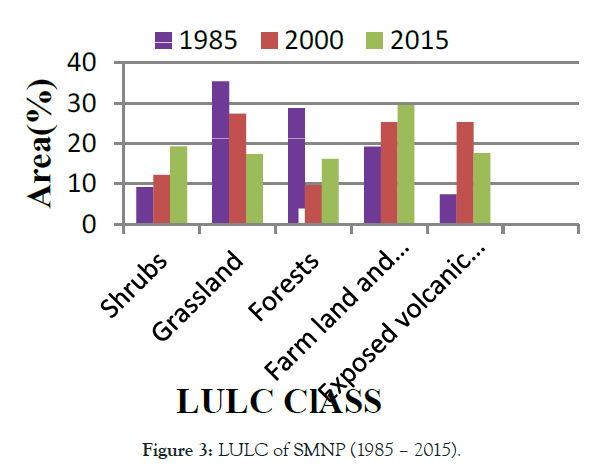
Figure 3: LULC of SMNP (1985 – 2015).
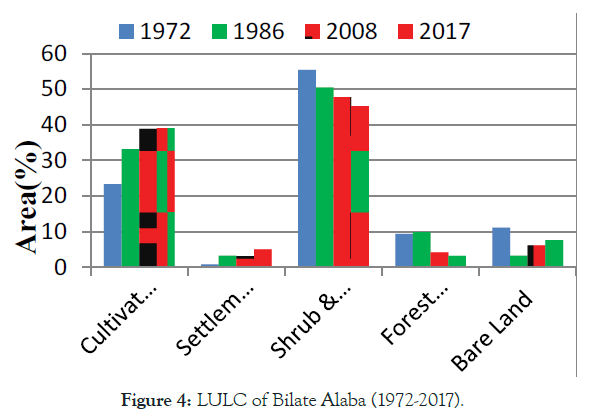
Figure 4: LULC of Bilate Alaba (1972-2017).
| Biome | Bias corrected area (thousands of ha) | |
|---|---|---|
| Forest Loss | Forest gain | |
| Acacia- Commiphora | 194 | 30 |
| Combretum- Terminalia | 712 | 8 |
| Dry Afromontane | 66 | 179 |
| Moist Afromontane | 206 | 29 |
| Other Biome | 14 | 0.8 |
| Total | 1193 | 246 |
Table 1: Estimated loss and gain forest from 2000-2013 in Ethiopia.
Driving forces of land cover change
In fact there were numerous previous study revealed that the cause of land uses change become from proximity and underlying. When, Proximate states the change directly through action [27], like infrastructure, agricultural extension and wood extraction and others factors. "Other factors" include environmental conditions, fire, floods, soil quality and topography, which are considered as intermediate factors. As well as, Underlying indicate the driving forces that indirectly lead the land use change [27], through: Demographic, Economic, Technological, Policy and Institutional; and Cultural factors used by human to change the environment.
In Ethiopia, many efforts have been made on drivers of LULC change. But, their ranks may be varies from place to place.as above (Table 2 and Figure 5) stated that agriculture expansion and population growth have get high attention. For instance population Density has been found to have negative effect on riverine trees in Chemoga watershed [20], and natural forest cover in Dembecha Wereda north-western Ethiopia [19]. Likely, population growth and poverty were bringing agricultural expansion and lack of policy and weak law enforcement reported by Deribew and Dalacho [28].
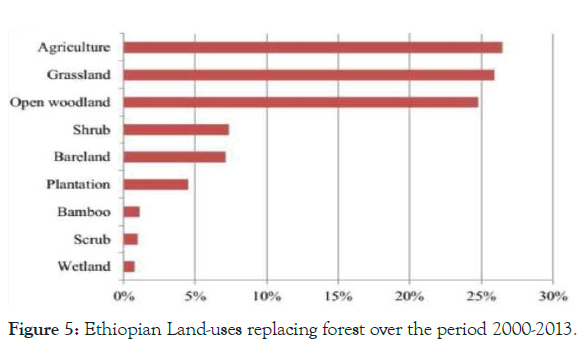
Figure 5: Ethiopian Land-uses replacing forest over the period 2000-2013.
| No. | Proximate cause | Underlying cause |
|---|---|---|
| 1 | Agricultural expansion | Population growth |
| 2 | settlement | Economic activities |
| 3 | Fire wood collection | Poverty |
| 4 | Over grassing | Policy and institutional change |
| 5 | Encroachment | Lack of strong institutional and technological support |
| Lack of strong LULC policies and lack of technologies | ||
| Lack awareness of value of ES |
Table 2: Factor driving LULC change in Ethiopia.
Similar, in line with corruption, lack of benefit sharing and delay in decision making by the courts reported from Bale Eco-region [29]. Over all, as described in Figure 5, Ethiopian forest was became declined agriculture contribute for replacing forest over period of 2000-2013, flowing by grass land. Also, the main events subsidizing to GHG emissions in forestry were deforestation for agricultural expansion, forest degradation for fuel wood, and limited formal and informal logging [30]. Mostly agriculture sector (livestock, crop, and forestry) could contribute 88% of the total GHG emissions in Ethiopia as reported by 2010 [30].
Empirical review on woody species and carbon in different land use types
Woody species across different land use types: As Table 1 revealed that recently reported by Manaye et al. [31] the species richness, abundance, Shannon diversity, Simpson diversity indices were significantly varied among EXs and adjacent DOGL at (p<.05). also others study by Gebre et al. [32] stated that the diversity indices of woody plant species were 1.59, 0.89 and 0.02 in exclosure, homestead agroforestry and woodlot, respectively. As well as, corresponding evenness values (J) were 0.43, 0.67 and 0.94, respectively. Similar to this, Shannon diversity index ranges from 1.71 (open grazing land) to 3.03 (exclosure) in Wega Guanaesa (WG); 1.05 (open grazing) to 2.94 (exclosure) in Gay Webishet (GW) site were reported by Asmare and Gure [33].This indicate average abundance and species richness in the exclosure (EXs) were almost twice that of adjacent open grazing lands. This may be due to management from human interphase and overgrazing. Likely, other study were reported by Dereje [34], the highest woody species richness was recorded from semi-forest (SFC) followed by degraded natural forest (DNF) and woodland. The least woody species were obtained from cropland. Also, the mean of species richness and Shannon diversity index were 4.72 + 0.18 and 1.25 + 0.04 obtained from area exclosure (AE) higher than 2.89 + 0.13 and 0.81 + 0.04d in communal grass land as stated by Tesfay et al. [35]. All this agree with reported Woody species richness in a Tanzanian miombo woodland also differed between shifting cultivation and more permanently cultivated areas [36].
Carbon stock of woody species in different land use types
In fact a numerous study has been under taken on effect of LULC on carbon stock. Based on profoundly reviewed as Table 3 & Figures 6-8 described that the mean carbon stocks were statistically significant difference at p<0.05 and highly influenced by land use change and management system. For instance, the mean biomass conversion of dense forests to cultivated land resulted in a 25% reduction in soil organic carbon stock. The estimated total carbon stock density was high in dense forest and low in cultivated land and bare land cover while open forest and grassland sites showed intermediate values. This was agreeing with finding of Manaye et al. [31].
| Land use types | Variables | Source | |||||
|---|---|---|---|---|---|---|---|
| AGC ton/ha | BGC ton/ha | SOC ton/ha | LC | TOC ton/ha | |||
| Exclosure | 2.29 (± 0.71)b | 0.64 (± 0.21)b | - | - | 2.93 | (Abrha Brhan Gebre et al., 2018) | |
| Agro | 4.17(± 1.08)ab | 0.83(± 0.22)ab | - | - | 5 | ||
| Woodlot | 8.79 (±1.99)a | 2.68 (± 0.60)a | - | - | 11.47 | ||
| EXs | 6.41 ± 7.30b | 1.73 ± 1.97b | 52 ± 18b | 60.14 | (Manaye et al., 2019) | ||
| DOGL | 2.16 ± 1.64a | 0.58 ± 0.44a | 38 ± 14a | 40.74 | |||
|
0.03±0.02a | 0.02±0.01a | 66.99±2.21a | 67.04 | (Mohammed Abaoli, 2011) | ||
| Coffee-ag | 53.12±7.29b | 1.17±0.16b | 94.30±5.14b | 148.59 | |||
| Natural fors | 132.09±36.2c | 2.91±1.00c | 98.95±4.84c | 233.95 | |||
| Homegarden | 4.06±5.2a | 2.03±3.3a | 100.±15b | 106.09 | (Mihert Semere and Mesele Negash, 2019) | ||
| Woodlot | 3.76±5a | 1.9±1.3b | 72.9±14a | 78.56 | |||
| Cultivate | - | - | 73±20a | 73 | |||
| Dense forest | 65.81 ± 18.50a | 11.38 ± 2.61b | 102.33±13.1a | 179.52 | (Solomon, 2018) | ||
| Open forest | 12.67 ± 2.22b | 2.92 ± 0.41b | 87.55±12.73a | 103.14 | |||
| Grassland | 3.43 ± 0.33b | 1.02 ± 0.08b | 103.13±6.75a | 107.58 | |||
| Natural forest | 116.46 ± 17.81 | 23.29 ± 3.56 | 339.19±21.09 | 0.69±0.08 | 478.94 | (Tessema and Kibebew, 2019) | |
| Coffee agroforestry | 17.26 ± 1.9 | 3.43 ± 0.34 | 249.69±28.13 | 3.43 ± 0.34 | 270.38 | ||
| Grazing land | 155.13±11.46 | 155.13 | |||||
| Crop land | 138±0.95 | 138 | |||||
Table 3: Comparative of carbon stock along different land use from part of Ethiopia.
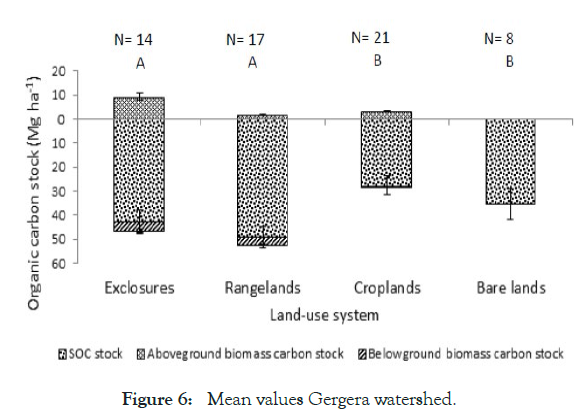
Figure 6: Mean values Gergera watershed.
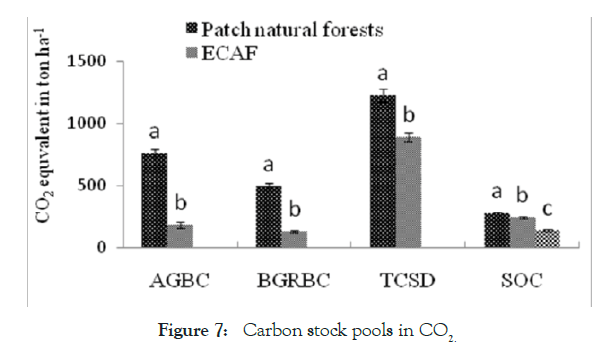
Figure 7: Carbon stock pools in CO2.
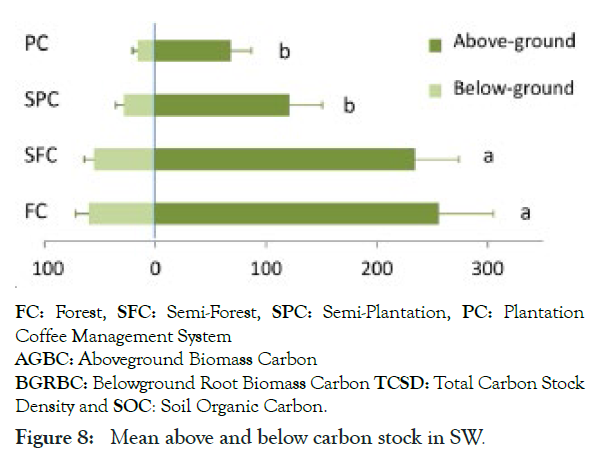
Figure 8: Mean above and below carbon stock in SW.
In terms of exclosure of degraded area as stated by Manaye et al. [31], they were significantly different (p<.001). The total carbon stocks biomass between exclosure (EXs) and adjacent degraded open grass land (DOGL). This was a lined with finding of Gessesse [38] in Gergera watershed, the highest carbon stock was estimated in exclosures (54 ± 5 Mg ha-1) ≈ rangelands (54 ± 4 Mg ha-1)> croplands (30 ± 4 Mg ha-1) ≈ bare lands (29 ± 6 Mg ha-1).
In addition, numerous studies have been made effort on contribution of agroforestry for carbon stock. Regarding to this nearly estimated by Semere and Negash [39] in Chehawereda, Gurage zone, the total biomass carbon stock in home garden and woodlot agroforestry systems 6.092 ± 2.3a and 4.74 ± 6.3a recorded respectively. This stated that the highest biomass recorded in home garden than woodlot. Other study similarly reported by Abaoli [40] in Jimma, the total carbon stock in native forest; coffee based agroforestry and annual crop field land were 230.09 ± 27.88, 150.73 ± 12.21 and 65.40 ± 2.64 Mgha-1 respectively. This also shows the difference across land use types. As well as, the total carbon stock density (TCSD) high recorded in the patch natural forests than Enset-Coffee based agroforestry (ECAF). The CO2-e in the soil organic carbon stock of the patch natural forests (41.88%) and ECAF (36.72%) were significantly (p < 0.05) higher than in annual agricultural land uses (21.4%) as reported by Molla et al., [41]. This was agree with findings of Gessesse [38].
Regarding to ecosystem management, the Mean total carbon stocks differed significantly between management system (F3, 56=4.75, P=0.005) clearly described in Figure 8 as reported in the South West Ethiopian highlands by Matthias et al. [42]. For instance, the largest mean total carbon stock recorded natural forest systems which account (413 ± 55.6 S.E.Mg ha-1). This significantly higher than the semi-plantation (P=0.014) and plantation (P=0.003) system, although the difference with the semi-forest system was not significant (P=0.68). Following, this accounted in semi-forest system (387 ± 50.0 Mg ha-1) which was significantly more carbon than the semi-plantation (258 ± 39.4 Mg ha-1, P=0.04) and plantation system (219 ± 22.8 Mg ha-1, P=0.008), this consistence with finding [38].
Effect of land use change on biodiversity and carbon stock
Effect of land use change on species diversity
Based from literature evidence land use change significantly affect species diversity.as observed in Table 4. The difference woody species diversity across land-use systems showed the positive and negative effect and every one showed significant difference at p-value < 0.05. Many, study were reported the importance of exclosure importance for enhancement of wood species diversity.
| Land use types | Richness(Spp.ha1) | Shannon index | Evenness | Source |
|---|---|---|---|---|
| Exclosure | 12 (0.70)a | 1.59 (0.07)a | 0.43 (0.03)c | (Abrha Brhan Gebre et al., 2018) |
| Agroforestry | 4.33 (0.57)b | 0.89 (0.13)b | 0.67 (0.05)b | |
| Woodlot | 1.13 (0.09)c | 0.02 (0.01)c | 0.94 (0.04)a | |
| SFC | 44 | 2.75 | 0.35 | (Dereje, 2016) |
| Cropland | 9 | 1.90 | 0.74 | |
| Woodland | 27 | 2.18 | 0.33 | |
| Pasture | 14 | 2.43 | 0.81 | |
| DNF | 32 | 2.82 | 0.53 | |
| Plantation | 13 | 1.47 | 0.33 | |
| EXs | 11 ± 4b | 1.86 ± 0.3b | 0.79 ± 0.07a | (Manaye et al., 2019) |
| DOGl | 7±2a | 1.40 ± 0.32a | 0.76 ± 0.1a | |
| Open grass | 0.17a ± 0.03(WG) | (MelkamuTerefe Asmare and Abdella Gure, 2019) | ||
| Exclosure | 0.3b ± 0.05(WG) | |||
| AE | 4.72 + 0.18 | 1.25 + 0.04 | 0.84+ 0.02 | (Tesfay et al., 2019) |
| CGL | 2.89 + 0.13 | 0.81 + 0.04 | 0.77 + 0.02 |
Table 4: Shannon indices, richness and evenness of along different land use types.
Different land use types include different species richness, evenness and Shannon index. All this decreased from the natural vegetation to the highly modified landscapes (cropland, monoculture plantation and pasture). Inversely, there have been high in management area like exclosure, agroforestry instead of cropland and open communal grassland. This reviewed, revealed that the wood species diversity were recorded in exclosure above agroforestry and woodlot as stated by Gebre et al. [32]. likely the Shannon diversity index of browses plant species recorded in 1.25 ± 0.04 the area exclosure, which huge higher than 0.81 ± 0.04 recorded in communal grass land (CGL) reported by Tesfay et al. [35]. This may be result from repeated habitat disturbances within the CGL due to frequent and intensive interference of both humans and livestock for grazing and other communal uses. This line with [31] the species richness, abundance, Shannon diversity, Simpson diversity indices 6.41 ± 7.30b, 1.73 ± 1.97b, 52 ± 18b and 2.16 ± 1.64a, 0.58 ± 0.44a an 38 ± 14a recorded in Exclosure and degraded open grass land respectively. The conversion of DOGL to EXs enhanced the Shannon diversity and Simpson diversity indices by 33% and 16%, respectively. Also, similar report found by Asmare and Gure [33] in Tehnan district north western Ethiopia. This empirical evidence showed that exclosure was appropriate conservation strategies of degraded land that would contribute to reinforce species diversity. Variety of studies made on exclosures established in Tigray, Ethiopia confirmed this [34,35].
Other study were reported by Dereje [34] described that the management and modification land use could influence the woody species richness and variety. The very best and least woody species were obtained from SFC, which was 2.75 and 1.90 in cropland respectively. Following this least species richness was recorded from the manmade monoculture plantations of exotic species. This stated that the conversion of natural forest in to cropland, pasture and manmade monoculture plantation forests decrease plant species diversity and richness. This accept as true with land changed from undisturbed state to more intensive uses like farming, livestock grazing, selective tree harvesting could lead on biodiversity loss [36-44]. Also other encourage result on LULC change could led to the loss of fertile soil and biodiversity reported by different author [45,46] in several part of Ethiopia.
Further globally, natural land cover has been transformed by human activities explanation for biodiversity loss within the world [47]. The only most vital factor [48]. This implies that LULC change caused for the loss of biodiversity in both flora and fauna and results in a decline in ecosystem integrity and loss of plant genetic resources.
Effect of land use change on carbon stock
In fact LULC change not only affect biodiversity like this, the evidence from this review described in Table 4 and Figures 6-8, that the mean carbon stock potential were statistically significant difference among land use type at p<0.05 and highly influenced by land use change.
For instance, the study on Agro-forestry and Adjacent Cultivated Land, in Chehawereda, Gurage zone, Ethiopia by [39], revealed that total biomass carbon stocks were highest in home garden as compared to woodlot. This line with finding of Molla et al. [41] indicate that the CO2-e in the soil organic carbon stock of the patch natural forests (41.88%) and Enset-Coffee based agroforestry (ECAF) (36.72%) higher than in annual agricultural land uses (21.4%). This could be due to includes diversified species of more trees in the systems and aboveground biomass increases [49,50]. This implies that, more diversity is store more carbon.
Other study, on effect of rehabilitation of degraded land on carbon and biodiversity by Manaye et al. [31] stated that the higher biomass carbon stock in exclosure (EXs) indicates that, the establishing exclosure (EXs) supported by enrichment of planting within the degraded land enhances biomass carbon stock. This is a lined with finding of Gessesse et al. [38] above ground carbon stock of exclosure recorded higher than other land use in Gergara watershed. This is due to a higher number of stem density and basal area. Numerous studies in Ethiopia and elsewhere in the tropics reported similar findings [51,52]. This might be due to increased vegetation composition and reduced erosion loss by established exclosure (EXs) on degraded open grass land (DOGL) were also reported in other studies in the tropics [53].
On other hand, other study by Tessema and Kibebew [54] on water shade of Ades, west Hararge reported from comparative natural forest with coffee agroforestry, grassland and crop land indicated that biomass carbon. The highest above carbon recorded 116.46 ± 17.81 and soil carbons 339.19 ± 21.09 from natural forest, while agroforestry 17.26 ± 1.9 and 249.69 ± 28.13 record from above and soil carbon respectively. The least soil carbon recorded from cropland. This may due to absence of trees on sample plots under crop and grazing lands. In addition, the natural forest was found to have significantly higher biomass carbon stock compared with the coffee agroforestry. This is a lined with Kauffman et al. [55], reported that, of the conversion of natural scenery to human modified landscapes also affects the live carbon storage in the living plant biomass. Similarly other finding by Lemma et al. [56] in the southwestern highlands of Ethiopia, indicated that the total SOC from the depth 50 of cm was 176.6, 101.2, 170.9, 130.6 and 180.4 Mg ha-1 in the native forest, farmland, C. lusitanica, P. patula and E. grandis stands, respectively. This variation happened due to deforestation and cultivation was loss 75.4 Mg ha-1. Also other study was undertaken by Abaoli [40] On Jimma high land described that the land conversion Later to 20 years lost the amount of biomass carbon about 56.65% and 99.97% of the original biomass C in the native forest due to conversion to coffee-based agroforestry and due to the conversion to annual crop respectively.
In other ways the variation between natural forest (NF) and plantation may be more diverse species communities, more C store types, higher quantity and better quality of above and belowground litter materials under the natural forest (NF) than under the plantations and site disturbance during the establishment of plantations [57]. This agree with a lot of finding in Ethiopia the loss of SOC derived from the forest origin in the 0-10 cm layer after 53 years of continuous cultivation calculated to be 74.6% under the natural forest and Nearly 62% of the forest resulting SOC was lost during the first C [58,59]. As well as, management could influence the terrestrial biomass and carbon. The above- ground carbon stock decreased mainly from the semi-forest to the semi-plantation system, whereas it did not decline from natural forest to semi-forest or from semi-plantation to shade plantation, respectively [42]. Likely, many other study have considered the effects of land use and their management on soil properties by Alemayehu, Yimer et al. [60-62]. This, due to diverse species communities more C store types, higher quantity and better quality of above- and belowground litter materials under the NF than under the plantations and site disturbance during the establishment of plantations [57-61]. All this confirmed due to land use changes and disturbances and this could enhance the climate change [11].
Implications for sustainable conservation of biodiversity
As exploration of this review implies is clearly define appropriate land use management practice which could help for synergy conservation of biodiversity and carbon stock development of an ecologically sound and socio-economically sensitive approach to the management of ecosystem service provided by biodiversity at landscapes of Ethiopia on agricultural land scape, adopting agroforestry practice become huge attention in terms of sustainable agricultural productivity, to sequester high potential of biomass and SOC, to generate income for farmer to improve their livelihood [63], to reduce soil degradation [64], and it also supposed to have potential to sequester carbon and mitigate the greenhouse effect [65]. Additionally, the conservation of woody species in the cultivated landscape through agroforestry could reduce the impact on remnant forest [66]. Since over all, Agroforestry could bring together trees, crops, and livestock. Hence that, it has suggested that incorporate trees into the land are an option to diversify income, conserve biodiversity, adapt to or mitigate climate change, and enhancing soil fertility [67]. Also IPCC [68] suggested that the integration of agroforestry and forests into conservation the use of REDD+ will promote climate adaptation benefits in addition to its socio-economic and ecological benefits. However, REDD+ incentives and their effectiveness will depend on and are affected by the use, ownership and management of forest and agro forest resources [69].
At steep, eroded and degraded area with collaboration of local government and governmental [70] could advance plant and animal biodiversity [71]. As well as, conservation of the remnant habitat and restoration of degraded lands they could reverse all ecosystem goods and services.
Generally the result from this reviewed revealed, land use changes and their associated management can influence both biodiversity and carbon stock. as a result highlighted unsustainable land management practices (deforestation, uncontrolled grazing, planting and settlement were the most drivers for plant species loss and increased CO2 emissions in Ethiopia. particularly, open grazing and conversion of other land use in to crop land showed massive loss of biodiversity and carbon stock potential. This might be contributed for species extinction and rise more global warming. Hence, that the understanding the driver force and consequence of the LULC change on plant diversity and carbon stock is crucial for Suggesting the integrative sustainable conservation option at landscape levels.so that, the establishment of exclosures, conservation and restoration the simplest and confirmed conservation approach could improve both wood species diversity and carbon potential. Additionally, adopting agroforestry practice on agricultural land an alternative choice for rising wood diversity, carbon potential and prove sustainable production. Supported this reviewed result the subsequent recommendation forwarded:
• Practice land use planning to allocate lands to different land uses across the landscape in a way that balances economic, social, and environmental values.
• The governmental, NGO and researcher should promote different agroforestry practices, adopting challenges and its contribution for multi benefit.
• Furthermore, further study are going to be specialize in the mixing of biodiversity and carbon stock contribution instead of separate and value of ecosystem permanently and repair.
• Like natural forest; the people would enjoy carbon credit schemes additionally other benefits of agroforestry.so that Government, non-government organization and researcher should be consider how agroforestry based payment will be contribute for sustainable forest management and scale up REDD+ at agricultural landscape.
Citation: Abdela T (2021) Effect of Land Use Change on Wood Species Diversity, Carbon Stock and Implication for Sustainable Conservation of Biodiversity in Ethiopia. J Forest Res. 10:257.
Received: 11-Mar-2021 Accepted: 07-Apr-2021 Published: 14-Apr-2021 , DOI: 10.35248/2168-9776.21.10.257
Copyright: © 2021 Abdela T. This is an open-access article distributed under the terms of the Creative Commons Attribution License, which permits unrestricted use, distribution, and reproduction in any medium, provided the original author and source are credited.