International Journal of Physical Medicine & Rehabilitation
Open Access
ISSN: 2329-9096
ISSN: 2329-9096
Research Article - (2020)Volume 8, Issue 1
Objective: This study aimed to determine whether optokinetic stimulation (OKS) in the virtual reality (VR) environment via a head - mounted display (HMD) could significantly shift weight bearing (shift of the center of pressure (CoP) position) during gait movement in healthy subjects. Patients with hemi - plegia after stroke exhibit postural instability with weight-bearing shift to the non - paretic side. This adversely affects activities of daily living, and increases the risk of falls during gait movement.Increasing the CoP on the paretic direction, and correcting the asymmetry are considered important for addressing the problems.
Methods: The present study investigated the effect of OKS in a VR environment on posture balance, and assessed whether the stimulation could induce a stable shift of CoP during gait movement as well as during static standing. CoP during static standing, and the foot pressure during gait were measured to evaluate the weight-bearing balance. For OKS, a pattern of random dots was presented and was continuously moved in horizontal (HOKS) and torsional (TOKS) directions through an HMD.
Results: Based on the overall results of CoP sway parameters in response to various OKS velocities in the balance test, OKS velocity of 40°/s was adopted for gait test. Both HOKS and TOKS induced a lateral deviation of the walking trajectory, a significant increase in stance period, and foot sole pressure on the stimulation side, which indicated lateral weight-bearing shift to the direction of OKS.
Conclusion: The results indicate that OKS through HMD-VR can induce significant weight-bearing shift during gait movement as well as during static standing, suggesting that the approach can be applied to gait exercise training for the patients with hemiplegia as an effective tool with extensibilities.
Optokinetic stimulation Head-mounted display; Virtual reality; Center of pressure; Weight-bearing; Posture balance; Gait characteristics
CoP: Center of Pressure; OKS: Optokinetic Stimulation; HOKS: Horizontal Optokinetic Stimulation; TOKS: Torsional Optokinetic Stimulation.
Patients with stroke are often characterized by their standing posture, preferring the non-paretic side for bearing weight, and thereby inducing a paretic/non-paretic (lateral) asymmetry (lateral asymmetry) [1-4]. Such patients tend to have a greater postural sway of the CoP during steady standing [5]. Lateral asymmetry in posture balance is also observed during walking. The extent of asymmetry is closely related to a decrease in gait velocity, and step length on the paretic side [6]. In addition, as the asymmetric ratio of single-support time increases, the risk of falling rises [7]. Thus, reducing lateral asymmetry by weight-bearing shifting to the paretic side would be a worthy goal to improve both walking ability and fall prevention [8]. In a conventional physical therapy, a simple exercise, using the motor development theory, and neurodevelopmental approach (which is based on motor learning theory) is typically performed. However, such a strategy has been proven to be ineffective in improving the asymmetry in gait parameters [9]. Some reports suggest that rehabilitation using a treadmill or by task-related training, which could induce weightbalance shift, may have better effects than the typical exercise training [10-13]. Moreover, other studies suggested that poor posture balance results not only from motor control impairment but also from an altered body representation in space, which involves various kinds of sensory information such as: visual, vestibular, and somatosensory [14-18].
While various sensory stimulations provide a certain effect on improving the postural deficits in patients with stroke, no ideal training method for lateral asymmetry of gait has been established. Previous studies on visual approach using OKS in normal subjects have focused on either an increase in sway of the CoP (i.e., postural instability), or a higher cognitive process, (i.e., vection), but not on unilateral weight-balance shift [19-21]. The effect of unilateral balance shift by OKS in static standing condition is reported in some studies on patients with stroke; however, the effect appears inadequate for the approach to be applied in posture-balance training [22]. Visual approach using prism adaptation has, however, been demonstrated to improve unilateral spatial neglect, and weight balance deviation [23,24], suggesting the possibility of a sensory approach. Recently, a new style of an HMD has been developed, which is a specially designed VR display that provides a high level of visual fidelity, and an immersive, wide stereoscopic three-dimensional (3D) field of view with high refresh rates.
Thus, this study aimed to examine whether OKS provided by a wearable HMD-VR device with an immersive 3D environment may effectively induce weight-bearing shift during gait movement and during static standing in normal subjects. The scalability of the device for gait training exercise in patients with stroke is also explored in this study.
Subjects
Forty-one healthy subjects, 27 males and 14 females (21.1 ± 1.6 years), were enrolled in this cross-sectional study. After applying the following exclusion criteria: impaired vision, visual field disturbances, and orthopedic disorders significantly affecting the gait of participants, 27 subjects participated in the static balance test, and 21 in the gait test; 7 subjects (5 males and 2 females) participated in both tests. This study was conducted in a laboratory of the Health Science University. All studies conform to the Helsinki Declaration, and were approved by the appropriate research ethics committee of the Health Science University. A signed informed consent was obtained from all participants.
Static balance test
An immersive VR environment was projected, using a stereoscopic HMD (Oculus Rift CV1, Oculus VR, LLC, Irvine, Newport Beach, CA, USA). The virtual image system was developed, using Unity3D (Unity Technologies, San Francisco, CA, USA). Three thousand small white virtual spheres (each measuring 25 cm in diameter) were randomly distributed on the inner black-colored surface of a virtual sphere that had a 16-m radius from the center of the subject’s eyes. For OKS, the entire 3D field with the small spheres was rotated around the subject’s longitudinal axis (HOKS), or frontal axis (TOKS) at one of five different velocities (i.e., 20, 40, 60, 80, and 100°/s), with each velocity being maintained for 30 s. We routinely used a rightward direction for HOKS, and a clockwise direction for TOKS. A stationary visual state that displayed the same optokinetic pattern with no movement was used as control (stationary condition).
Participants wearing the HMD stood quietly for 40 s during each recording (10 s for the waiting period, and 30 s for the recording period), with their feet placed parallel to each other on a stabilometric platform (Gravicoder GP-5000, ANIMA Co., Ltd., Tokyo, Japan) which is used to record CoP displacement. The participants were told to look at the whole visual field. CoP data, which were collected at a sampling frequency of 100 Hz, were evaluated offline using MATLAB (Math Works Inc., Natick, MA, USA) to analyze the following CoP parameters: sway path (SP), sway area (SA), sway vector, sway mean, and sway slope. SP is the total distance of CoP displacement on a two-dimensional surface of the stabilometric platform which was obtained by combining the x-axis (right-left axis), and y-axis (antero-posterior axis) components. SA was calculated by multiplying the distribution width (distance between the highest and lowest x-axis coordinates) by the height (distance between the highest, and lowest y-axis coordinates) of the CoP trajectory during each recording period. Sway vector (SV) is the distance from the origin of the coordinates, and the counterclockwise angle from the x-axis (rightward: 0°; leftward: 180°) of the CoP position at each sampling time which was obtained based on the study of Kitabayashi et al. [25]. The counterclockwise angle was divided into eight sectors, and each sector had an angle of 45°. Each SV was classified into eight groups according to the sector it fell into. Moreover, sway means were the average values of CoP positions of the x-and y-axis components. Sway slopes were calculated to examine the time course of the CoP deviation. For each condition, the slope was based on least squares linear regression approximation fitted over a recording period of CoP trajectory data of x-or y-axis components.
Gait analysis
The gait test was performed in a flat unobstructed hallway with a floor-line marked at a distance of 4 m. To ensure a natural gait, the cadence, and speed of walking were not controlled. Similar to the static balance experiment, the gait test employed HOKS and TOKS, using an HMD at a velocity of 40°/s. The subjects maintained an upright position for 15 s at the beginning of the gait test, and were asked to look at the whole visual field. Subsequently, they started walking at their own pace during which OKS was maintained continuously, and the trajectory was measured using simultaneous video recordings (HC-V360MS, Panasonic Corporation, Osaka, Japan) of the front and side directions. Retro-reflective markers were placed on the chest, and acromion of each subject. Kinovea motion detection software (version 0.8.24, Kinovea, www.kinovea.org) was used for the offline analysis of the two-dimensional reconstruction of the walking trajectory. The rightward deviation of the walking trajectory was quantified by fitting a quadratic function: y (t)=k•t2 , where y is the distance of the y-coordinate of the trajectory position at time (t) from the x-axis (a straight line along which the subjects are instructed to walk down), and k is the quadratic function coefficient. Foot pressure (FP) was recorded using an insole pressure recording system (BodiTrak Insole System, VISTA MEDICAL, Ltd., Winnipeg, MB, Canada). The center of the foot pressure position (CFP) was calculated according to the method of Luximon et al. [26] to indicate the CoP deviation in the mediolateral direction from the foot centerline during the stance phase. Positive and negative CFP values indicated lateral and medial deviations, respectively.
Statistical significance was examined using GraphPad Prism version 6 (GraphPad, La Jolla, CA, USA). For the static bas used to evalualance test, a one-way analysis of variance (ANOVA) with Dunnett’s multiple comparison post hoc test wate the effects of OKS velocity on the CoP parameters. A paired t test was employed to compare the SP between HOKS and TOKS for different OKS velocities. For the gait analysis, one-way ANOVA and Dunnett’s multiple comparison post hoc tests were used to evaluate the differences in the values of the gait parameters among the following three conditions: stationary, HOKS, and TOKS. p<0.05 was considered as statistically significant. Sample size was calculated, using the G*power software, version 3.0 (Heinrich-Heine University, Dusseldorf, Germany). A result with a value of >80% was considered adequate [27].
CoP in the static balance test during OKS
Velocity characteristic of OKS was firstly examined in the static balance test condition. In the stationary condition, the CoP was generally distributed in the area near the center (Figure 1A). As shown in a previous study, both HOKS and TOKS tended to increase displacement of CoP position, and CoP was spread over the distribution range during stationary condition (Figures 1B and 1C). SA values during HOKS and TOKS were significantly larger than the SA values during the stationary state (Table 1). Correspondingly, the total SP was also significantly larger than that during the stationary condition (Table 1). In contrast to the instability increase during OKSs, the distribution range of CoP position tended to shift to the rightward direction based on the three different line colors, representing the three transition time periods during recording (Figures 1B and 1C). This deviation in the two-dimensional space was evaluated using the following three metrics: SV, sway mean, and CoP slope. The SV magnitude for the example in (Figure 1) along the 0° direction (rightward) was 0.71, 0.98, and 2.52 cm for the stationary condition, HOKS, and TOKS, respectively. The differences in the corresponding means of the SV magnitude among the subjects were highly significant, indicating that the magnitude of the effect was greater in both HOKS and TOKS than in the stationary condition (Table 1). By contrast, no significant difference in SV magnitude was observed among any stimulus conditions along the 90° direction (forward), 180° direction (leftward), or 270° direction (backward). For the sw - ay mean values along the xaxis, a significant difference was f - ound at 40°/s for HOKS, and 2060°/s for TOKS (Table 1). The rightward shift of CoP position was also analyzed by estimating the linear regression slope for the x-axis CoP positions. In both HOKS and TOKS, the CoP slope for all stimulus velocities was positive (with significantly greater values 40–60°/s for HOKS, and 20- 60°/s for TOKS than for the stationary condition) (Table 1). This reveals that, with time, both HOKS, and TOKS shifted CoP rightward (where the stimulation directed).
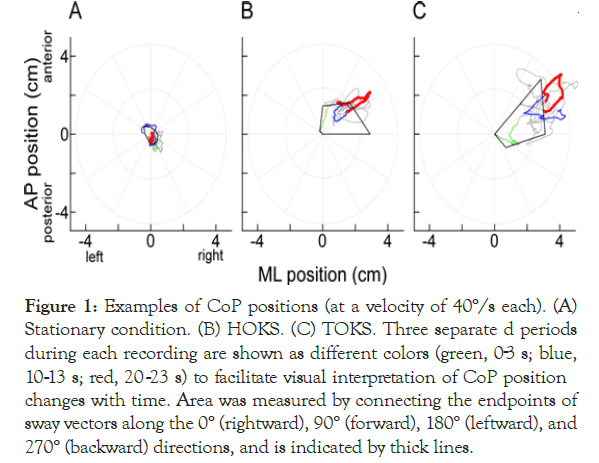
Figure 1. Examples of CoP positions (at a velocity of 40°/s each). (A) Stationary condition. (B) HOKS. (C) TOKS. Three separate d periods during each recording are shown as different colors (green, 03 s; blue, 10-13 s; red, 20-23 s) to facilitate visual interpretation of CoP position changes with time. Area was measured by connecting the endpoints of sway vectors along the 0° (rightward), 90° (forward), 180° (leftward), and 270° (backward) directions, and is indicated by thick lines.
| Stationary | HOKS | TOKS | ||||||||||
|---|---|---|---|---|---|---|---|---|---|---|---|---|
| OKS velocity (°/s) | 0 | 20 | 40 | 60 | 80 | 100 | 20 | 40 | 60 | 80 | 100 | |
| Sway path (cm) | 34.9 | 45.1* | 48.2† | 48† | 47.8† | 47.6 | 70† | 72.4† | 65.8† | 60.9† | 57.9† | |
| (7.6) | (17.1) | (19.8) | (18.8) | (18.7) | (22.6) | (26.5) | (31.4) | (27.6) | (25.4) | (24) | ||
| Sway area (cm2) | 3.9 | 6.2 | 6.7* | 7.2* | 7.7* | 9.7 | 13.7† | 15.9† | 14.1† | 14.6* | 11.2 | |
| (2) | (5.2) | (4.3) | (6.1) | (6.1) | (17.4) | (8.7) | (14) | (13.4) | (18.3) | (11.1) | ||
| Sway vector | rightward | 0.33 | 0.61 | 0.93† | 0.76* | 0.86† | 0.77 | 1.15† | 1.41† | 1.31† | 1.2† | 0.93 |
| (0°) | (0.26) | (0.57) | (0.87) | (0.86) | (0.66) | (0.83) | (0.77) | (0.91) | (0.76) | (0.84) | (0.59) | |
| forward | 0.51 | 0.77 | 0.75 | 0.82 | 0.67 | 0.78 | 0.8 | 1.09 | 0.88 | 1.03 | 0.66 | |
| (90°) | (0.42) | (0.47) | (0.72) | (0.69) | (0.5) | (0.76) | (0.64) | (1.08) | (0.84) | (0.95) | (0.57) | |
| leftward | 0.53 | 0.48 | 0.34 | 0.7 | 0.46 | 0.58 | 0.65 | 0.42 | 0.5 | 0.78 | 0.82 | |
| (180°) | (0.35) | (0.37) | (0.37) | (0.63) | (0.38) | (0.69) | (0.71) | (0.4) | (0.47) | (1.3) | (1.03) | |
| backward | 0.49 | 0.46 | 0.7 | 0.54 | 0.72 | 0.54 | 0.79 | 0.59 | 0.78 | 0.67 | 0.95 | |
| (270°) | (0.39) | (0.4) | (0.59) | (0.47) | (0.51) | (0.57) | (0.62) | (0.73) | (0.76) | (0.81) | (1.29) | |
| Sway mean (cm) |
x-axis | -0.12 | 0.01 | 0.39† | 0.17 | 0.15 | 0.18 | 0.51† | 0.81† | 0.75† | 0.33 | 0.11 |
| (0.4) | (0.53) | (0.53) | (0.61) | (0.5) | (0.72) | (0.9) | (0.73) | (0.68) | (1.16) | (1.06) | ||
| y-axis | 0.06 | 0.27 | 0.04 | 0.18 | -0.02 | 0.23 | 0.07 | 0.38 | 0.18 | 0.18 | -0.1 | |
| (0.48) | (0.6) | (0.64) | (0.64) | (0.58) | (0.77) | (0.72) | (0.99) | (0.65) | (0.82) | (0.82) | ||
| x-axis sway slope | slope | -0.46 | 0.39 | 1.47† | 0.92* | 0.91 | 0.84 | 2.07† | 2.58† | 2.05† | 1.21 | -0.14 |
| (1.54) | (2) | (2.04) | (2.18) | (2.97) | (2.13) | (2.47) | (2.38) | (1.91) | (3.15) | (3.07) | ||
| Pearson’s r | 0.29 | 0.32 | 0.26 | 0.32 | 0.42 | 0.31 | 0.34 | 0.32 | 0.32 | 0.33 | 0.33 | |
| (0.2) | (0.25) | (0.25) | (0.22) | (0.21) | (0.23) | (0.18) | (0.24) | (0.25) | (0.27) | (0.26) | ||
Note: Each value indicates mean (SD).
Pearson’s r: Pearson’s correlation coefficient r
*Dunnett's multiple comparisons test (p<0.05).
†Dunnett's multiple comparisons test (p<0.01)
Table 1: Results of CoP sway parameters in response to different OKS velocities in static balance test.
The results demonstrate that HOKS and TOKS induce a lateral (rightward) CoP shift as well as an increase in the CoP sway although a slight predominance of the effect was noted in TOKS compared to HOKS. Based on the overall results of the effect of OKS velocity, we used 40°/s for the gait experiment.
Walking trajectory and gait cycle during OKS
We investigated whether 40°/s of OKS provided by HMD could evoke a significant weight-bearing shift during walking. During the stationary condition, the walking trajectories of each subject were distributed around the x-axis, with some modest fluctuation to either side (Figure 2A).
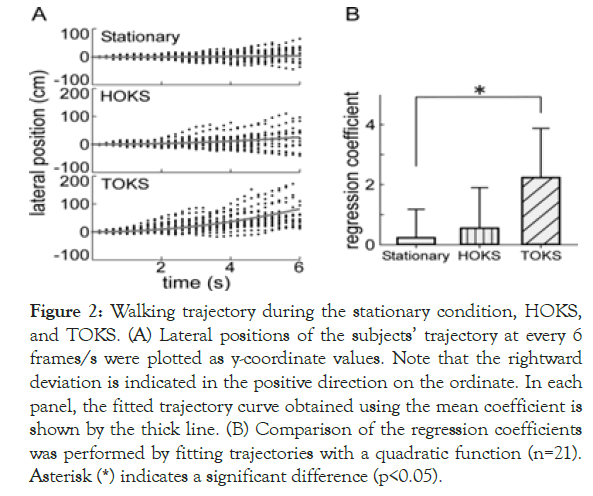
Figure 2. Walking trajectory during the stationary condition, HOKS, and TOKS. (A) Lateral positions of the subjects’ trajectory at every 6 frames/s were plotted as y-coordinate values. Note that the rightward deviation is indicated in the positive direction on the ordinate. In each panel, the fitted trajectory curve obtained using the mean coefficient is shown by the thick line. (B) Comparison of the regression coefficients was performed by fitting trajectories with a quadratic function (n=21). Asterisk (*) indicates a significant difference (p<0.05).
During HOKS, a rightward deviation was induced; nevertheless, the deviation range was similar to that of the stationary condition. During TOKS, a rightward deviation was clearly observed in all subjects, with a greater deviation than that of the stationary condition.
Because the walking trajectory of most subjects deviated in a curved manner rather than linearly, a statistical fitting of a quadratic function was performed on the time course to quantify the degree of deviation (Figure 2B). The regression coefficient for all subjects was 0.12 ± 0.9, 0.59 ± 1.3, and 2.28 ± 1.59 during the stationary condition, HOKS, and TOKS, respectively.
A significant difference was found in the means between TOKS, and the stationary condition [F (2,60)=14.79, p<0.01]; however, no difference in the mean between HOKS, and stationary condition was observed. The results suggested that TOKS had a stronger effect on shifting the walking trajectory rightward than HOKS.
For the gait cycle, the right leg stance phase was significantly longer, and the left leg stance phase was shorter in HOKS and TOKS than in the swing phase (Figure 3B), magnitude relationship between in the stationary condition (Figure 3A). By contrast, the limbs was reversed, i.e., a significantly shorter stance phase on the right leg and longer on the left leg were observed in both HOKS and TOKS. No significant difference was found in the stationary condition. These results suggest that HOKS and TOKS changed the gait cycles, thereby increasing the weight balance toward the right side by lengthening the stance phase of the right leg.
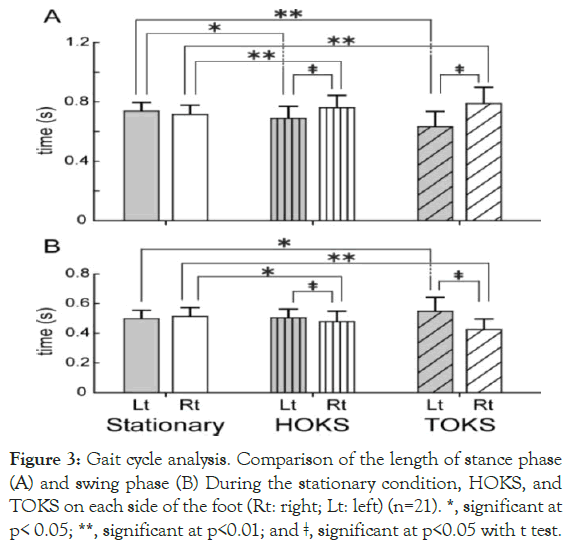
Figure 3. Gait cycle analysis. Comparison of the length of stance phase (A) and swing phase (B) During the stationary condition, HOKS, and TOKS on each side of the foot (Rt: right; Lt: left) (n=21). *, significant at p< 0.05; **, significant at p<0.01; and ǂ, significant at p<0.05 with t test.
Mean foot sole pressure during stance phase
The lateral (rightward) shift found in the walking trajectory and gait cycle begs the question of whether such change would be accompanied by an actual change in the FP during the stance phase. To clarify this, mean FP during OKS was measured for both feet (Figure 4). A significant difference in the mean of the right FP during the stance phase between HOKS and the stationary condition was found. During TOKS, the mean of the right FP was significantly greater than the mean of the left FP, suggesting that weight bearing increased in the right foot.
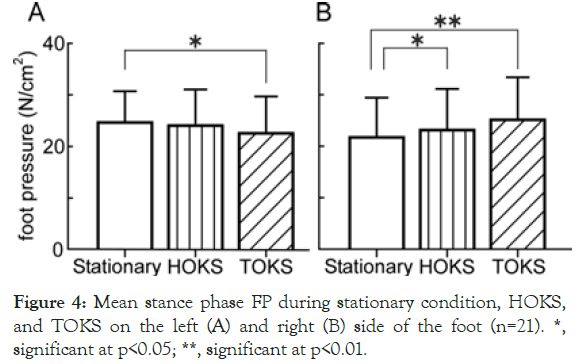
Figure 4. Mean stance phase FP during stationary condition, HOKS, and TOKS on the left (A) and right (B) side of the foot (n=21). *, significant at p<0.05; **, significant at p<0.01.
Changes in the center of FP position
To determine the detailed effects of OKS on FP changes during the stance phase, we examined the CFP based on pressure distribution on the soles of both feet (Figure 5).
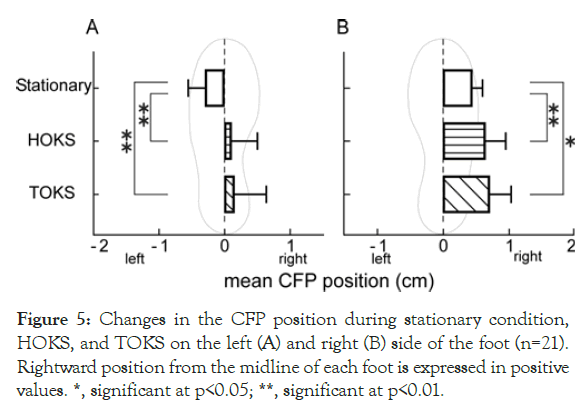
Figure 5. Changes in the CFP position during stationary condition, HOKS, and TOKS on the left (A) and right (B) side of the foot (n=21). Rightward position from the midline of each foot is expressed in positive values. *, significant at p<0.05; **, significant at p<0.01.
During stationary conditions, the CFP position was located laterally from the midline of the foot sole in both feet, with a value of 0.44 ± 0.22 cm and -0.29 ± 0.25 cm for the right and left foot, respectively. No significant difference between the left and right foot was found (p=0.08).
During HOKS and TOKS, CFPs on both sides (right, 0.64 ± 0.33 cm; left, -0.07 ± 0.39 cm for HOKS, and right, 0.71 ± 0.47 cm; left, -0.12 ± 0.49 cm for TOKS) significantly shifted to the right side compared to those during stationary conditions (Figures 5A and 5B); consequently, the left CFP significantly shifted to the medial side, and the right CFP to the lateral side.
These results demonstrated a rightward weight-bearing shift on the foot sole surface in both feet during TOKS and HOKS, which also shows that a rightward shift in weight bearing is associated with not only right-left foot balance but also the balance within each foot.
The purpose of our study was to clarify the effect of simple OKS in an immersive VR environment on weight-bearing shift during gait movement as well as during quiet standing. The device used in this study (Oculus Rift) could provide not only a whole-field visual scene motion but also a high-fidelity VR environment through a positional-tracking sensor of the wearer’s head motions that adjust the external image according to the head motion. This device, which was first developed for academic research, could also be used in designs, business, arts, and entertainment, and its effectiveness is demonstrated in various fields, including medical education, and museum exhibition description [28,29]. Our results showed that OKS via HMD-VR induces a significant increase in both stance time and FP on the stimulation side, which in turn resulted in a lateral deviation of the walking direction. These findings strongly suggest that a weight-bearing shift toward the stimulation direction during gait and that the device could serve as a useful exercise tool during gait for patients with stroke.
Patients with hemiplegic stroke with a higher degree of lateral asymmetry have an increased risk of falls [30,31]. Previous reports suggested that rehabilitation, using task-related training, or treadmill training combined with video games, or a visual scene motion on a large screen could improve such asymmetry compared to the standard strengthening methods with traditional gymnasium equipment [12,13,32,33]. In our study, we showed that the use of wearable HMD-VR device during gait may benefit not only the inpatients but also those with stroke who were discharged home.
The OKS in a VR environment in this study contained 3000 small virtual spheres distributed randomly at 16-m distance from the subject’s eyes. In our preliminary study, the optimal set of parameters, such as the number and size of the small virtual spheres, and distance (radius of the whole virtual space sphere) were determined based on the results of the magnitude of lateral CoP sway, or occasionally, illusory effect perceived by several subjects. For OKS velocity, 40°/s of OKS was routinely used for both HOKS and TOKS to induce deviation to a lateral direction based on the overall effect on the CoP sway parameters. Moreover, at a velocity >40°/s, approximately one fifth of the subjects (HOKS, 14.8% (4/27); 22.2% (6/27), TOKS) experienced some dizziness. In the gait test, no subject experienced either dizziness, or discomfort with the velocity. Nevertheless, visual display technologies, especially HMD, have generally been shown to be associated with “cybersickness”, resulting in nausea, headaches, and dizziness [34,35]. The velocity of 40°/s seems to be a moderate condition that is suitable for weight-bearing shift and reduces the subject’s load, which could be an important consideration for clinical use. The OKS velocities used in previous studies were as follows: HOKS and/or TOKS, 20°/s [36,37]; TOKS, 40°/s [19]; HOKS or TOKS, 60°/s [22,38]; and HOKS, 20–100°/s [20]. Although the OKS in previous studies were presented by a pattern rotation or screen projection, the range of velocities seems to be similar to that used in our study. However, in the previous studies, the effect of CoP deviation to a certain direction has not been consistently observed. This could be because the focus of the reports was on the overall increase in CoP sway (i.e., instability). To the best of our knowledge, no study has focused primarily on the effect of OKS via immersive HMD-VR on weight-bearing shift, especially during gait movement from the viewpoint of rehabilitation.
In this study, we did not test our stimulus condition in elderly patients or those with stroke because our primary goal was to determine how to shift weight bearing in a stable and safe way. The OKS approach via HMD-VR may result in qualitatively different responsiveness among elderly patients, or those with stroke although our preliminary work with elderly subjects suggests that the preferred OKS velocity of 40°/s could produce similar weight-bearing shifts during both static and gait conditions without signs of dizziness or falls. Moreover, our study utilized an extremely simple 3D pattern. Owing to recent developments, VR technology has successfully advanced in its creation of a realistic environment by combining non-visual sensory information such as vestibular, auditory, and somatosensory cues [39,40]. Thus, a more realistic stimulus pattern may result in a more effective exercise training program for posture–balance recovery in patients with stroke in the near future.
OKS via HMD-VR could induce a significant weight-bearing shift, and significantly change the gait parameters. OKS via a VR environment can have potential implications for rehabilitation after stroke.
This work was supported by the Japan Society for the Promotion of Science Grants in Aid for Scientific Research (KAKENHI) "(Grant Number JP19K19891)" and the Suzuken Memorial Foundation (Grant Number 19 -013).
The authors have no conflicts of interest to declare.
Citation: Komagata J, Sugiura A, Takamura H, Kitama T (2020) Effect of Optokinetic Stimulation in the Virtual Reality Environment on Weight- Bearing Shift During Gait Movement in Healthy Subjects. International Journal of Physical Medicine & Rehabilitation 8:537. DOI: 10.35248/ 2329-9096.20.08.537
Received: 12-Feb-2020 Accepted: 25-Feb-2020 Published: 03-Mar-2020 , DOI: 10.35248/2329-9096.20.08.537
Copyright: © 2020 Komagata J, et al. This is an open-access article distributed under the terms of the Creative Commons Attribution License, which permits unrestricted use, distribution, and reproduction in any medium, provided the original author and source are credited.
Sources of funding : This work was supported by the Japan Society for the Promotion of Science Grants in Aid for Scientific Research (KAKENHI) "(Grant Number JP19K19891)" and the Suzuken Memorial Foundation (Grant Number 19 -013).