Journal of Nutrition & Food Sciences
Open Access
ISSN: 2155-9600
+32 25889658
ISSN: 2155-9600
+32 25889658
Research Article - (2022)Volume 12, Issue 7
This study evaluated the effect of thickness and drying temperature on the physicochemical and geometric properties sweet potatoes. Sweet potatoes are an important root crop grown all over the world and consumed as a vegetable. Sweet potatoes are highly perishable due to high moisture content. Sweet potato plays an important role in ensuring food security and household income sources for local communities in Ethiopia. Drying temperature was influence the physico-chemical properties. At high thickness the physicochemical properties are high and vice versa. Drying sweet potato at different temperatures and by different thickness has a great difference in the moisture loss, the thickness which its 6 mm and dried at 80°C and which has 2 mm dried at 60°C their moisture contents were 82.33%and 79.53% respectively. Water activity which contribute microorganism growth also affected by thickness and temperature. It recommended that different materials are like slicer are needed and further researcher needed to study the texture, thermal properties and light power have to work properly without break in always. Therefore thickness and drying temperature affect the physico-chemical properties of the sweet potatoes.
Sweet potato; Physicochemical; Thickness; Temperature
Background
Sweet potato is a nutritious crop abundant in calories and bioactive compounds. It has been identified as a food security crop because it contains reasonable amounts of bioactive compounds such as b-carotene, ascorbic acid, polyphenols, dietary fiber as well as vitamins, minerals, and proteins [1-5].
The crop is still underutilized although it is rich in starch and carbohydrates and its flour can be used in different industrial applications [6-8]. The most commonly obtainable sweet potato varieties have purple, yellow, and white root tubers because of the distinct contents of phenolic compounds and pigments in their root tubers [9-12].
High quality sweet potato flour will be needed if the flour is going to be incorporated into other food products. However, there is lack of knowledge and understanding of physicochemical and geometric properties of sweet potatoes and the effect that the different processing methods have on these properties and functionality of the different components. Sweet potatoes are highly perishable due to high moisture content [13-18]. Drying and processing sweet potato into flour, which is an intermediate product, is one of the ways of minimizing postharvest losses and increasing the utilization of sweet potatoes. Therefore, the aim of this study was to determine the effect of drying temperature on the physicochemical and geometric properties of sweet potatoes.
Description study of area
The experiment was conducted in Jimma University College of Agriculture and Veterinary Medicine at department of Post- Harvest Management laboratory.
Sample collection and preparation
Fully matured and normal local sweet potatoes crops which are free from any defects were collected and purchased from Jimma city market town and it was transported into post-harvest management laboratory at Jimma University. After it was transported into laboratory, it put in deep freeze to maintain its shelf life as it is.
Data collected
Measurement of physico-chemical and geometric properties of sweet potatoes:
Materials and equipment
The following materials and equipment’s were used for doing the experiment.
• Water
• Caliper
• Sweet potato
• Oven dry
• Rapeseed
• Knife
• Analytical Balance
• Sieve
• Graduated beakers/cylinders
• Bowl
• Water activity meter
• Desiccators
• Cuvette
• Aluminum foil
Moisture content determination: Moisture content of the sweet potatoes was determined according to methods. Clean by washing with tap water and the thickness of sample were sliced by 2 mm, 4 mm, and 6 mm using knifes and put in oven at different temperature (60°C, 70°C and 80°C) respectively. To do this first clean and dry moisture dish were prepared and the weight was weight as W1. Representative sample (3 g) was placed on the dish and the weight taken (W2). It was placed in a hot air drying air, dried at 130°C for 1 hour, and cooled to room temperature. The weight after drying was measured as W3. Then by using the following formula:

Where: W1=Weight of moisture dish, W2=initial Weight of the sample and moisture dish before drying.
W3=Weight of moisture dish and sample after drying
Apparent density: Apparent density was determined according to by measuring weight and volume of the given sample. The volume of sample was determined by liquid displacement method. Then by dividing the sample weight to volume the apparent density will be obtained. First we measure the weight of sample using liquid displacement method and we measure the volume of sample using 1000 ml beaker having 600 ml of water then this volume was taken as V1. Then we transferred potato in to the beaker containing the water and we recorded the new volume as V2. After this we determined the volume of sample by subtracting volume of the water and potato (V2-V1). Finally we calculate the apparent density by dividing the mass of sample by the volume (V2-V1).
Bulk density (ρB): Bulk density was determined according to method of (K°C, 2008) by Weighing each representative samples (4.71 g, 5.84 g, and 6.33 g) for 2 mm, 4 mm and 6 mm respectively. Measure the volume of each of the samples bulk approximately using 10 ml cylinders, record it as V0 Calculate the bulk density by dividing the Mass (M) of the samples by its Volume (V0).

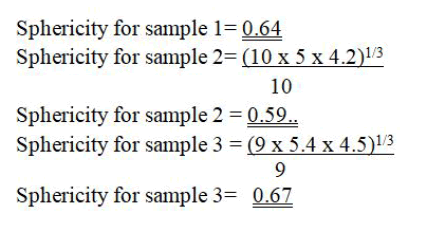
Sphericity: The sphericity of the three samples was measured using caliper instrument according to.

When a=length,
b=width and
C=thickness
Aspect ratio (RA: Aspect ratio of the three samples was determined from their width and length of sample.
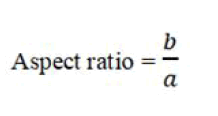
Where a and b are length and width respectively
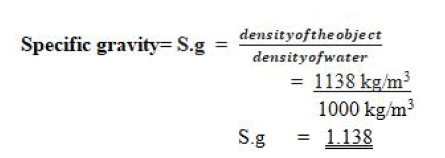
Specific gravity: The specific gravity was determined according to the ratio between the densities of an object to density of water.

Water activity: It is free water used for biological function. By making the sample powder form or fresh it is possible to measure water activity. This activity was done by using water activity meter.
Size: Size of the samples after and before drying was determined by using caliper.
Mass: The mass of the sample before drying and after drying was determined by using analytical balance.
Data analysis
Data analysis was carried out by using narration and descriptive statics. An excel application was used for the analysis the raw data.
Based on the data recorded above the result of each parameter before and after drying is mentioned as follows (Tables 1-3).
| Sample slices | |||
|---|---|---|---|
| Diameter (cm) | 2 mm slice | 4 mm slice | 6 mm slice |
| Major | 5 | 5.2 | 6 |
| Intermediate | 4.6 | 5.1 | 5.3 |
| Minor | 4.5 | 5 | 4.6 |
Table 1: Diameter (size) of sliced samples before drying.
| Sample slices | |||
|---|---|---|---|
| Diameter (cm) | 2 mm slice | 4 mm slice | 6 mm slice |
| Major | 4 | 4.5 | 5.6 |
| Intermediate | 3 | 4.4 | 5 |
| Minor | 2.5 | 4.1 | 4.2 |
Table 2: Diameter of sliced sample after drying.
| Sample slice | Mass before drying | Mass after drying |
|---|---|---|
| 2 mm | 11.43 g | 3.41 g |
| 4 mm | 14.71 g | 3.81 g |
| 6 mm | 18.82 g | 4.53 g |
Table 3: Mass of the sliced sample before and after drying.
Apparent density:
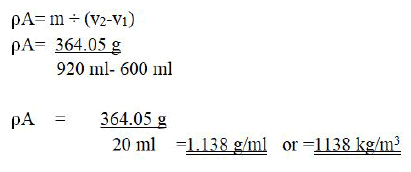
where V2 is volume of water and sweet potato
V1 is volume of water (600 ml)
Sphericity and aspect ratio: Sphericity and aspect ratio ranged from 0.59 to 0.67 and 0.5 to 0.6 respectively. Sphericity values of most agricultural produce have been reported to range between 0.32 and 1.00 and the more regular an object is, the lower the sphericity. Sphericity of sweet potatoes found in the given range and result shows, this commodity can be sorted with minimal damage, comfortable for hopping and conveying. This is important information for hopper, separation and conveying equipment design (Tables 4 and 5).
| No of fresh sample | Sphericity |
|---|---|
| Sample 1 | 0.64 |
| Sample 2 | 0.59 |
| Sample 3 | 0.67 |
Table 4: Sphericity of sample.
| No of fresh sample | Aspect Ratio (Ra) |
|---|---|
| Sample 1 | 0.53 |
| Sample 2 | 0.5 |
| Sample 3 | 0.6 |
Table 5: Aspect ratio value.
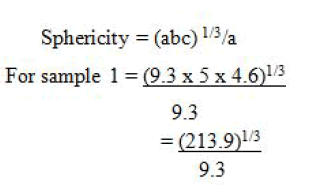
When a=length, b=width and c=thickness and 1/3 stands for only nominator
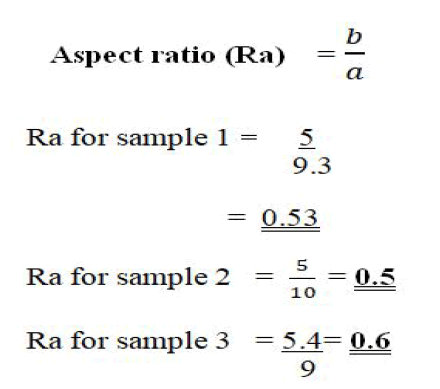
Where a and b are length and width respectively.
Bulk density: From the result on the table below it is possible to deduce that variation in temperature of each slices has a significant effect on their bulk density. The highest bulk density was recorded on 6 mm (80°C) slice while the lowest bulk density was recorded on 2 mm (60°C) slice. And this finding was in contrary to in which they investigated that the density at given moisture content decreased with increasing drying air temperature. But in our investigation since there was variation in moisture content of each slices it was difficult to detect pure effect of temperature on their bulk density (Table 6).
| Sample sliced | Bulk density (kg/m3) |
|---|---|
| 2 mm | 471 kg/m3 |
| 4 mm | 584 kg/m3 |
| 6 mm | 633 kg/m3 |
Table 6: Bulk density value.
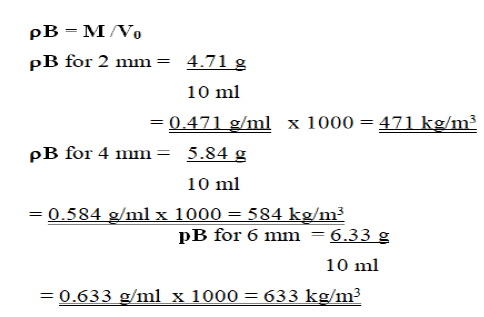
Where M is the mass of each powder sample
V0 is constant volume (10) ml
Total moisture content: The highest thickness and temperature has highest moisture contents. The sweet potatoes 2 mm thickness and dry at 60°C has lowest moisture contents and the thickness which 6 mm which dry at 80°C has highest moisture content than thickness 4 mm and 6 mm dry at 60°C and 70°C. When the temperature is raised, the drying time will be shortened, with a faster decrease of moisture content and the influence of temperature is more pronounced at higher moisture content. This situation occurred due to the moisture removal from the interior takes time since the evaporation process is not as easy as free water removal on the surface for the highest thickness and temperature. This might be because of low temperature which slowed the rate of moisture removal. Raising the drying temperature caused the acceleration of moisture loss and in this respect; the present observations are consistent (Table 7).
| Sample sliced | Moisture for sliced sample (%) | Moisture for powder sample (%) | Total moisture (%) |
|---|---|---|---|
| 2 mm | 70.2% | 9.33% | 79.53% |
| 4 mm | 73.9% | 8% | 81.9% |
| 6 mm | 75.9% | 7.33% | 82.33% |
Table 7: Total moisture content.
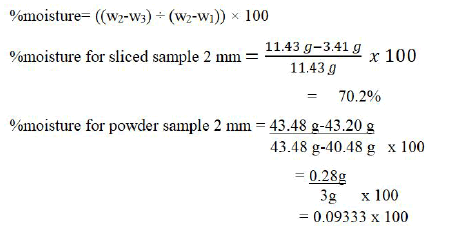
% moisture for 2 mm=9.333%
Where: W1=weight of moisture dish,
W2=initial weight of sample and moisture dish before drying.
W3=weight of moisture dish and sample after drying
Or %moisture=W1-W2/W1 × 100
Where w1=weight before drying
W1=weight after drying
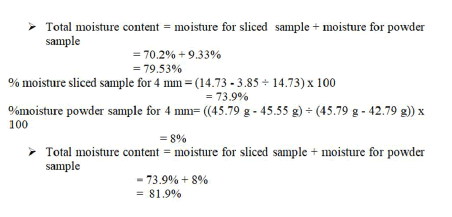
%moisture sliced sample for 6 mm=((18.82 g - 4.53 g) ÷ (18.82 g)) × 100
= 75.9%
%moisture powder sample for 6 mm=((24.66 g-24.44 g) ÷ (24.66 g - 21.66 g)) × 100
= 7.33%
Total moisture content=moisture for sliced sample+moisture for powder sample=75.9%+7.33%
=82.23%
Water activity: As it can be seen from the below table the water activity of the sweet potato were vary from the temperature to temperature. The water activity of sweet potato sliced by 2 cm and dried at 60°C was higher than the others. The water activity of sweet potato sliced by 6 cm and dried at 80°C was smaller than the others. The result showed that the temperature and water activity are in direct proportional to each other’s. This finding is also in line with who stated that the as the drying temperature increase the water activity of food decrease. The reason could be that as the temperature of air is increased, it can absorb more liquid and, therefore, the relative humidity is decreased. Lower relative humidity promotes faster drying. As temperature is increased, the amount of water required to saturate a specific volume of air increases and water activity decreased (Table 8).
| sliced and dried sweet potato | Water activity |
|---|---|
| 2 mm at 60°C | 0.44 |
| 4 mm at 70°C | 0.34 |
| 6 mm at 80°C | 0.26 |
Table 8: Water activity of sweet potato sliced and dried at different temperatures.
Weight loss of sweet potato dried at different temperatures:
The following three graphs shows moisture loss per time with every 10 minutes at (60, 70 and 80°C. As we can see from the below three (3) graphs of three sweet potato samples sliced at different thickness (2 mm, 4 mm, 6 mm) and dried at different drying temperature (60°C, 70°C, 80°C), the change of mass (moisture loss) is fast initially and becomes constant gradually. As it is seen from the result, drying rate is clearly influenced by the drying temperature. As temperature increases the drying rate became fast and it takes short period of time to dry the sweet potato. Therefore drying sweet potato at different temperatures and thickness has a great difference in the moisture loss and drying rate (Figures 1-3).
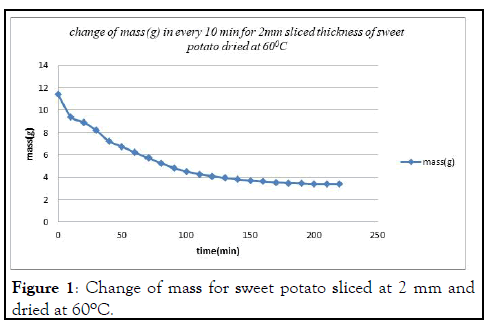
Figure 1: Change of mass for sweet potato sliced at 2 mm and dried at 60°C.
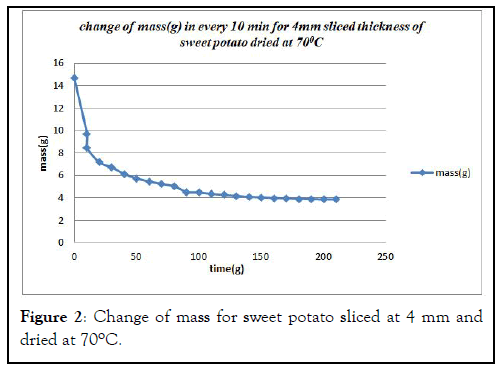
Figure 2: Change of mass for sweet potato sliced at 4 mm and dried at 70°C.
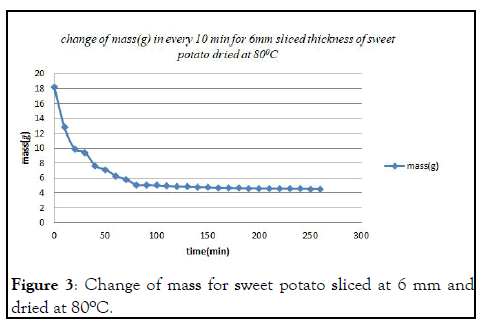
Figure 3: Change of mass for sweet potato sliced at 6 mm and dried at 80°C.
Sweet potatoes are perishable vegetables, which are rich in different nutrients like carbohydrates and proteins. Most of physico-chemical properties were affected by drying temperatures and thickness of the sample. Most of physico-chemical properties that were, affected by drying temperature like moisture contents highest thickness dried at highest temperature has high moisture contents. Drying sweet potato at different temperatures and by different thickness has a great difference in the moisture loss, the thickness which its 6 mm and dried at 80°C and which has 2 mm dried at 60°C their moisture contents were 82.33% and 79.53% respectively. Water activity which contribute microorganism growth also affected by thickness and drying temperature. The highest thickness dried at highest temperature has low water activity.
Citation: Techane T (2022) Effect of Thickness and Drying Temperature Physicochemical and Geometric Properties of Sweet Potatoes. J Nutr Food Sci. 12:872.
Received: 17-Apr-2022, Manuscript No. JNFS-22-16905; Editor assigned: 20-Apr-2022, Pre QC No. JNFS-22-16905(PQ); Reviewed: 04-May-2022, QC No. JNFS-22-16905; Revised: 20-Jun-2022, Manuscript No. JNFS-22-16905(R); Published: 27-Jun-2022 , DOI: DOI: 10.35248/2155-9600.22.12.872
Copyright: © 2022 Techane T. This is an open-access article distributed under the terms of the Creative Commons Attribution License, which permits unrestricted use, distribution, and reproduction in any medium, provided the original author and source are credited.