Fisheries and Aquaculture Journal
Open Access
ISSN: 2150-3508
ISSN: 2150-3508
Research Article - (2014) Volume 5, Issue 4
The present study aims to determining the isolated and combined effects of stocking and prey densities on growth and survival of Octopus maya hatchlings both at experimental level and in a pilot scale system (8 m2; 2700 L). Octopus survival was not related to prey density. Gained wet weight resulted in a significant interaction between initial stocking density and prey density indicating that octopus growth under low and high density was affected in a different manner depending on the density in which prey were offered. Prey density did not have a significant effect on growth and octopus fed with all three prey densities gained wet weight in a similar way. Results indicate the use of culture densities of 140 octopus m-2, and at least 0.27 g prey octopus-1 d-1 can be used to cultivate octopuses in small tanks. In tanks of 8m2 a higher growth rate was obtained with both 25 and 50 octopus m-2 densities were used. Survival was not affected by stocking density between 25 to 75 octopus m-2.
Keywords: Cephalopods; Cannibalism; Culture densities; Growth rate; Octopus maya; Prey densities
The Yucatan octopus, Octopus maya [1], is an endemic species from the Yucatan peninsula. Distribution ranges from Ciudad del Carmen, in the North of the Yucatan peninsula, to Isla Mujeres [2]. It has direct embryonic development with high hatchling survival [3], and easily adapts to laboratory conditions, accepting dead prey or prepared diets immediately after hatching [4,5]. O. maya has been cultured in the laboratory [6-9] up to four [7] or five [10] generations. The Yucatan octopus is characterized by fast growth rates (up to 8% body weight, [BW] d-1), high feeding rates and food conversions that vary between 30% and 60% [4,10]. This species grows to 1 kg in 4 months at 25ºC, attaining maximum weight (>3 Kg) at 9 months old [10].
The determination of optimum culture densities is a major aspect for the optimization of large scale culture of cephalopods [11,12]. There is information reported on density studies for several cephalopod species, but none for O. maya.
It is known that both juvenile and adult Sepia officinalis tolerate high stocking densities well [13,14], and juvenile O. vulgaris also tolerates high densities, with similar growth rates at lower and higher stocking densities, although a higher mortality was observed in groups maintained at high density [11]. Although density studies have been conducted for cephalopods, [12-15], the combined effects of culture and prey density have never been analyzed.
The effects of prey density on cephalopod growth and behaviour has been poorly studied and understood, especially when using hatchlings. To our knowledge, a pioneering investigation by Borer [16] was partly devoted to study the functional response of adult octopus (Octopus briareus), while Koueta & Boucaud-Camou [17] reported data on the relationship between the amounts of food offered and ingested in S. officinalis juveniles. Nevertheless, prey density is a key factor in optimizing growth and survival. In fact, an interval of prey densities for which density-dependent prey mortality is probable, was reported by Marquez et al. [18] when studying the functional response curve of S. officinalis hatchlings preying on live mysids. Rearing density studies for the cuttlefish were also reported by Correia, Domingues, Sykes & Andrade [19]. The effects of prey density were reported for O. vulgaris paralarvae [20] while growth and prey consumption by S. officinalis fed different densities of live mysid shrimp was reported by Sykes [14].
During the first 15 days after hatch, O. maya hatchlings pass through a transition process characterized by physiological and morphological changes associated with the maturity of the digestive gland, use of remaining yolk and changes in proportion of arms related with total length [21]. This period was also identified as a “no net growth” on squid [22]. For that reason the pilot scale culture of O. maya has been divided in two parts: pre-fattening and fattening, the first in hatchery/ nursery facilities and the second in outside ponds [23]. During the prefattening period octopuses are maintained in 8 m2 ponds for 60 days, where they are fed with crab paste and Artemia adults.
The present study was divided in three experiments in an attempt to
i) Determine the isolated and combined effects of stocking and prey densities on growth and survival of O. maya hatchlings (Experiments I and II), and
ii) To evaluate the effect of stocking densities on growth and survival of O. maya hatchlings maintained in a pilot scale system (Experiment III). All the animals used in the experiments were hatchlings of 2 days old.
The study was carried out in the Experimental Cephalopod Production Unit (EPHAPU) at the UMDI-UNAM, Sisal, Yucatan, Mexico, following the procedures of Rosas and Moguel [5,21] for collecting and maintenance of egg-laying females, as well as rearing, and maintenance, of Octopus maya embryos. The octopuses were obtained from spawning of females copulated in controlled conditions [23].
Experiments I and II were carried out in tanks with seawater maintained at 26 ± 2°C; pH between 8.0 and 8.2; dissolved O2>5.5 mg/L; and a natural photoperiod of 10-14 h light-darkness (300 ± 50 lux cm-2). Live shrimp (Palaemonetes sp.) was used as prey, which were collected in a daily bases in ponds around the research facilities (Sisal, Yucatan, Mexico). Individual shrimp wet weight varied between 0.1 and 1.3 g with a mean individual value of 0.60 ± 0.01 g (n = 500). Food was provided daily at 10:00 h and 14:00 h, and uneaten live shrimp and shrimp leftovers were removed and weighed every day prior to the first morning feed, in order to determine feeding rates. Thorough tank cleaning was performed on a daily basis.
Experiment I: Effect of initial stocking density and prey density on survival and growth
A two-way factorial design was used to test the effect of two octopus stocking densities (140 and 280 octopuses m-2, corresponding to 50 and 100 octopus aquaria-1, respectively) in combination with three prey densities (2, 4 and 6 prey octopus-1 d-1, corresponding to 0.09, 0.18 and 0.27 g prey octopus-1 d-1, and 71, 141 and 226% of initial body weight, respectively) on octopus survival, growth and feeding rate. Three replicate tanks (70.4 L; 76 cm x 47.5 cm x 19.5 cm) with re-circulating sea water were randomly allocated in each of the 6 treatment combinations. A total of 1350 hatchlings of O. maya (2 days old) were used in this experiment (Table 1). Each tank had empty shells of adults Melongena corona bispinosa (3 shells per octopus) to reduce stress by providing shelter for experimental animals to hide. A total of 7100 g of shrimp were used as live prey throughout the duration of the experiment (30 days).
| Experiment I | Prey density (g octopus-1 d-1) | |||
|---|---|---|---|---|
| 0.09 | 0.18 | 0.27 | ||
| Stocking density(number of hatchlings m-2) | 140 | 0.136 ± 0.012; n = 150 |
0.130 ± 0.010; n = 150 |
0.124 ± 0.018; n = 150 |
| 280 | 0.134 ± 0.051; n = 300 |
0.124 ± 0.021; n = 300 |
0.115 ± 0.015; n = 300 |
|
| Experiment II | 0.124 ± 0.004; n = 10 |
0.125 ± 0.010; n = 10 |
0.125 ± 0.006; n = 9 |
|
Table 1: Initial wet weight of Octopus maya hatchlings (2 days old) that were randomly allocated to different stocking and prey density treatments in experiments I and II. Values are mean ± standard deviation; n is the number of weighed individuals.
All animals were individually weighed using an Ohaus@ semi micro scale (± 0.001 g) at the beginning and at the end of the experiment. Individual mean wet weight gained was calculated by subtracting the mean final weight of the mean initial weight in each tank.
Specific growth rate (SGR, % day-1) was calculated as:
SGR, % day-1 = [(Ln Wf – Ln Wi)/T] x 100
Where Wf is the final weight (g), Wi is the initial weight (g), and T is time in days.
Survival in each tank was obtained as the difference between the number of octopus at the start and end of the experiment. Ingestion rate was calculated as a percentage of food provided (IRfpt) and as a percentage of final biomass production (IRtbp) obtained in each tank:
IRfpt = (Ingested food, g tank-1 d-1/Food provided, g tank-1 d-1) ×100
Using ingestion rate and biomass production per tank the food conversion index (FCIt) was calculated as:
FCIt, % = Total ingested food (g tank-1 30 d-1)/ Total octopus production (g tank-1 30 d-1) × 100
The tank gross growth efficiency (GGEt,%) was defined as the fraction or the percentage of food intake by animals in the tank for 30 d [24] that was converted into body mass in the tank (ΔBWt) during experimental time:
GGEt = ΔBWt/FIt
Survival, %IRfpt, FCI, %GGE and SGR (% day-1) were analysed by means of two-way ANOVAs with octopus stocking density and prey density as the two main (fixed) factors (n = 3 replicates). An arc-sin transformation of data was performed prior to statistical analysis [25]. Comparisons amongst means were carried out using the Student - Newman - Keuls procedure for balanced designs. Statistical differences were assumed when a P<0.05 was obtained [26]. Growth rates were finally expressed as specific growth rate (SGR % bw d-1) for 30 experimental days for comparative purposes. Statistical analysis was done using R software.
Experiment II: Effect of prey density on growth
A total of 30 hatchlings of O. maya (2 days old) were used in this experiment (Table 1). Animals were individually placed in 30 plastic 500 ml chambers (10 cm diameter) connected to re-circulating seawater. Each chamber had one empty shell of the mollusk M. corona bispinosa in order to provide shelter and reduce stress. Similar prey densities as for experiment I were tested (0.09, 0.18 and 0.27 g prey octopus-1 d-1), using n = 10 individual replicates in each treatment.
All animals were weighed at the beginning and at the end of the experiment, and individual wet weight gained was calculated. Specific growth rate (SGR, % day-1) was calculated as:
SGR, % day-1 = [(Ln Wf – Ln Wi)/T] × 100
where Wf is the final weight (g), Wi is the initial weight (g), and T is time in days.
Ingestion rates were calculated as percentage of food provided per animal (IRfpa):
IRfpa = (Ingested food, g animal-1 d-1/Food provided, g animal-1 d-1) x 100
Using ingestion rate and biomass production per tank the food conversion index (FCIi) was calculated as:
FCIi, % = Total ingested food (g animal-1 30 d-1)/ Total octopus growth (g animal-1 30 d-1) x 100
The individual gross growth efficiency (GGEi, %) is defined as the fraction or the percentage of individual food intake (FIi: g animal-1 d-1) that is converted into body mass and can be expressed as:
GGEi = ΔBWi/FIi
where ΔBWi is individual growth (g animal-1 d-1).
One-way ANOVAs [25] were performed to determine differences in gained weight and food ingestion rates. Mean values were then compared using Tukey´s HSD test for unequal samples. Individual growth rates were, here again, expressed as SGR (%bw d-1) for 30 experimental days. Statistical differences were assumed when a P<0.05 was obtained.
Experiment III: Effect of stocking densities on growth and survival of O. maya hatchlings maintained in a pilot scale system
A total of 4800 hatchlings of O. maya (2 days old) with similar initial weight as for experiment I (0.13 ± 0.01 g, n=500) were used in this experiment. Animals were randomly placed in ten 8 m2 black tanks (2,400 L; 2 × 4 × 0.3 m) under the following stocking densities: 3 tanks with 25, 50, and 75 octopuses m-2 each, and one tank with a density of 150 octopuses m-2. Each tank was connected to a re-circulatory sea-water system coupled to anthracite vertical filter and protein skimmer [23]. Each tank was provided with 3 M. corona bispinosa shell per animal. During the 30 days of the experiment, animals were fed ad libitum two times a day (09:00 and 18:00 h) with crab paste (95% liophylized crab meat plus 5% gelatin without flavor; [5], at ration of 150% of octopus wet weight. Also, Artemia adults (25 g wet weight per tank d-1) were provided during the first 15 days [21]. Artemia were collected in salty ponds from the Celestun coastal lagoon, Yucatán, México. Before feeding (08:00 h), tanks were cleaned and remaining food removed using a siphon. Seawater in the tanks was maintained at 26 ± 2°C, 8 ± 0.5 pH, dissolved O2>5.5 mg/L, nitrite<0.05 mg/L and ammonia<0.5 mg/L; A natural photoperiod of 10-14 h light-darkness, respectively was maintained during the experiment. At the end of the experiment, all animals were weighed and counted to calculate the final wet weight biomass and survival obtained in each experimental condition.
The relationship between biomass (g) of O. maya juveniles after 30 days of culture and initial density (number of octopuses m-2) was explored using additive modelling (GAM). This was done after data exploratory analysis revealed a non-linear relationship between response and explanatory variables. Biomass data was previously square root transformed to comply with the Gaussian family of distribution curves. Exploration analysis used point graphs to identify extreme data; histograms and percentile graphs to assess normality; and X-Y graphs to verify linear relationships. Since there were only 4 values for the covariate (25, 50, 75 and 150 octopuses m-2), the model with the maximum amount of smoothing used 3 degrees of freedom (d. f.), whereas, the model with the minimum amount of smoothing used d. f. = 2. The difference amongst these was assessed by means of AIC (Akaike Information Criteria = -2 log (Likelihood) +2df) and hypothesis testing using the F statistic. The model was validated by visual inspection of residuals [27].
Experiment I:
The effect of octopus and prey density on survival and growth
Although during experiment I casual cannibalism was observed (but not quantified), hatchling survival was not related to prey density (pP>0.05) or initial stocking density (P>0.05) either through main terms or the interaction term (P>0.05), and hatchlings from all treatment combinations had similar survival (Figure 1). The two way ANOVA on SGR resulted in a significant interaction between initial stocking density and prey density (p<0.05), indicating that octopus growth under low and high density was affected in a different manner depending on the density in which prey were offered (Figure 2).
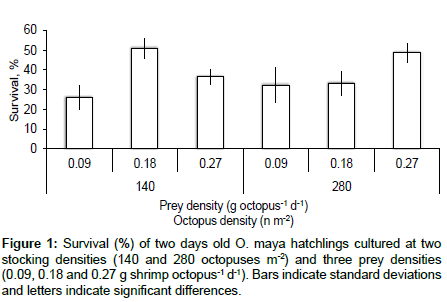
Figure 1: Survival (%) of two days old O. maya hatchlings cultured at two stocking densities (140 and 280 octopuses m-2) and three prey densities (0.09, 0.18 and 0.27 g shrimp octopus-1 d-1). Bars indicate standard deviations and letters indicate significant differences.
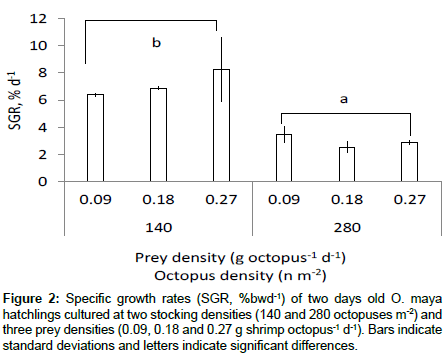
Figure 2: Specific growth rates (SGR, %bwd-1) of two days old O. maya hatchlings cultured at two stocking densities (140 and 280 octopuses m-2) and three prey densities (0.09, 0.18 and 0.27 g shrimp octopus-1 d-1). Bars indicate standard deviations and letters indicate significant differences.
Mean growth rates expressed as SGR (%bw d-1) for octopus in experiment I are shown in Table 2.
| Prey density (g octopus-1 day-1) | |||
|---|---|---|---|
| Stocking density | 0.09 | 0.18 | 0.27 |
| 140 | 6.39 ± 0.1 | 6.89 ± 0.1 | 8.26 ± 2.35 |
| 280 | 3.46 ± 0.58 | 2.54 ± 0.40 | 2.87 ± 0.17 |
Table 2: SGR (% bw d-1) of Octopus maya hatchlings (2 days old) after 30 days in experiment I using different stocking (number of hatchlings m-2) and prey density (number of prey octopus-1 d-1) treatments. Values are mean ± SD; n = 3 in all cases.
The two way ANOVA on ingestion rates showed that prey ( p<0.05) and initial stocking density (p<0.05) independently affected the IRfpt %, and no significant effect was found in the interaction (P>0.05) (Figure 3). Mean ingestion rate as percentage of food provided per tank (IRfpt) showed a negative relationship to prey density, with higher values as prey density decreased for both low and high initial stocking densities (Figure 3A). Ingestion rate expressed in this manner was also higher in treatments amongst all treatments with high than with low octopus density (Figure 3B).
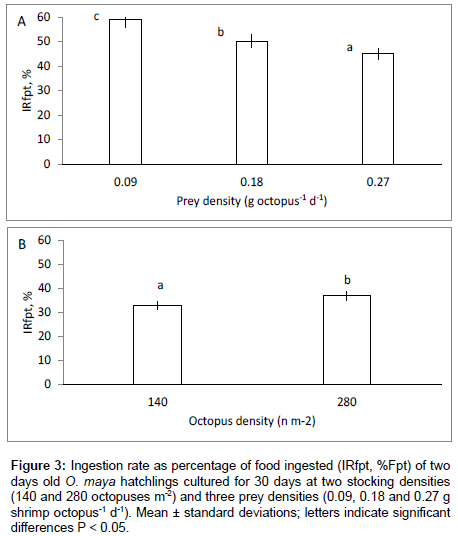
Figure 3: Ingestion rate as percentage of food ingested (IRfpt, %Fpt) of two days old O. maya hatchlings cultured for 30 days at two stocking densities (140 and 280 octopuses m-2) and three prey densities (0.09, 0.18 and 0.27 g shrimp octopus-1 d-1). Mean ± standard deviations; letters indicate significant differences P < 0.05.
Food conversion index (FCIt) varied with prey density, but did so in a different way depending on octopus initial density (p<0.01). Whilst FCIt in all treatments with low stocking density were statistically similar amongst each other, values increased with prey density amongst those treatments with high initial octopus density (Figure 4A). In contrast a reduction on GGEt, % was observed with octopus density, with high values on animals maintained at lower than higher densities (Figure 4B).
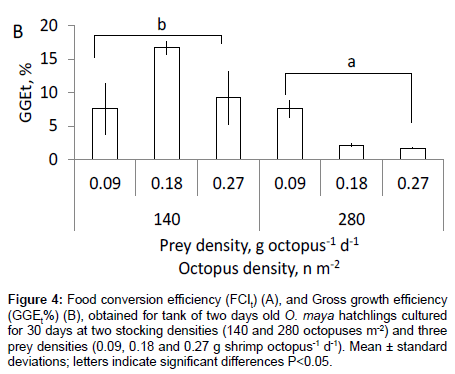
Figure 4: Food conversion efficiency (FCIt) (A), and Gross growth efficiency (GGEt%) (B), obtained for tank of two days old O. maya hatchlings cultured for 30 days at two stocking densities (140 and 280 octopuses m-2) and three prey densities (0.09, 0.18 and 0.27 g shrimp octopus-1 d-1). Mean ± standard deviations; letters indicate significant differences P<0.05.
Experiment II
The effect of prey density on growth of individualized O. maya hatchlings.
Prey density did not have a significant effect on growth (P>0.05), and octopus fed with all three prey densities gained wet weight in a similar way (Figure 5). Survival of individualized animals was 60, 80 and 67% for treatments with 0.09, 0.18 and 0.27 g prey octopus-1 d-1.
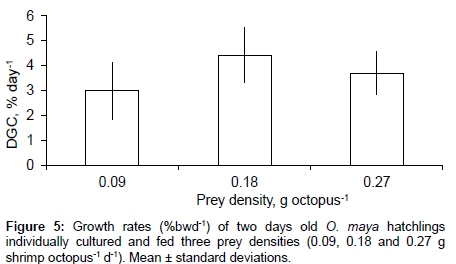
Figure 5: Growth rates (%bwd-1) of two days old O. maya hatchlings individually cultured and fed three prey densities (0.09, 0.18 and 0.27 g shrimp octopus-1 d-1). Mean ± standard deviations.
Ingestion rate as percentage of food provided per animal (IRfpa, %) showed a negative relation with prey density (p<0.001), with the highest ingestion rate at the lowest prey density (0.09 g prey octopus-1 d-1), but statistically similar values for 0.18 and 0.27 g prey octopus-1 d-1 (Figure 6). The Food Conversion Index (FCIt) and GGEt, % did not show changes according to prey density (p>0.05) with a mean value of 11.6 ± 8.25 and 11.9 ± 6.06 for animals fed three prey densities, respectively (Figure 7).
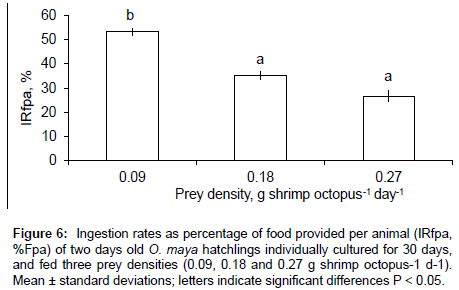
Figure 6: Ingestion rates as percentage of food provided per animal (IRfpa, %Fpa) of two days old O. maya hatchlings individually cultured for 30 days, and fed three prey densities (0.09, 0.18 and 0.27 g shrimp octopus-1 d-1). Mean ± standard deviations; letters indicate significant differences P < 0.05.
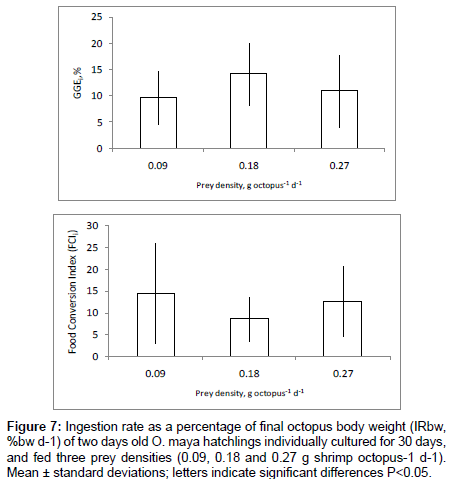
Figure 7: Ingestion rate as a percentage of final octopus body weight (IRbw, %bw d-1) of two days old O. maya hatchlings individually cultured for 30 days, and fed three prey densities (0.09, 0.18 and 0.27 g shrimp octopus-1 d-1). Mean ± standard deviations; letters indicate significant differences P<0.05.
Experiment III
Moderate cannibalism was observed during this experiment. Nevertheless, hatchling survival was similar amongst densities from 25 to 75 octopus’s m-2 (mean survival: 58 ± 2.93%). Contrary, survival decreased in octopus stocked at 125 hatchlings m-2 (31%; Table 3). Final octopus weight ranged between 0.41 and 0.58 g, with low values for animals stocked at 125 octopuses m-2 and high values for animals maintained at 25 octopuses m-2, however, the negative relationship between growth and stocking density was not linear. Density affected the SGR (% day-1) values with high values in animals maintained in low density in comparison to that obtained in the highest density (Table 3).
| Animals m-2 | |||||
|---|---|---|---|---|---|
| 25 | 50 | 75 | 150 | ||
| Initial wet weight,g | 0.13 ± 0.02 | 0.13 ± 0.02 | 0.13 ± 0.02 | 0.13 ± 0.02 | |
| Na | 500 | ||||
| Final weight,g | 0.58 ± 0.02 | 0.53 ± 0.19 | 0.4 ± 0.11 | 0.41 ± 0.18 | |
| Nb | 3 | 3 | 3 | 1 | |
| Nc | 150 | 150 | 150 | 150 | |
| Days | 30 | 30 | 30 | 30 | |
| SGR, % day-1 | ± | ± | ± | ± | |
| Survival, % | 61 ± 5 | 55 ± 7 | 58 ± 9 | 31 | |
a. Number of hatchlings weighed at the beginning of the experiment
b. Number of tanks of each experimental density
c. Number of octopuses weighed at the end of the experiment per treatment
Table 3: Effects of animal density on growth and survival of O. maya hatchings cultured during the first 30 days after hatch on 8m2 dark tanks. Values as mean ± SE ±.
The high variability on wet weight at the end of the experiment did not allow a conventional statistical analysis. For that reason, GAM was applied to analyze the effect of animal density on final wet weight obtained during the experiment (Figure 8). The model with d.f.=3 had a lower AIC value than that with d. f.=2 (-1549.0, -1538.8, respectively) and proved to explain significantly more variability in final biomass (p<0.001). The estimated variance in this model was σ2 = 0.01 (n = 854), and only a 25.5% of the total deviance was explained, nevertheless indicating large amount of unexplained variation in the data. The smoothing term was significant (p<0.001) indicating an important effect of density on final body octopus weight (Figure 8). The estimated intercept in the model was 0.69 ± 0.003 (± standard error.) and it was significantly different from 0 (p<0.001). Thus, octopuses at an initial density of 50 octopuses m-2 are predicted to weigh 0.42 g after 30 days of culture, whereas those at an initial density of 25 octopuses m-2 are predicted to weigh of 0.59 g in the same period of time (Table 4) [27].
| Density Animal m-2 | Smoother value | Predicted biomass (g) |
|---|---|---|
| 25 | 0.08 | 0.59 |
| 0.06 | 0.56 | |
| 0.04 | 0.53 | |
| 0.02 | 0.50 | |
| 0 | 0.48 | |
| -0.02 | 0.45 | |
| 50 | -0.04 | 0.42 |
| -0.06 | 0.40 | |
| -0-08 | 0.37 |
Table 4: Predicted biomass (g) of juvenile O. maya after 30 days of culture at different initial density (ind. /m2). Biomass values were estimated as: (smoother value + estimated intercept)2.
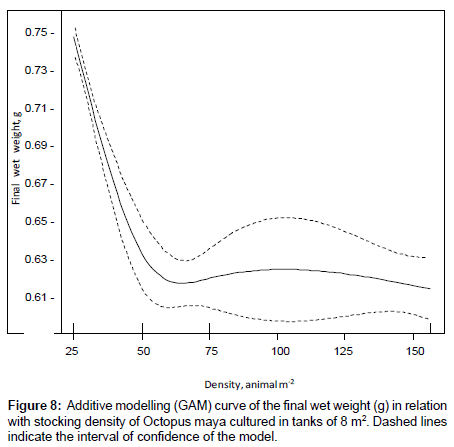
Figure 8: Additive modelling (GAM) curve of the final wet weight (g) in relation with stocking density of Octopus maya cultured in tanks of 8 m2. Dashed lines indicate the interval of confidence of the model.
Experiments I and II:
Results obtained in the present study showed that the relationship between mortality and growth rates had a different behavior depending on combinations between octopus and prey density; survival was not affected by prey or octopus density while a low growth was registered on animals maintained on high stocking density, independently of prey density.
Marquez et al. [18] suggests a type III functional response for cuttlefish hatchlings preying on live mysids, since a peak is reached and afterwards the increase in prey density did not lead to higher consumptions. This occurred in the present study when octopus density changed in animals cultivated in groups; animals maintained in low densities showed an increment on prey consumption, while animals cultured at high density showed an inverse reduction on prey consumption according with prey density increment. In individualized animals, ingestion rate increased constantly with prey density suggesting that, when octopuses had no school pressures, prey consumption increases in direct relation to prey density provoking higher growth rates.
During experiment I, casual cannibalism was observed although not quantified. Cannibalism has been reported for several cephalopod species such as O. vulgaris [28] and Loligo vulgaris [29]. The higher stocking densities increase the rates of encounters between hatchlings, which most likely increases cannibalism. In general, the behavior of the victim (as that of the aggressor) can be the reason for cannibalism and as behavior often is density-related, the rates of cannibalism are often related to the number of encounters [30]. Results from experiment I suggest that O. maya hatchlings do not support culture densities higher than 140 octopuses m-2, even when ideal live prey is provided. Not only cannibalism is likely enhanced, but growth was markedly reduced when animals were cultivated at 280 octopuses m-2, probably due to stress and competition for territory or food [31]. In fact, it was frequent to observe that in this high density, hatchlings chasing each other, or trying to steal a shrimp captured by other octopuses, which probably generated great stress and the loss of considerable amounts of energy. Boal et al. [32] studied the effects of crowding in S. officinalis with two different culture densities, and suggested that cuttlefish cultured at lower densities were less stressed, and because of this ate and grew more, while the ones cultured at higher densities showed signs of stress.
S. officinalis presents a much less cannibalistic behaviour, are very tolerant to high stocking densities [14,33], and most likely can be cultured at higher densities than O. maya during the first part of their life cycle. Although maximum densities of about 1000 cuttlefish m-2 for small juveniles (<3 cm mantle length, ML) were suggested by Forsythe et al. [34] it is necessary to consider differences between benthic and nektonic species; cuttlefish densities should consider the volume while octopus species should be considered in relation with the area of the benthic environment.
Results from the IRfpt% clearly indicate that hatchlings cultured at 140 octopuses m-2 were less stressed and fulfilled their nutritional requirements before and more efficiently than those cultured at 280 octopuses m-2. This is explained by the gradual decrease between all treatments in IRfpt% with increasing prey density. Contrary to results obtained in the present study, Forsythe et al. [34] reported that the effects of culture density in juvenile (<1.5 g) S. officinalis (100 and 400 cuttlefish m-2) had no statistical significance in food consumption or growth rates, but suggests that stocking densities of 400 cuttlefish m-2 may be approaching levels that affect feeding and growth. Warnke [35] reported that group reared cuttlefish ate more and grew larger (up to 9%) compared to others placed in isolation, while Dickel [36,37] indicated that S. officinalis reared in isolation, or in poor environments (e.g. simple tank with no substrate or hiding places) grew less than others placed in groups, or in enriched environments (e.g. tanks with shells, sand and shelters). Similarly, [38] indicated that S. officinalis can be cultured in isolation only for short-term experiments. The comparison between IR from experiments I and II in the present study does not support these findings, since octopuses placed in isolation ate more than those cultured in groups. Again, this could be due to the fact that O. maya is more territorial than S. officinalis, and therefore isolation provides less stress and the absence of competition for food or territory. Domingues et al. [39] also observed that isolated cuttlefish inked more and appeared to be more stressed than group cultured ones, although this was not reflected in growth or survival.
Experiment III:
Results obtained in small tanks suggest that for O. maya culture densities lower than 140 octopuses m-2 must be used during first 30 days. For that reason experiment III tested densities between 25 to 75 octopus m-2. According to the GAM model used, a density between 25 to 50 octopuses m-2 is adequate to culture O. maya hatchlings on 8 m2 tanks, since with such densities the higher final weight and survival were obtained. Between 25 and 75 octopus m-2, survival was not affected, suggesting that in this stock density range cannibalism should not be an important factor. As During this part of the study hatchlings were fed crab paste and Artemia adults during first 15 days followed by other 15 days with only crab paste and using a ratio of 150% of octopus wet weight [5]. Apparently, those rations and diets covered the nutritional requirements of hatchlings cultured between 25 to 75 octopus m-2, and can be recommended as culture conditions for O. maya juveniles in experimental pilot scale. Lower growth at higher densities was reported for the cuttlefish, Sepia officinalis [14], while Otero reported differences in food conversion and growth for juveniles of Octopus vulgaris stocked at 10 and 20 Kgm-3, but reaching final culture densities up to 45.5 Kg m-3, in a small experiment, at temperatures varying between 13 and 16ºC. Domingues et al. [12] also reports different food conversions for juvenile octopus, but reported no differences in growth rates with initial densities between 4 and 16 animals m-2. These authors suggest that initial density should not be higher than 10 Kg m-3 for O. vulgaris juveniles.
The statistical model used here also showed the necessity to evaluate octopus growth rate in a different form, because in it was included variability. Variability of growth rates on cephalopods has been widely recognized and, as in the present study, must be considered in all studies where octopus culture needs to be applied [40-45]. Variability is the key of aquaculture, because through variability it is possible design process to enhance survival, reducing at the same time, heterogeneity of cultured population. Considering this, O. maya juveniles production has incorporated the variability evaluation every 30 days of culture to separate animals with different sizes, delivering higher survival and growth rates at pilot scale culture conditions.
The present study was partially financed by CONACYT through the project CB-2010-01 150810. Also thanks are given to DGAPA-UNAM Papitt program for financial support to CR on the project IN 212012. Thanks to SCPP Moluscos del Mayab for maintenance the octopuses on experimental pilot scale system.