Journal of Nutrition & Food Sciences
Open Access
ISSN: 2155-9600
ISSN: 2155-9600
Research Article - (2022)Volume 12, Issue 5
Background: The nutritional status affects gene expression in peripheral T lymphocytes; nevertheless, the link between nutritional status and immunity of cancer patients is unclear. The aim of the research was to evaluate the connection with nutritional parameters and the frequencies of T cells subsets on peripheral blood in non-small cell lung cancer (NSCLC) patients.
Methods: We enrolled 170 NSCLC patients and 53 healthy volunteers who were age and gender matched. The frequencies of circulating CD3+, CD4+, CD8+, naïve CD4+, memory CD4+, naïve CD8+, memory CD8+, and regulatory T lymphocytes were assessed by the way of flow cytometry. Nutritional parameters including albumin, globulin, albumin to globulin ratio (AGR), total protein (TP), pre-albumin (PA), body mass index (BMI), and prognostic nutritional index (PNI), were also evaluated.
Results: Low globulin levels and high AGR were associated with high frequencies of naïve CD8+ T lymphocytes (P=0.039 and P=0.018). Obese (BMI ≥ 25) Compare with the non-obese (BMI<25) patients, the percentages of CD8+ T lymphocytes in NSCLC patients had decreased (P=0.026). Between in other nutritional parameters and the frequency of circulating lymphocyte subsets had no significant correlation.
Conclusion: Our findings show that nutritional status should influence the frequencies of peripheral T cell subsets in NSCLC patients.
Nutrition; Globulin; Albumin; BMI; T lymphocytes; Non-small cell lung cancer
It is well known that lung cancer is one of the most universal malignant cancers, posing significant physical and mental health challenges. In urban China, Lung cancer has the highest mortality rate of all cancers, and the incidence rate of lung cancer is increasing year by year. Common species of lung cancer include non-small cell lung cancer (NSCLC) [1]. Due to the lack of valid screening programs, most patients are diagnosed with lung cancers in the late; contributing to patients with lung cancer 5 year survival is low. The recent implementation of immunotherapies has transformed the landscape of NSCLC treatment [2]. Immune checkpoint molecules promote immune homeostasis by delivering inhibitory signals to T cells. T lymphocytes and CD8+ T cells, especially, are key players in antitumor immune responses; T cell dysfunction is closely related to the development and progression of cancer [3-5]. Mounting evidence suggests that decreased many CD4+ and CD8+ T lymphocytes in tumor microenvironment independently predict poor prognosis in NSCLC [6-8].
Nutrition is closely linked to immunity by modulating immunometabolism in T lymphocytes. Albumin has been proved to promote T lymphocytes activation by promoting MHCII expression in mouse cells [9]. On the other hand, globulin has been shown to restrain the function of natural killer (NK) cells and hamper antibody dependent cell-mediated cytotoxicity (ADCC) [10]. Consistently, obesity and malnutrition influence T lymphocytes metabolism [11]. Notably, in obese people, the number of CD4+ and CD8+ T cells has decreased [12]. Severe malnutrition and starvation have also been demonstrated to suppress the production of cytokines (e.g., IL-2, IFNγ, IL-4, and IL-10) in CD4+ and CD8+ T cells [13,14].
However, the effects of nutritional indicators on T cells in cancer patients remain elusive. In our research, we found the connection with nutritional parameters, including total protein (TP), prealbumin (PA), albumin, globulin, albumin/globulin ratio (AGR), prognostic nutritional index (PNI), and body mass index (BMI) and T lymphocyte subsets in the peripheral blood of NSCLC people.
Clinical data
In our research, we reviewed the clinical data of 170 patients with non-small cell lung cancer who received treatment in our hospital from February 2014 to February 2021. NSCLC was pathologically confirmed in all patients, and complete nutritional parameters were available for all study subjects. Patients with concurrent malignancies or underlying diseases (e.g., hematological and metabolic diseases) were excluded. Additionally, pre-treatment blood samples were not taken into account in our analyses. For comparison, we also enrolled 53 healthy individuals with matched clinicopathological characteristics as a control group. Informed consent was provided by all study subjects.
Experimental parameters
We collected peripheral blood samples from patients within one week of treatment initiation and from control subjects. The proportions of different lymphocyte subsets were analyzed by flow cytometry. The lymphocyte subsets result is as follows: CD3+ T cells, CD4+ T cells (CD3+CD4+CD8-), naïve CD4+ T cells (CD4+CD45RA+CCR7+), memory CD4+ T cells (CD4+CD45RA-CD45RO+), CD8+ T cells (CD3+CD8+CD4-), naïve CD8+ T cells (CD8+CD45RA+CCR7+), memory CD8+ T cells (CD8+CD45RA-CD45RO+), and regulatory T cells (CD4+CD25+CD127low). Clinical laboratory evaluation of nutritional parameters was conducted. Specifically, we analyzed the levels of TP (cut-off value, 65 g/L), PA (cut-off value, 200 mg/L), albumin (cut-off value, 40 g/L), globulin (cut-off value, 30 g/L); AGR (cut-off value, 1.5), BMI, and PNI were also assessed. BMI was evaluated as weight/height2 (kg/m2); BMI<25 was considered low, and BMI ≥ 25 was considered high. According to serum albumin levels and lymphocyte count, PNI assessment was calculated as serum albumin (g/L)+(5×total number of peripheral blood lymphocytes) (×109/L).
Data analysis
The percentages of CD3+, CD4+, naïve CD4+, memory CD4+, CD8+, naïve CD8+, memory CD8+, and regulatory T cells, as well as the CD4/CD8 ratio are analyzed by Student’s t-test. We separate a higher group from NSCLC patients according to the median value of each nutritional parameter. We analyze Data by the way of SPSS 23.0 software. P<0.05 means statistically significant.
Clinicopathological characteristics
Table 1 summarizes the clinicopathological features of 170 NSCLC patients. The average age of all patients was 61 years (range, 36-91 years). The patient cohort consisted of 78 squamous cell carcinoma patients, 78 adenocarcinoma patients, and 14 patients with other pathological types. Tumor stage was evaluated based on the AJCC-8 criteria. Eleven patients had stage I tumors, 16 patients had tumor in stage IIs, 50 patients had tumors in stage III and 93 patients had tumors in stage IV.
Table 1: Clinicopathological characteristics of the 170 NSCLC patients.
| Parameter | Number of patients (%) |
|---|---|
| Age | 63.0 ± 10.4 |
| Sex | |
| Male | 120 (70.6) |
| Female | 50 (29.4) |
| Smoking | |
| Never | 61 (35.9) |
| Previous | 8 (4.7) |
| Present | 101 (59.4) |
| Pathology | |
| SCC | 78 (45.9) |
| ADC | 78 (45.9) |
| Other | 14 (8.2) |
| Differentiation | |
| Well | 6 (3.5) |
| Moderate | 78 (45.9) |
| Poor | 42 (24.7) |
| Unknown | 44 (25.9) |
| Gene mutation | |
| Yes | 23 (13.5) |
| No/Unknown | 147 (86.5) |
| AJCC stage | |
| Ⅰ | 11 (6.5) |
| Ⅱ | 16 (9.4) |
| Ⅲ | 50 (29.4) |
| Ⅳ | 93 (54.7) |
| ECOG PS | |
| 0 | 52 (30.6) |
| 1 | 111 (65.3) |
| 2 | 7 (4.1) |
Immunological and nutritional parameters of NSCLC patients
The immunological and nutritional parameters of the 170 NSCLC patients are shown in Table 2. The mean proportions of CD3+, CD4+, naïve CD4+, memory CD4+, CD8+, naïve CD8+, memory CD8+, and regulatory T cells were 70.50 ± 11.03, 38.03 ± 10.11, 30.65 ± 9.47, 17.35 ± 11.17, 70.83 ± 13.48, 40.82 ± 15.90, 38.19 ± 14.73, and 3.08 ± 1.22, respectively. The CD4/CD8 ratio was 1.42 ± 0.75. The mean levels of BMI, albumin, globulin, TP, and PA were 24.2 ± 4.1 kg/m2, 40.1 ± 4.8 g/L, 30.4 ± 4.6 g/L, 70.5 ± 6.2 g/L, and 243.1 ± 57.6 mg/L, respectively. PNI was 46.7 ± 6.7, and AGR was 1.4 ± 0.3.
Table 2: Levels of immune parameters and nutritional parameters in NSCLC patients.
| Immune parameters | Nutritional parameters | ||
|---|---|---|---|
| CD3+ T cells | 70.50 ± 11.03 | Albumin g/L | 40.1 ± 4.8 |
| CD4+ T cells | 38.03 ± 10.11 | Globulin g/L | 30.4 ± 4.6 |
| CD8+ T cells | 30.65 ± 9.47 | AGR | 1.4 ± 0.3 |
| CD4/CD8 radio | 1.42 ± 0.75 | TP g/L | 70.5 ± 6.2 |
| Regulatory T cells | 3.08 ± 1.22 | PA mg/L | 243.1 ± 57.6 |
| Naïve CD4+ T cells | 17.35 ± 11.17 | BMI kg/m² | 24.2 ± 4.1 |
| Memory CD4+ T cells | 70.83 ± 13.48 | PNI | 46.7 ± 6.7 |
| Naïve CD8+ T cells | 40.82 ± 15.90 | - | |
| Memory CD8+ T cells | 38.19 ± 14.73 | ||
Association between the proportions of T lymphocyte subsets and nutritional parameters
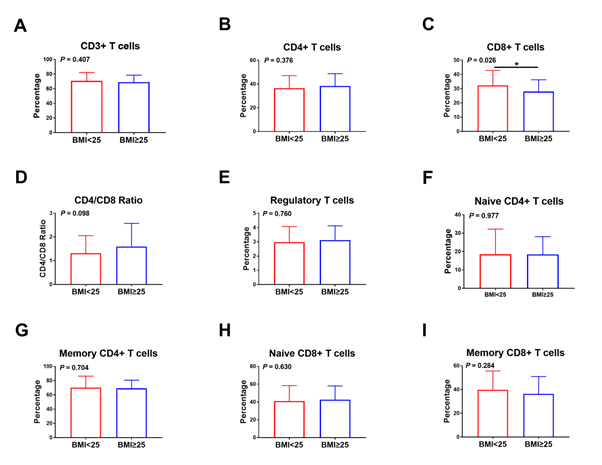
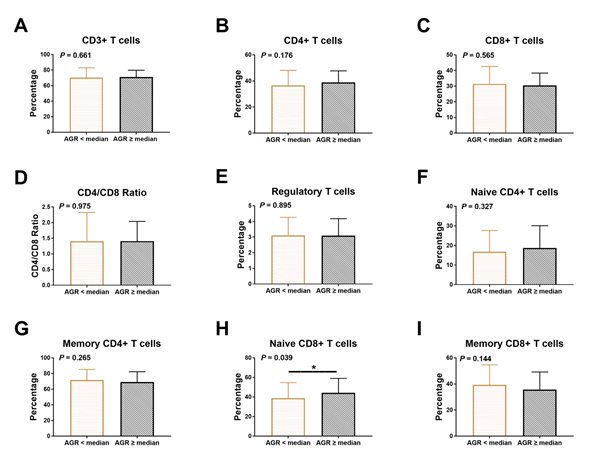
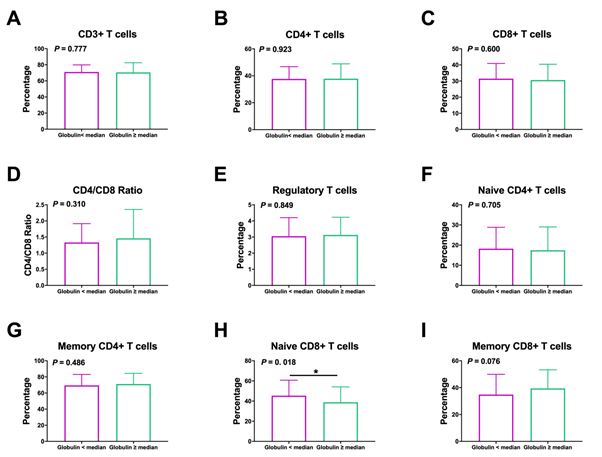
Interestingly, the percentage of CD8+ T cells in non-small cell lung cancer obese (BMI ≥ 25) patients is significantly lower than that of non-obese (BMI<25) patients (P=0.026); (Figure 1). Conversely, the CD3+, naïve CD4+, memory CD4+, and memory CD8+ cells parameters of obese patients were lower than that of non-obese patients, even though There is no significant statistical difference between these data (P>0.05). Decreased AGR was associated with low percentages of naïve CD8+ T lymphocyte (P=0.018), (Figure 2). The proportion of naïve CD8+ T cell levels in patients had obviously higher than patients with high globulin levels (P=0.039), (Figure 3). The part of CD3+, CD4+, naïve CD4+, memory CD4+, CD8+, and regulatory T lymphocyte were similar in NSCLC patients with high and low globulin levels (P>0.05). PNI, TP, albumin, and PA content were not obviously connected with T cell levels (Table 3).

Figure 1: Correlation between the frequency of T lymphocyte subsets and BMI in NSCLC patients. Relationship between BMI and (A) CD3+ T cells, (B) CD4+ T cells, (C) CD8+ T cells, (D) CD4/CD8 ratio, (E) regulatory T cells, (F) naïve CD4+ T cells, (G) memory CD4+ T cells, (H) naïve CD8+ T cells, and (I) memory CD8+ T cells.

Figure 2: Association between the frequency of T lymphocyte subsets and AGR in NSCLC patients. Relationship between AGR and (A) CD3+ T cells, (B) CD4+ T cells, (C) CD8+ T cells, (D) CD4/CD8 ratio, (E) regulatory T cells, (F) naïve CD4+ T cells, (G) memory CD4+ T cells, (H) naïve CD8+ T cells, (I) memory CD8+ T cells.

Figure 3: Association between the frequency of T lymphocyte subsets and levels of globulin in NSCLC patients. Relationship between globulin and (A) CD3+ T cells, (B) CD4+ T cells, (C) CD8+ T cells, (D) CD4/CD8 ratio, (E) regulatory T cells, (F) naïve CD4+ T cells, (G) memory CD4+ T cells, (H) naïve CD8+ T cells, (I) memory CD8+ T cells.
Table 3: Association between T lymphocyte subsets and TP, Albumin, PA, PNI nutritional parameters in NSCLC patients.
| - | CD3 | CD4 | CD8 | CD4/CD8 | Treg | Naïve CD4 | Memory CD4 | Naïve CD8 | Memory CD8 | |||||||||
|---|---|---|---|---|---|---|---|---|---|---|---|---|---|---|---|---|---|---|
| Mean ± SD | P | Mean ± SD | P | Mean ± SD | P | Mean ± SD | P | Mean ± SD | P | Mean ± SD | P | Mean ± SD | P | Mean ± SD | P | Mean ± SD | P | |
| TP | 0.969 | 0.583 | 0.395 | 0.4 | 0.866 | 0.318 | 0.3 | 0.087 | 0.146 | |||||||||
| <median | 70.80 ± 11.58 | 37.22 ± 11.09 | 31.74 ± 10.49 | 1.34 ± 0.71 | 3.09 ± 1.25 | 18.86 ± 11.30 | 69.04 ± 14.13 | 44.15 ± 15.23 | 35.42 ± 14.68 | |||||||||
| ≥ median | 70.73 ± 10.12 | 38.19 ± 9.61 | 30.34 ± 8.85 | 1.46 ± 0.84 | 3.06 ± 1.06 | 16.88 ± 11.01 | 71.50 ± 12.74 | 39.45 ± 15.61 | 39.17 ± 14.26 | |||||||||
| Albumin | 0.976 | 0.198 | 0.212 | 0.246 | 0.166 | 0.67 | 0.562 | 0.998 | 0.766 | |||||||||
| <median | 70.73 ± 13.02 | 36.52 ± 12.53 | 32.05 ± 10.77 | 1.32 ± 0.77 | 2.93 ± 1.15 | 17.32 ± 11.34 | 71.12 ± 14.29 | 41.57 ± 16.98 | 37.89 ± 16.23 | |||||||||
| ≥ median | 70.79 ± 8.37 | 38.85 ± 7.69 | 30.01 ± 8.41 | 1.48 ± 0.79 | 3.21 ± 1.13 | 18.16 ± 11.03 | 69.74 ± 12.59 | 41.56 ± 14.29 | 37.12 ± 12.89 | |||||||||
| PA | 0.285 | 0.987 | 0.431 | 0.572 | 0.411 | 0.821 | 0.856 | 0.655 | 0.532 | |||||||||
| <median | 71.13 ± 9.77 | 37.79 ± 10.72 | 30.80 ± 9.32 | 1.42 ± 0.80 | 3.15 ± 1.14 | 19.11 ± 11.30 | 68.88 ± 13.42 | 42.46 ± 15.23 | 36.16 ± 14.27 | |||||||||
| ≥ median | 68.83 ± 10.49 | 37.76 ± 9.34 | 29.25 ± 9.22 | 1.52 ± 0.92 | 2.94 ± 1.20 | 19.68 ± 11.48 | 68.34 ± 13.58 | 40.89 ± 16.59 | 38.12 ± 14.21 | |||||||||
| PNI | 0.533 | 0.644 | 0.492 | 0.839 | 0.756 | 0.451 | 0.493 | 0.689 | 0.977 | |||||||||
| <median | 71.37 ± 12.61 | 37.93 ± 12.15 | 31.82 ± 10.26 | 1.37 ± 0.76 | 3.08 ± 1.22 | 16.96 ± 10.98 | 71.27 ± 13.74 | 42.14 ± 16.86 | 37.54 ± 15.65 | |||||||||
| ≥ median | 70.20 ± 8.36 | 37.12 ± 7.57 | 30.67 ± 9.08 | 1.40 ± 0.78 | 3.02 ± 1.04 | 18.47 ± 11.20 | 69.62 ± 12.87 | 41.00 ± 14.58 | 37.62 ± 13.75 | |||||||||
Comparison of immune parameters between NSCLC patients and control subjects
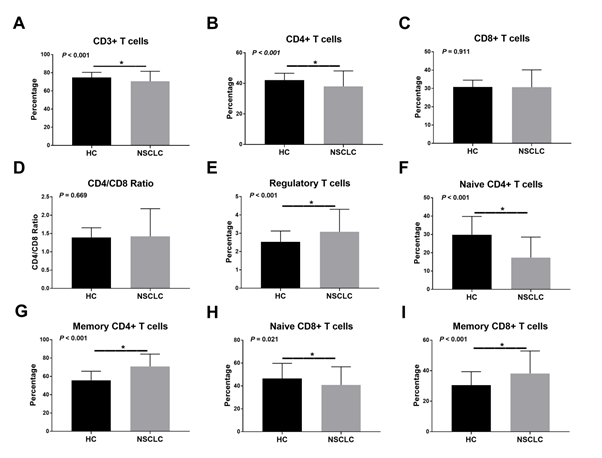
The occupied part of CD3+ (P<0.001), CD4+ (P<0.001), naïve CD4+ (P<0.001), and naïve CD8+ (P=0.021) T lymphocytes were significantly lower in NSCLC patients than in non-NSCLC patients (Figure 4). In contrast, the occupied part of memory CD4+ (P<0.001), memory CD8+ (P<0.001), and regulatory (P<0.001) T lymphocyte were obviously higher in NSCLC patients than in control subjects. There was no significant difference in the CD4/ CD8 ratio and CD8+ T lymphocyte occupancy rate between the two groups.

Figure 4: The proportions of T lymphocyte subsets in the peripheral blood of NSCLC patients and healthy controls. Abbreviations: NSCLC, non-small cell lung cancer; HC, healthy controls.
In our research, we explored the relationship between lymphocyte subpopulations (CD3+, CD4+, CD8+, naïve CD4+, memory CD4+, naïve CD8+, memory CD8+, regulatory T lymphocyte and CD4/ CD8 ratio) and nutritional parameters (albumin, globulin, AGR, TP, PA, PNI, and BMI) in NSCLC patients. We explored that the percentage of naïve CD8+ T lymphocyte was obviously elevated in NSCLC patients with low globulin levels and a high AGR. Notably, the occupied part of CD8+ T lymphocyte were lower in obese (BMI ≥ 25) NSCLC patients than in non-obese (BMI<25) patients. As far as we know, this study explored the association between the levels of lymphocyte subpopulations and nutritional parameters for the first time in NSCLC patients.
Albumin and globulin are abundantly found in the plasma. Liver produces Albumin and maintains the plasma colloidal osmotic pressure. Globulin, on the other hand, is mainly produced by immune cells and is involved in immune responses. The prognostic value of albumin and globulin levels has been extensively studied in many cancers. In lung cancer, high albumin and low globulin levels have been associated with improved survival outcomes and favorable prognosis [15-17]. Additionally, low AGR has emerged as a promising prognostic reason for different kinds cancer [18,19]. Although serum protein levels have been connected with the survival of tumor patients, the mechanisms linking the nutritional status to immune environment activity are still not clear. We found that high globulin levels and low AGR were correlated with low proportions of naïve CD8+ T cell levels. Elevated levels of C-reactive protein, complement C3, and fibrinogen indicates chronic inflammation [20,21]. Chronic inflammation is essential for tumor metastasis and immune escape [22]. Therefore, chronic inflammation may represent the link between high globulin levels and poor prognosis. Furthermore, persistent production of low levels of proinflammatory factors in chronic inflammation can lead to thymic atrophy, leading to a reduction in several of circulating naïve CD8+ T lymphocyte [23].
Obesity is a form of malnutrition with a rapidly increasing incidence worldwide. The prevalence of overweight and obesity in most developed countries and many underdeveloped countries has increased significantly over the past 20 years. In the United States, more than one-third of the population is overweight or obese [24]. Obesity has been recognized as a risk factor for morbidity and mortality in various types of cancers, including breast, colon, kidney, and pancreatic cancer [25,26]. Decreased glucose uptake and metabolism associated with obesity ultimately leads to hyperglycemia and enhances insulin secretion. In turn, chronic hyperinsulinemia increases the possibility of cancer, such as kidney, endometrial cancers. A study of 166,966 patients with the 22 most common types of cancers (but not lung cancer) showed that NK cells, CD4+ T cells, and CD8+ T cells decreased in obese patients. Consistently, antitumor immune responses were impaired in obese patients [12]. Previous epidemiological studies have reported that a high BMI was connection with a reduction in the whole risk of NSCLC [27-29]. In this study, we found that obese NSCLC patients had a lower occupied part of CD8+ T cells. Similarly, Alam et al. shows that the number of CD8+ T lymphocyte in the peripheral blood of obese individuals was obviously lower than that in lean individuals [30]. Another study has reported reduced level of NK cells and CD8+ T cells in obese subjects. In addition, metabolically obese and healthy people were studied to have obviously higher numbers of NK cells and CD8+ T cells than unhealthy obese people [31]. These studies involved healthy individuals or patients with cancer types other than NSCLC. Moreover, the results of BMI on CD8+ T cells in NSCLC patients still unclear. The mechanisms underlying the decreased CD8+ T cell numbers in obese patients also require further investigation. It is possible that CD95 (Fas) is secreted at higher levels in CD8+ T cells of obese individuals; the high CD95 expression levels may induce apoptosis in lymphocyte subsets, including CD8+ T lymphocyte [32].
The comparison of healthy individuals, NSCLC had increased frequencies of CD3+, CD4+, naïve CD4+, memory CD4+, naïve CD8+, memory CD8+, and regulatory T lymphocyte. Nevertheless, the proportions of CD8+ T lymphocyte in individuals with NSCLC were not obviously different compared with those in the control group, consistent with previous studies [6,33].
Our research is limited by numerous factors. First of all, this was a pilot research, and the study cohort included patients with different histological types of squamous cell tumor and adenocarcinoma. In addition, the mechanisms underlying the associations between globulin, AGR, BMI, and CD8+ T lymphocyte have not been investigated in this study.
In summary, we demonstrated that globulin levels were negatively correlated with the rate of naïve CD8+ T cell levels in individuals with NSCLC, whereas AGR was absolutely related to the proportion of naïve CD8+ T lymphocyte. Furthermore, we identified a negatively correlation between BMI and the frequency of CD8+ T lymphocyte. Consequently, nutritional parameters may indicate the immune status in NSCLC patients. Future research needs to clarify the underlying mechanisms behind these associations.
The data used to support the findings of this study are available from the corresponding author upon request.
The studies involving human participants were reviewed and approved by the institutional ethics committee of Anhui Chest Hospital and the Fifth Medical Center of Chinese PLA General Hospital. Written informed consent for participation was not required for this study in accordance with the national legislation and the institutional requirements.
All authors made a significant contribution to the work reported, whether that is in the conception, study design, execution, acquisition of data, analysis and interpretation, or in all these areas; took part in drafting, revising or critically reviewing the article; gave final approval of the version to be published; have agreed on the journal to which the article has been submitted; and agree to be accountable for all aspects of the work.
There is no funding source for this study.
Written informed consent was obtained from the patient for publication of this study and any accompanying images.
The authors report no conflicts of interest in this work.
[PubMed] [Google Scholar]
Citation: He F, Yang D, Zha X, Wang P, Xuan L (2022) Effects of Nutritional Status on Peripheral Immune Cells in Patients with Non-small Cell Lung Cancer. J Nutr Food Sci. 12:856.
Received: 10-May-2022, Manuscript No. jnfs-22-17410; Editor assigned: 12-May-2022, Pre QC No. jnfs-22-17410 (PQ); Reviewed: 26-May-2022, QC No. jnfs-22-17410; Revised: 31-May-2022, Manuscript No. jnfs-22-17410 (R); Published: 07-Jun-2022 , DOI: 10.35248/2155-9600.22.12.1000856
Copyright: © 2022 He F, et al. This is an open-access article distributed under the terms of the Creative Commons Attribution License, which permits unrestricted use, distribution, and reproduction in any medium, provided the original author and source are credited.