Journal of Aeronautics & Aerospace Engineering
Open Access
ISSN: 2168-9792
ISSN: 2168-9792
Research Article - (2013) Volume 2, Issue 5
In this paper an analytical model is used for the development of the controls for the optimal longitudinal performances of two small UAV aircraft which differ exclusively on the wing: an optimum Fixed Wing (FWA) and a telescopic and camber varying Morphing Wing (MWA). The aerodynamic data of the two wings is based on previous coupled FEM-CFD work. Both static and dynamic formulations for the longitudinal control are presented and applied to the two aircrafts. The static results show that the MWA has an extended operational range when compared to the FWA with the exception of the rate of climb which is slightly penalized. The dynamic results include the analysis of 128 different missions which include climb-cruise missions and descent missions. The dynamic formulation shows very satisfactory results in optimal control calculation for trajectory tracking. Energy actuation estimates based on the optimal control obtained for the missions are calculated and total mission energy consumption estimates comparisons are presented. The actuation energy estimates show that actuation energy is two orders of magnitude inferior to the engine output.
<Keywords: Blended wing body; Dolphin shaped; Conceptual design; Aerodynamic efficiency
i=Number of aircraft part,
j=Number of aircraft control,
m=Constant index representing a time span increase tm=t0+mΔt,
n=Variable Index representing a general time tn=t0+nΔt.
a1...a5=Objective function’s terms weighing factors
A=System matrix
B=Input matrix
C=Gradient matrix of input vector u relative to the state vector X at the initial time
ci=Aircraft part i reference chord length (m)
CDi =Drag coefficients of aircraft part i
CLi =Lift coefficients of aircraft part i
CMyi=Pitching moment coefficient of aircraft part i
D=Gradient matrix of input vector u relative to the control vector δ at the initial time
 =Drag force vectors of aircraft part i
Di=Drag of aircraft part i
ex,ez,eθ=Trajectory tracking estimated errors (m)
Iyyi=Moment of inertia of aircraft part i (Kg/m2)
k=Number of time spans used for future aircraft position prediction used in the constraints
 =Lift force vectors of aircraft part i
Li=Lift of aircraft part i
 =Aerodynamic Center (AC) position vector of aircraft part i relative to aircraft Center of Gravity (CG) position
li=Absolute value of the AC position vector of aircraft part i relative to aircraft CG position
mi=Mass of aircraft part i (kg)
Myi=Pitching moment of aircraft part i
Pi=Maximum power of part i (W)
 =CG position vector of aircraft part i relative to aircraft CG position
ri=Absolute value of CG position vector of aircraft part i relative to aircraft CG position
Si=Aircraft part i reference surface area (m2)
t=Time (s)
 =Thrust force vector of aircraft part i
Txi,Tzi=Thrust force components (N)
un=Input vector
U=Absolute value of aircraft velocity (m/s)
Ux,Uz=Components of the aircraft velocity vector (m/s)
Xn=State vector
x,z=Referential coordinates
(xi,zi)=Position of aircraft part i point of application of forces and moment (m)
(xcgi,zcgi)=Position of aircraft part i center of gravity (m)
α=Angle of attack (AOA) (Rad)
γ=Angle of climb (AOC) (Rad)
δj=Value of control inputs (elevator, power, span, camber)
θ=Pitch angle (Rad)
λi=Incidence angle of aircraft part i (Rad)
ρ=Air density (Kg/m3)
MORPHING aircraft are usually defined as aircraft that are capable of large or small changes in its configuration that produce an increase in the aircraft performance parameters, usually expanding its operational range.
Examples of morphing technologies are high lift devices such as flaps and slats, which are used since very early times in aviation history. These technologies allow the aircraft wing to change its camber and increase its chord and area, allowing the aircraft to fly at lower speeds during take-off and landing. More recently, there has been some research on new ways of changing camber and wing area through usage of several types of novel and traditional actuators [1].
Camber morphing is performed using smart materials as actuators. Piezoceramic composite actuators were studied and optimized for camber morphing using fluid-structure interaction [2] and further developments of this technology led to wind tunnel and flight demonstration [3]. Other studies about hingeless camber morphing wings using elastomeric skin patches [4] and on the static aeroelastic behaviour of such devices using nonlinear models [5] were also made. Shape memory alloy is another example of a smart materials used in camber morphing actuation [6].
Studies on aerodynamic optimization and internal structure calculations have been performed [7] as well as studies on determinate structures [8], both for camber morphing. Aerodynamic optimization of span wise camber morphing in a high aspect ratio wing [9] is another example of a study involving camber change.
New concepts for the traditional flaps have also been subject of research. Flaps achieving specific shapes at the trailing edge were studied through nonlinear numerical models [10]. Other novel but simple flap concept that ensures continuity of the upper surface of the airfoil was studied and compared with a conventional flap both numerically and experimentally [11].
Studies on the effects of significant geometric changes on the wing area include span [12,13] and chord morphing. A study on the chord, span and airfoil morphing of a flexible skin wing was performed using numerical methods coupling finite element models with aerodynamic optimization algorithms [14], while configuration optimization of telescopic wings for both minimum drag and roll rate calculation [15] and evaluation of actuation performance on telescopic wings have also been studied [16].
Other morphing concepts include variations on wing geometric parameters as wing twist [17,18] or continuously change the shape of wingtips [19] or winglets [20], usually for stability and maneuverability improvement. Studies on compliant structures for morphing have also been performed [21-23]. An extensive review on materials that stand as candidates for morphing structures can be found in [24].
The evaluation of the morphing technologies benefits and penalties has also been studied. Effects of weight increase in morphing aircraft [25], performance of telescopic wings in loiter and attack missions [26] and overall quantification of morphing benefits [27] are just some examples of studies on this area.
This paper contributes to the state of the art by introducing a new methodology for the assessment of the benefits of morphing technologies based on energy balance and performance evaluation and comparison. Using this methodology, engine output energy and actuation energy are quantified as well as several longitudinal performance parameters as climb and descent rates and angles, stall speed and maximum cruise speed, allowing the comparison between different aircraft in terms of cinematic and energetic performance in a set of missions.
The methodology is used to calculate and compare the static and dynamic longitudinal performances of two aircraft which differ only on the wing: one is equipped with an optimum fixed wing (Fixed Wing Aircraft-FWA) while the other is equipped with a morphing wing which allows changes in span and camber (Morphing Wing Aircraft-MWA).
Section II describes the morphing and fixed wing geometries and the morphing wing span and camber variation capabilities.
In Section III the analytical model is explained and in section IV static analyses for cruise, climb and descent at different speeds and angles are made for both aircraft using a first order optimization algorithm. Results are presented as well as conclusions about the benefits and penalties of the morphing technology usage.
Section V describes the dynamic modeling formulation for optimal control calculation and Section VI presents the results of its usage in a set of climb-cruise and descent missions analyses for both aircraft, and comparisons are made. Section VIII presents the concluding remarks.
Details about the morphing wing and the potential aerodynamic benefits of the telescopic and camber morphing be found in a previous paper [28]. The MWA half wing is a telescopic half wing composed by an outer wing and an inner wing that slides out of the outer wing, therefore increasing span. In addition to the span increase capability, the inner and outer wings are equipped with variable camber airfoil stations, which allow the wing to change its airfoil shape continuously from a NACA0012 to a NACA7312 [29], maintaining the same airfoil shape along the span for both the outer and inner wing.
Table 1 show the geometric parameters of the morphing wing and Figure 1 shows the airfoil shape variation from no actuation to full actuation.
| Dimension (half wing) | Quantity |
|---|---|
| Inner wing chord | 0.208 m |
| Inner wing span | 0.950 m |
| Outer wing chord | 0.261 m |
| Outer wing span | 1.000 m |
| Span variation | 2.000-3.400 m |
| Span increase | Up to 70.0% |
| Area variation | 0.521-0.813 m2 |
| Area increase | Up to 56.0% |
| Aspect ratio variation | 7.68-14.22 |
| Aspect ratio increase | Up to 83.6% |
| Camber variation | 0%-7% |
Table 1: Morphing wing geometric data.
The FWA wing geometry is the result of an aerodynamic optimization process described also in [28], which minimized wing drag for a lift production of 98.6 N and a cruise speed at sea level of 30 m/s. For comparability, the airfoil family used for the optimization was the same of the morphing wing (NACA 4 digit series) as well as some other geometric constraints.
Table 2 shows the geometric characteristics of the optimum fixed wing.
| Dimension | Quantity |
|---|---|
| Root chord | 0.250 m |
| Tip chord | 0.167 m |
| Root camber | 5.3% |
| Tip camber | 0.0% |
| Span | 2.000 m |
Table 2: Optimum fixed wing geometric data.
The analytical model is used to analyze and compare the longitudinal flight performances of the aircraft equipped with the optimized fixed wing (FWA) and the same aircraft equipped with the morphing capability (MWA) and a weight penalty of 9.9 N (1 kg mass penalty, therefore requiring a total of 108.5 N lift in cruise) resulting from the extra morphing mechanisms and structures. This weight penalty, although arbitrary, is based Finite Element Model weight results, representing 55% of the total wing weight and 10% increase in the total aircraft weight relative to the FWA [28].
In this work, the aircraft parts considered for the analytical model are described in Table 2 (Figure 2).
For each aircraft part, the data on Table 3 is provided along with the aerodynamic functions describing the Lift, Drag, Pitch Moment variation with the Angle of Attack (AOA) and controls of as well as engine efficiency with speed on the Annex. Please refer to the list of symbols for the meaning of each property.
| Part # | S (m) | c (m) | CG (m) | AC (m) | M (kg) | Iyy (kg m2) | λ(°) | Cont | Power (W) |
|---|---|---|---|---|---|---|---|---|---|
| 1 - MW | 0.813 | 0.261 | (-0.104,-0.4) | (0,-0.4) | 2.20 | 9.33e-3 | 2.4 | 2 | 0 |
| 1 - FW | 0.417 | 0.209 | (-0.083,-0.4) | (0,-0.4) | 1.20 | 3.26e-3 | 2.4 | 0 | 0 |
| 2 - HT | 0.209 | 0.209 | (-1.136,-0.3) | (-1.052,-0.3) | 0.10 | 2.7e-4 | 0 | 1 | 0 |
| 3 - FS | 0.417 | 0.2 | (-0.3,-0.3) | (-0.3,-0.3) | 1.00 | 0.141 | 0 | 0 | 0 |
| 4 - EN | 0 | 0 | (0.3,-0.35) | (0.3,-0.35) | 1.60 | 0 | 0 | 1 | 2942 |
| 5 - BAT | 0 | 0 | (0,0) | (0,0) | 0.75 | 0 | 0 | 0 | 0 |
| 6 - PL | 0 | 0 | (0,-0.3) | (0,-0.3) | 5.35 | 0.752 | 0 | 0 | 0 |
MW-Morphing Wing FW-Fixed Wing HT-Horizontal Tail FS-Fuselage EN-Engine BAT-Battery PL-Payload
Table 3: Data used in the analytical model describing the inertia and power properties of the different aircraft parts.
The data on Table 3 and in the Appendix along with the flight conditions of the aircraft (air density, speed, climb/descent angle, pitch angle and pitch rate) and the values of the control surfaces and power can be used for calculation of the longitudinal dynamic system.
Assuming that the aircraft and its movement are always symmetrical relative to the xz plane in Figure 2, and that the local coordinate system in Figure 2 remains attached to the CG and parallel to the inertial coordinate system, the CG movement can be expressed as in (1) [30].
Calculation of forces and moments acting on each aircraft part consider the local angle of attack and the effect of the controls. For that, the pitch rate and the distance from the center of gravity of the aircraft are used. Local airspeed variations relative to free stream speed due to aircraft rotation are neglected (2).
Aerodynamic interference between aircraft parts is neglected or assumed included on the aerodynamic coefficient functions provided.
This model was programmed and run in Matlab© environment.
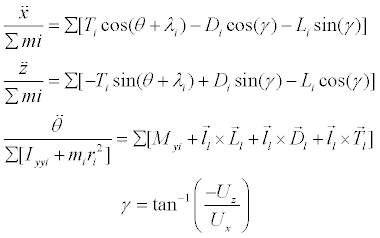 (1)
(1)
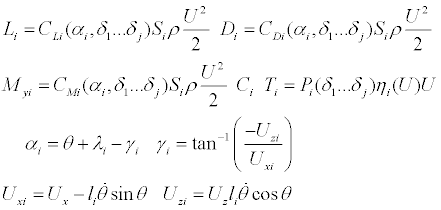 (2)
(2)
Considering static cruise, climb or descent, one can use the analytical model to calculate the necessary values of the aircraft controls in order to minimize some objective function. The optimization algorithm used is the fmincon function in Matlab© with all options left with the default values.
As energy consumption is usually the most promising parameter to minimize when economic and environmental issues are considered, the engine output power was considered the objective function to minimize in an optimization procedure which calculates the optimum elevator control value and, in the case of the MWA, the span and camber configuration control values for cruise flight, while constraining linear and angular accelerations to zero.
Climb performance evaluation consisted in calculating the maximum/minimum climb angle for a prescribed aircraft speed using the same optimization algorithm with different objective functions.
Table 4 summarizes the optimization statement for engine output power minimization in cruise, and for maximum and minimum climb angle calculation.
| Aircraft | Objective Function: min F= | Variables | Constraints | |||
|---|---|---|---|---|---|---|
| Cruise | Climb | Cruise | Climb | Cruise | Climb | |
| MWA | δ2 | -γ | -1 ≤ δ1 ≤ 1 |  |
||
| 0 ≤ δ2 ≤ 1 |  |
|||||
| 1 ≤ δ3 ≤ 1.7 |  |
|||||
| 0 ≤ δ4 ≤1 |  |
|||||
 |
 |
γ=0 |  |
|||
 |
 |
 |
||||
| FWA | -1 ≤ δ1 ≤ 1 |  |
||||
 |
||||||
| 0 ≤ δ2 ≤ 1 |  |
|||||
 |
||||||
 |
 |
γ=0 |  |
|||
 |
||||||
 |
 |
|||||
Table 4: Optimization statements for the MWA and FWA in cruise, climb and descent flight: Objective function, variables and constraints.
For the MWA case, δ1...δ4 represent the components of the control vector δ which are elevator, engine power, span and camber respectively. Span control values indicate the actual span to minimum span ratio, varying from 1 to 1.7, corresponding to 1 m to 1.7 m halfspan; camber and engine power control values represent the fraction of their maximum values which is used at different speeds, varying from 0 to 1, corresponding to 0% to 7% in the camber case and to 0 W to 2942 W in the engine power case; elevator control values represent the fraction of the maximum positive or negative displacement, varying from -1 to 1, corresponding to -40° to 40°.
For the FWA case there is no span and camber controls, therefore the control vector has only two components δ1...δ2, which represent elevator and engine power varying from -1 to 1 and from 0 to 1 respectively, corresponding to the same values as for the MWA.
In both cases the Angle of Attack (AOA) of the wing, which is given by the pitch angle θ subtracted by the incidence λ1, is limited to prevent the wing from operating at angles outside the range limited by the negative and positive stall angles [-10, 10](°). Also in both cases the value of the climb angle γ is constrained to be null, representing the leveled flight condition.
Cruise power requirement performance comparison
Figure 3 compares the engine output power in cruise of the FWA and the MWA with the same incidence angle.
From the above results, it is expected that power requirement in cruise of the MWA is higher than the power requirement of the FWA only in a narrow range of speeds between 30 and 35 m/s. The maximum power requirements penalty of the MWA is about 4% at 34 m/s. It is also clear that the MWA reaches higher cruise speed and lower stall speed.
Figure 4 shows the variation of the morphing wing optimal configuration (span and camber), as well as engine power and elevator actuation of both the MWA and FWA with cruise speed.
Variation of the morphing wing configuration shows, as expected, that at lower speeds span and camber are at its highest values. As speed increases, the first parameter to change in the morphing wing configuration is the span, followed by the camber, which varies continuously and closely linearly within the speed range from 19 to 30 m/s from maximum to minimum value.
The span varies within three speed ranges closely linearly with different slopes for each speed range, always decreasing. The first speed range is from 15 to 20 m/s, the second is from 20 to 30 m/s (coincident with the camber variation) and the third is from 30 to 44 m/s. Above 44 m/s minimum span is reached.
Elevator actuation for the aircraft MWA increases as speed increases and the AOA decreases. As wing camber reaches its minimum value and the span reduces maintaining the AOA, elevator actuation is approximately constant and close to zero. When minimum span is reached and speed increases there is a reduction in AOA and therefore an increase in elevator actuation for pitch moment balance.
For the FWA elevator actuation is always increasing as speed increases and AOA decreases, balancing the pitch moment.
As the calculation is made for a range of speeds, one can identify both the maximum climb angle as well as the maximum rate of climb. Figure 5 shows the variations of maximum rate of climb and maximum climb angle with aircraft speed. It can be seen that, in the speed range between 24 and 39 m/s, the climb performance of the FWA is better than the performance of the MWA. Also the maximum rate of climb is higher in the FWA case and the maximum climb angle is higher for the MWA case. Maximum penalties in rate of climb and angle of climb are 12.1% and 12.4% respectively, at 34 m/s.
The results for the optimal controls variation with speed for the morphing wing equipped aircraft at maximum climb rate show similarity with the wing configurations for cruise condition, as could be expected since the engine output power minimization in cruise leads to a configuration with the most available engine power for climb.
Although static analysis gave the insight on the benefits/penalties and limits on the longitudinal performance of the MWA relative to the FWA, it does not account for morphing wing actuation capability and energy, acceleration performance and transient influence on engine power output.
To study these issues the dynamic model introduced in the previous section is used in a wider optimization scheme in order to determine the control of the MWA and of the FWA that allows the best adjustment to a given trajectory while also considering the best configuration for minimum engine power output.
Dynamic system linearization for control optimization
Considering a time step sufficiently small and a given set of functions representing the aircraft controls variation with time the accelerations calculated using (1) and (2) can be considered constant along the duration of the interval. Velocities and positions at the end time of the time step can then be calculated through integration of the accelerations as long as the previous state is known (3).
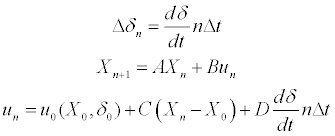
The system described in (3) is similar to the usual formulation in linear systems control [31]. In this study, the input vector u_n is the acceleration vector, which is a function of the inputs of the controls (4).
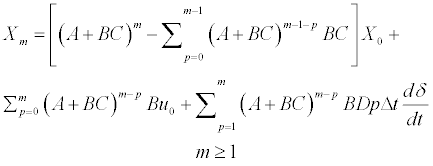
Nevertheless, one can assume that the acceleration vector varies linearly with the state vector and the controls variation, in the vicinity of a known initial acceleration vector u0 (5). Furthermore, assuming the controls variation to be linear in time (6) and expanding one can calculate the state vector in the time span mΔt (7). The formulation in (7) is suitable for estimation of the aircraft state vector in a time span which is a multiple of the time step Δt and small enough for the assumption of linear controls variation and linear variation of acceleration with the state vector and controls to be valid as a good approximation. The formulation also assumes that the aircraft mass is constant in the time span.
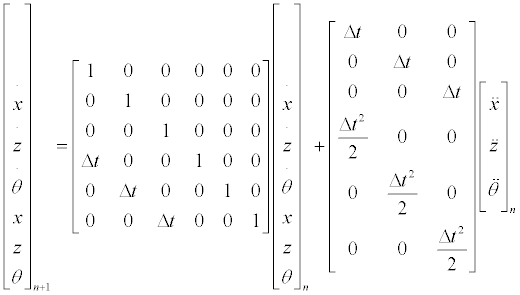 (3)
(3)
 (4)
(4)
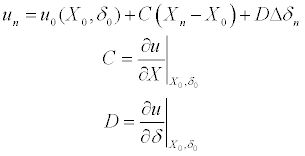 (5)
(5)
 (6)
(6)
 (7)
(7)
Optimal control calculation
The optimal control for the minimization of an objective function involving the aircraft position, speed and configuration at time tm=t0+mΔt can be calculated using the estimate of the state vector given by (7). As the optimal control variation within the time span is determined, integration of the accelerations produced by such control can take place using (1), (2) and (3). At the end of the time span, a new state vector and control vector may now be used to continue the calculation of the optimal control in time.
This procedure allows changing the control variable boundaries at the end of each time span, which can be used to introduce limitations on actuation speed on the dynamic modeling. It allows also the renewal of C and D in (6) using finite differences, therefore obtaining the derivatives of the acceleration vector in the vicinity of the initial acceleration vector relative to the components of the state and control vectors. Thus the influence of the state vector and control variation on the acceleration vector is recalculated at each time span mΔt. Figure 6 shows the optimal control calculation procedure flowchart.
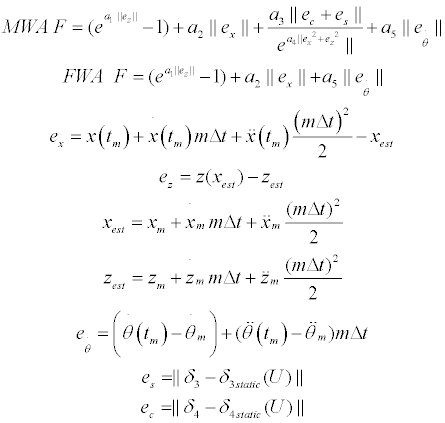
The objective function: The objective function used in the procedure of Fig. 8 is intended to enforce, by order of priority:
Trajectory altitude tracking (avoiding collision with obstacles like buildings or terrain)
• Global trajectory tracking (altitude and position)
• Optimal wing configuration (in the MWA case)
• Static flight
These goals are mathematically expressed in (8):
 (8)
(8)
xm, zm and θm are the first three components of the estimated state vector Xm, representing the estimated ground position, estimated altitude and estimated pitch angle, respectively, while  ,
,  and
and  are the last three components of Xm, representing the estimated ground speed, estimated vertical speed and estimated pitch rate, respectively, all at time
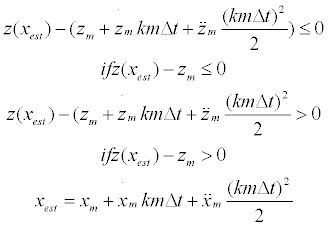
  xest and zest are the ground position and altitude estimates at
  , which assume constant acceleration components estimates during tm to t,
 ![]() ,
,  and
and  calculated based on the estimated state vector information.
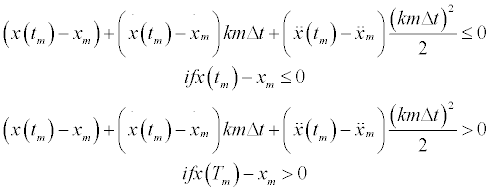
x(tm),  and
and  are the ground position, ground speed and ground acceleration from the desired trajectory at time tm. Similarly
  and
and  represent the desired trajectory pitch rate and pitch acceleration (assumed null in this study, we cannot foresee any practical situation when it could be different).
z(xest) represents the desired trajectory altitude at the ground position xest.
 and
and  represent the prescribed values for the MWA configuration for span and camber at the desired trajectory speed (U) and flight stage (climb, cruise or descent), obtained from the static analysis.
Coefficients a1…a5 can be chosen in order to produce different solutions, emphasizing more ou less the wing configuration or static flight conditions over trajectory error.
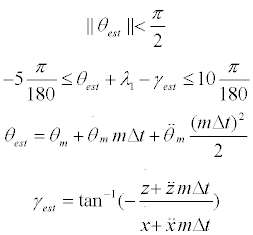
The constraints: In this optimization scheme, the constraints are used not only for limiting flight parameters such as AOA and pitch angle θ (9) but also to aid preventing trajectory overshoot as result of the optimal control calculation and maintaining static flight conditions, therefore improving the convergence of the algorithm.
 (9)
(9)
θest and γest are the pitch and trajectory angle estimates calculated with the same assumptions as xest and zest.
One constraint (10) is used to estimate the aircraft ground position error in a period of time equal to k time spans based on the current and desired positions, velocities and accelerations, maintaining the aircraft behind or ahead the desired ground position at the end of that time period, depending on the aircraft being behind or ahead the desired ground position at the beginning of the time span, respectively.
 (10)
(10)
Another constraint (11) is used in a similar fashion to the previous one, this time to maintain the aircraft below or above the trajectory at the end of the time span, depending on the aircraft being below or above the trajectory at the beginning of the time span, respectively.
 (11)
(11)
Finally, one last constraint (12) prevents the aircraft from climbing or descending indefinitely (thus decreasing or increasing ground velocity) if the aircraft is ahead or behind the desired ground position respectively, by limiting the maximum altitude deviation.
 (12)
(12)
It is not certain that these constraints can be respected at every time span. Therefore, if the solution is infeasible due to the impossibility to respect any of the constraints expressed by (10), (11), or (12) the constraint or constraints that are not respected are discarded and a new calculation takes place for that time span.
The design variables: The design variables in this optimization scheme are the rates of change of the controls with time dδ/dt, assumed to be constant in the time span mΔt. This assumption means that the controls vary linearly in the time span, but the slope of the variation can change from one time span to the next.
The boundaries of the design variables can also be changed from one time span to the next. Therefore, the actuation time can be simulated by bounding the design variables in accordance to their value at the beginning of the time span and their maximum and minimum achievable values at the end of the time span.
Missions analysis
Table 5 indicates the mission profiles analyzed. 128 missions with climb-cruise profile were analyzed and 5 missions with descent profile were analyzed.
| Climb | Cruise | |
|---|---|---|
| Speed (m/s) | Angles (°) | Speed (m/s) |
| 20 | 5, 10, 15 | 20, 25, 30, 34, 35, 40, 45, 50 |
| 25 | 5, 10, 15 | |
| 30 | 5, 10, 15 | |
| 34 | 5, 10 | |
| 35 | 5, 10 | |
| 40 | 5, 10 | |
| 45 | 5 | |
Table 5: Profile Climb-Cruise.
The climb-cruise mission profiles start with the aircraft at 10 m altitude cruise at the same speed as the total aircraft speed in the climb phase and with the corresponding minimum power configuration, in the case of the MWA. Then follows a transition from cruise to climb which translates in a constant acceleration in periods that vary between 1 s and 4 s. Higher transition times are used for higher climb angles to prevent excessive trajectory error in the beginning of the calculation. The climb and cruise flight phases take 60 s each, and the optimal control calculations were done for the first 120 s of the missions.
These profiles also present a discontinuity in the climb to cruise transition, with a sudden change in ground speed and rate of climb. These discontinuities are used to assess and compare the acceleration/ brake performance of the MWA and the FWA, as well as the advantages/ disadvantages of the wider speed range and weight of the MWA relative to the FWA. It allows also the evaluation of the optimization algorithm with respect to its capability to capture the expected adaptability of the MWA to the flight conditions and the trajectory.
Control optimization algorithm parameters: In the performed analysis, the time step Δt=0.01 s, while the time span mΔt=0.5 s. The integration of the forces and moments obtained from the calculated controls variations is made using the same time step. The weighing factors on the objective function (7), a1, a2, a3, a4 and a5, were equal to 1, 1, 5, 0.5 and 10 respectively. The k factor used in the constraints (10) and (11) was equal to 5.
The elevator and thrust controls are assumed to vary from -1 to 1 and from 0 to 1 in a minimum of 0.5 s, respectively. For the MWA the span control is assumed to vary from 1 to 1.7 in a minimum of 5 s and the camber control is assumed to vary from 0 to 1 in a minimum of 2 s. Inverse control variations are assumed to take the same amounts of time. These parameters are used in the calculation of the design variables upper and lower bounds.
The optimization algorithm used is the fmincon function in Matlab© with all options left with the default values.
Climb-cruise missions analysis
Trajectory tracking: In a qualitative analysis the optimization algorithm used calculates the control required for the trajectory tracking in a very satisfactory way. Trajectory altitude is tracked efficiently and the trajectory line is closely followed in space. Only during transitions between flight phases the desired trajectory is not tracked, but the aircraft attempts immediately to recover the right trajectory track. Altitude and ground position error are kept below 0.5 m and 1 m respectively, when the aircraft is close to static flight conditions and close to the desired trajectory point.
Ground speed and rate of climb show the corresponding behavior both when the aircraft is on track and when it is not, accelerating/ braking and descending/climbing as required to correct the trajectory.
Pitch angle, AOC and AOA are all within the limits of the constraints applied in the calculation of the control. The trajectory AOC is well on track in the majority of the trajectory length since trajectory altitude tracking is the most enforced term in the objective function, meaning that the relation between ground position and altitude of the desired trajectory is maintained even if the ground position error is large. There are however oscillations around the desired AOC whenever flight stage transitions occur, reflecting the aircraft attempt to recover the desired altitude for the current ground position, whether it is in the transition from the initial cruise to climb at the start of the mission, or recovering the desired trajectory speed after reaching the trajectory track.
Figures 7a-7e show the trajectory related data from the control calculation and acceleration integration for three different climb-cruise missions as examples that confirm these observations. The missions include climb at low climb angle and high speed followed by cruise at low speed (mission 1: AOC=5° U=45 m/s, U=20 m/s), climb at medium climb angle and medium speed followed by cruise at medium speed (mission 2: AOC=10° , U=34 m/s, U=34 m/s) and climb at high climb angle and low speed followed by cruise at high speed (mission 3: AOC=15° , U=20 m/s, U=45 m/s).
Acceleration and brake performance: One can observe from the ground speed variation with time curves of mission 1 for the MWA and FWA on Figure 7c that the FWA has slightly higher acceleration capability than the MWA, since the FWA reaches higher speed earlier that MWA after the transition from climb to cruise. On the other hand, the ground speed variation with time curves of mission 3 for the MWA and the FWA on Figure 7c show a slightly higher capability to slow down of the FWA relative to the MWA, since the FWA reaches lower speeds earlier than the MWA after the transition from climb to cruise. The major reason for this is that the FWA has smaller mass than the MWA.
Actuation time of the MWA could also influence acceleration/ brake performance since the MWA does not change configuration instantaneously, therefore limiting its capability to reach optimum configurations at a specific time. In the mission 1 case the actuation time of the MWA does not allow it to change configuration and accelerate enough at the time around 85 s and therefore the MWA overshoots the trajectory position and stays behind the desired ground position. This result comes from the observation of the referred curves and the corresponding span and camber control variation with time curves in Figure 8.
Wider MWA cruise speed envelope
The influence of the wider cruise speed envelope is shown in the ground speed variation with time curves and the ground position error variation with time curves of missions 1 and 2 in Figure 7c and a respectively. The lower stall speed and the higher maximum speed of the MWA allow it to reduce the ground position error in a smaller time in missions 1 and 3 respectively.
Algorithm for adaptability: The control optimization algorithm allows the MWA configuration to change from the prescribed configuration if the altitude and/or ground position error is large. This situation happens in the climb to cruise transitions of missions 1 and 3. Figure 8 shows the span and camber control variation with time calculated for the three missions.
In mission 1, one can observe clearly the adaptation of the span and camber to a high drag configuration in order to slow down the MWA (starting at t=60 s), followed by a quick transition to high speed configuration for acceleration (at t=85 s), trying to avoid ground position overshoot (as mentioned above) and finally assuming the best cruise configuration for the 25 m/s cruise as the ground position error becomes small.
In mission 3, there is a reduction of span and camber in order to allow the MWA to accelerate and recover from the delay after the climb to cruise transition. No further changes in the wing configuration happen afterwards since at 45 m/s and above the best wing configuration is minimum span and camber.
In mission 2, relatively small span and camber configuration changes occur at the beginning of the mission, in the transition to climb and afterwards the configuration is maintained.
Elevator control: Figure 9 shows the control values of the elevator for the three missions. The absolute values of the MWA elevator control are significantly lower than the absolute values of the FWA elevator control at speeds significantly higher or lower than the FWA optimum speed (34 m/s). Observing the AOA variation with time in Figure 7e one can see that the MWA also operates at lower absolute values of the AOA than the FWA. Thus lower forces act on the MWA elevator and one can expect lower elevator actuation energy for the MWA relative to the FWA.
Engine output energy: Figure 10 shows the engine output energy difference between the MWA and the FWA relative to the FWA total engine output difference. One can see that, as expected, engine output difference is linear with time when the aircrafts are in static flight conditions. The energy output difference variation with time curves show different slopes in different flight phases.
Transitions between flight phases also have effect on the energy output difference, but its significance in the final value depends on the amount of transitions and also in the time length of the flight phases.
In the cases of missions 1 and 3, one can see that there is less engine output energy consumption in the MWA than in the FWA, both in climb and cruise. In mission 2, the MWA consumes more engine output energy than the FWA, also both in climb and cruise. These observations agree with the static data presented in section IV.
Actuation energy estimate and total energy difference
Span and camber: Based on experimental values obtained in laboratory tests (Table 6) for the maximum actuation power for changes in span and camber, the maximum energy per meter of span variation required for the actuation is about 0.3 kJ/m and the maximum energy per percent variation in camber relative to maximum camber is 0.5 kJ/%.
| No. of actuators | I (A) | V (V) | Act. time (s) | |
|---|---|---|---|---|
| Span | 2 | 1.76 | 12 | 5 |
| Camber | 18 | 1.5 | 9.6 | 2 |
| Elevator | 1 | 1.5 | 6 | - |
Table 6: Voltages and maximum currents assumed valid for the actuation of the span, camber and elevator controls.
These values are based on the maximum current read while changing the span and camber of the morphing wing under loading with DC electrical actuators at fixed voltage. Therefore they represent a conservative estimate of the actuation energy, since the loading and the current varies with the configuration of the morphing wing.
Multiplying these values by the integral of the control values changes for span and camber in each time step we obtain a conservative estimate of the energy spent in actuation of the morphing wing in each mission. The maintenance of a specific configuration is assumed not to require actuation energy.
Elevator: The actuation energy for the elevator control is assumed to be proportional to the displacement of the elevator relative to the zero position and to the time it is kept in that position. This assumption penalizes the elevator actuation energy for the FWA in the wider range of the missions analyzed, since, as stated before, the levels of the elevator control for MWA are generally lower than for the FWA.
The authors believe that the overall energy balance would be more complex but not significantly different if mechanical trimming would be included in the model.
Magnitude differences between actuation and engine output energy: Table 7 indicates the maximum and minimum engine output energy for each phase of all the climb-cruise missions for the MWA and FWA and also the maximum and minimum engine output energy of all the complete climb+cruise missions, and compares these values with the maximum actuation energies for the span, camber and elevator controls.
| Control energy (KJ) | Climb | Cruise | Climb+Cruise | ||||
|---|---|---|---|---|---|---|---|
| MWA | FWA | MWA | FWA | MWA | FWA | ||
| Engine Output | Max | 172.2 | 164.9 | 176.1 | 176.4 | 341.4 | 341.1 |
| Min | 73.9 | 91.8 | 28.9 | 50.4 | 111.5 | 149.0 | |
| Span | 0.2 | - | 0.6 | - | 0.7 | - | |
| Camber | 0.5 | - | 2.0 | - | 2.1 | - | |
| Elevator | 0.06 | 0.24 | 0.16 | 0.25 | 0.16 | 0.48 | |
Table 7: Maximum and minimum values of engine output energy and maximum actuation energies for span, camber and elevator control for the MWA and the FWA for all Climb-Cruise missions analyzed (all values in KiloJoules).
The engine output energy values are calculated assuming that variation of the engine power output with the engine power control is linear and varies from 0 to the maximum power indicated in Table 3. The engine power is considered constant during Δt and integrated accordingly.
From Table 7 one can observe that the magnitude of the actuation energies used for span, camber and elevator control are one or two orders of magnitude smaller than the engine output energy for both the MWA and the FWA. In fact, when comparing every climb-cruise mission, the maximum ratio between the sum of span, camber and elevator control energies and the engine output energy is only 1.4%.
One can also observe that the energy spent changing camber is significantly higher than the energy spent in span control, that is also higher than the energy used in elevator control for the MWA. Another observation is that the higher elevator control energy used with the FWA relative to the MWA, which confirms what was stated before in comments to Fig. 11 under the assumptions made about the energy calculation
Total energy differences
Table 8 shows the energy difference between the MWA and the FWA at each phase of the climb-cruise missions.
| AOC(°)/U (m/s) | 20 | 25 | 30 | 34 | 35 | 40 | 45 | 50 |
|---|---|---|---|---|---|---|---|---|
| 0 | -45.12% | -14.93% | 1.87% | 4.52% | 1.86% | -8.72% | -17.02% | -16.48% |
| 5 | -27.47% | -6.01% | 4.98% | 6.91% | 5.03% | -3.45% | -11.17% | - |
| 10 | -17.48% | -1.19% | 6.51% | 8.15% | 6.73% | -0.33% | - | - |
| 15 | -11.64% | 1.19% | 6.77% | - | - | - | - | - |
Table 8: Total energy differences between the MWA and the FWA in the climb and cruise missions phases relative to the FWA total energy.
The energy differences values for the cruise flight phase were calculated using the energy values obtained from the missions with the preceding climb phase at climb speed equal to the cruise speed and at the minimum climb angle (5°), with the exception of the value for cruise at 50 m/s, which was calculated using the results of mission (AOC=5°, U=45 m/s)-(U=50 m/s). Therefore, since the configuration changes and actuation energy used in the transition between flight phases is minimum, they represent an approximation to the energy differences values that would be obtained if the flight phase is long enough for the actuation energy significance to become reduced.
The energy differences in cruise show a small penalty relative to the values obtained in the static analysis for the engine power output which originated Figure 3 and are presented in Table 9. Therefore the speed range where the MWA experiences an energy penalty relative to the FWA in cruise is slightly wider than calculated in static conditions, mainly due to the actuation energy which is now accounted for.
| U (m/s) | 20 | 25 | 30 | 34 | 35 | 40 | 45 | 49 |
|---|---|---|---|---|---|---|---|---|
| Power diff | -46.44% | -16.94% | 0.45% | 4.08% | 1.29% | -9.64% | -16.86% | -19.04% |
Table 9: Engine output power differences between the MWA and the FWA in cruise obtained from static analysis.
There is a decrease in the MWA benefits relative to the FWA as the AOC increases at all speeds. This is due to the weight penalty of the MWA, which puts extra demand on engine thrust as the AOC increases.
Dynamic analysis observations
The dynamic modeling described in association with the optimization algorithm seems suitable for optimal control calculation for trajectory tracking, allowing definition of actuation times and aircraft configuration adaptability.
The wider operating speed range of the MWA allows it to recover from the trajectory errors more rapidly than the FWA when high or low speeds are required to do so.
Elevator actuation values for the MWA are in general significantly lower than the elevator actuation values of the FWA, which associated with a generally smaller absolute value of AOA of the MWA means a smaller trim drag than trim drag of the FWA. The same is observed for pitch angle, meaning that the fuselage is in general better aligned with the airflow, causing less pressure drag in the MWA than it would in the FWA.
The 10% weight penalty of the MWA associated with the actuation times for span and camber penalizes slightly the acceleration and brake capability when compared to the FWA. The weight penalty also causes a wider speed range where there is penalty in energy consumption for the MWA relative to the FWA, as the AOC increases.
The dynamic analysis of the climb-cruise missions confirms that, as long as the flight phases are long enough, the actuation energy used for configuration change between flight phases in the MWA is kept at low level, representing no more than 1.4% of the engine output energy.
The cruise energy consumption performance comparison between the FWA and the MWA based on the dynamic model agrees with the performances calculated in the static analysis. Calculation of energy benefits and penalties of the MWA relative to the FWA could be made based on the static calculations with small errors, since the energy spent on transitions from one flight phase to another is small.
The benefits/penalties of the MWA relative to the FWA increase/ decrease as the AOC increases.
Analytical models of the MWA and the FWA based on CFD aerodynamic data from previous work [28] were built and a dynamic modeling based on optimization was built and used to calculate the optimal control parameters for trajectory tracking.
The controls variations in time for the MWA and FWA were calculated for numerous missions and the algorithm has shown to successfully calculate the control for close tracking of trajectory, while allowing aircraft configuration adaptation when necessary.
The comparison between the MWA and the FWA described here shows that introduction of span and camber morphing on a 10 kg aircraft expands the range of operation significantly with not so significant penalties relative to the FWA.
Energy penalties calculated do not exceed 10% in any analyzed mission phase and performance parameters like acceleration and brake or climb speed are only slightly affected.
The descent performance of the MWA greatly exceeds the FWA one.
This work was possible due to the funding provided to the project SMORPH by the Portuguese FCT (Fundação para a Ciência e Tecnologia) and the funded project POCTI-EME-61587-2004 and the funding provided to the project NOVEMOR under the 7th Framework Programme of the European Union.
The author José Vale would like to also thank the Portuguese FCT for the Graduate Fellowship.