Journal of Oceanography and Marine Research
Open Access
ISSN: 2572-3103
ISSN: 2572-3103
Research Article - (2021)
This research looks at the impact of urban heat island in Gwagwalada urban and it's the rural surrounding area, it was achieved through the following; i) the change detection of Gwagwalada, ii) identifying the relationship between the rise in temperature as well as vegetation, iii) examining the effect of UHI on the inhabitants of Gwagwalada, iv) determining if Gwagwalada urban generates more heat than its rural environs. Landsat 7 and 8 satellite imageries were used to do the classification, NDVI, and land surface temperature analysis. While air temperature data from POWER climate data were applied toward analyzing the UHI index. Change detection of the study area shows that in 2020 the increase in urbanization affected the area while features like vegetation and water body reduced due to climate change and urban concentration. Land surface temperature also increased in 2020 due to various activities in the study area and the construction of surface imperious structures in the area. From the result of the air temperature with the calculation of the UHI index, it shows that temperature increased in the study area and some of the adaptation and mitigation measures were considered.
Urbanization, an effect of socio-economic growth in certain conditions, has progressively more turn out to be the main effect in many municipal areas [1]. Growing the immigration of inhabitants to cities and the increase of cities and towns will amplify the rise of temperature increase in the prospect. The heat island incident has a huge outcome on air pollution, pollution supervision, provincial temperature, and energy utilization increase in the air conditioner, as well as municipal wellbeing in city areas. The temperature disparity among cities as well as bordering regions was generated from a variation in immersed energy. Within the areas, dark-colored textures similar to asphalt, concrete, plus further construction resources were caused lessening within the albedo coefficient as a result increase in immersed energy. Various processes of lessening the pressure of heat island occurrence are growing vegetation, intensifying the city landscape, and using constructional resources with an elevated albedo rate. Heat Island (HI) happens when built-up areas temperature increases more compare to the extended rural areas, due to anthropogenic activities [2]. The temperature variation among built-up areas as well as its countryside environs is an outcome of variation in the mass of energy acquired and freed inside the city building resources, like asphalt and concrete. Sunlight is a part of electromagnetic radiation from the Sun through electromagnetic waves [3]. This is seen as Ultraviolet light, Visible, and Infrared.
Nigeria is among a small number of nations in Africa where urbanization is not a new occurrence as several cities are as aged as the primeval cities in Europe. Some of the towns are Kano,Katsina, Ado-Ekiti, Benin City, Ibadan, Oyo, Iwo, Oshogbo, and Ogbomosho, which were pre-colonial cities [4]. The country’s urbanization pace was predictably set at 5% as of 1973 also around 1980 almost 30% of the entire inhabitants have by now been dwelling in city centers [5]. In 2005, roughly 60% of the population in Africa, in broad, is anticipated to be a city. The nation’s metropolitan centers have been rising by twice the general inhabitants (expected at 2.5%) with twice the pace of municipal data in numerous nations of Europe and America [5].
Over the years, the rapid growth in population and industrialization affect the increase of monetary and communal roles in the city areas, and such have altered urban morphology and energy composition. Just like many satellite towns, Gwagwalada town consists of the planned and the unplanned sections. Population, raise above the past two decades, and the move of the country’s capital from Lagos to Abuja in 1991 [6]. Other social and economic functions such as the University of Abuja Teaching Hospital (UATH), University of Abuja, the intended siting of Federal Government seat of power in Gwagwalada town before it was moved out due to intense temperature rise and its clumsiness contributed to the high rate of land-use conversion which altered Gwagwalada land cover, resulting to temperature anomaly [6]. Gwagwalada city experiences urban heat and the urban and rural regions confirm a huge variance. This research aims to estimate the concesences of urban heat islands within Gwagwalada as well as its rural environs. These can be achieved with the subsequent objectives;
•To establish the change detection of Gwagwalada.
•To identify the relationship between the rise in temperature and vegetation.
•To examine the effect of UHI on the inhabitants of Gwagwalada.
•To determine if Gwagwalada urban generates more heat than its rural environs.
Two major organizations of study have appeared for measuring UHI [7]. Firstly, the cover level UHI is usually calculated by means of air temperature (T air), that is identified through in situ sensors on standard meteorological altitude or through the crossing of a mounted sensors. Secondly, surface UHI is calculated employing Land Surface Temperature (LST) resulting to air-borne or satellite-borne data remote sensing. T air is a straight UHI dimension plus nearer to that sensed by individuals, but the meteorological system inside a municipal region is not constantly as absolute it would be preferred. Hence, remote sensing data might give the spatial sharing of temperature around a huge vicinity, but can be merely not direct approximation of the UHI. Arrangement of mutually ways presents extra assessment in the explanation of UHIs [8]. UHI concentration is resolute as the spatially-equal temperature disparity among a municipal area as well as its neighboring rural district [9,10]. This conception, nevertheless, envelops a variety of diverse displays that are notable in conditions of delineation of what is well thought as “urban “as well as “rural [11]. The inspection of these signs plus their detailed methods may be seen in Schwarz et al. [8]. Based on an abstract of UHI researches carried out in the previous two years by [12], it was well-known that UHI amount was calculated only by exact indicators gotten from whichever remote sensing data (LST) or stationary and mobile measurements (T air). Like, Coseo and Larsen [13] referred to the T air variation among neighborhoods and the Chicago-Midway airport as UHI concentration to decide how three-dimensional built configurations as well as their nearby heat sources plus sinks consequence UHI in Chicago. Quan et al. took the variation between the urban plus rural LST based on MODIS Terra as well as Aqua data to signify UHI concentration to examine the spatial-temporal difference of UHI in Beijing, China [14]. Nevertheless, little effort were made to examine the variation involving UHI concentration calculated using LST and T air. One current research by Schwarz, et al., analytically calculated all signs of UHI concentration for the city of Leipzig employing airborne-based LST and Tair over two-time phases (19:30-21:00 on 22 September 2010 and 5:00-6:30 on 23 September 2010) and concluded that the assessment of the UHI concentration depended on the chosen sign and the data used [8]. Since the variation among LST and Tair is mostly controlled by the surface energy equilibrium throughout the daytime, and solar radiation throughout the night time has less consequence, it is essential to additionally investigating the hourly and seasonal variations among the standards of UHI concentration that are calculated using LST and Tair. Landsat thermal-infrared data is an influential means that can be used to learn the urban thermal surroundings [15]. The long-term evidence since 1984 and the comparatively fine spatial resolution of the Landsat 5 data make this evidence the foremost basis for UHI investigation. Hence, this study evaluates the calculated value of UHI concentration using equally Landsat LST and Tair as well as can give a meticulous analysis of the long-term temporal difference of UHI. This research used the concept of Environmental determinism which says that individual growth, improvement, and behavior are restricted by the climate and physical environment. And Environmental Possibilism says that the environment and climate impose certain constraints or limitations, but human actions determine the way the environment will suit him.
The research area is Gwagwalada city. It’s one of the biggest satellite cities in Abuja [16]. It also one of the mainly heavily inhabited districts in the federal capital territory (FCT) and the headquarters of one of the oldest councils in the Federal Capital Territory, Abuja [6]. The city observes a remarkable influx of public servants as well as the structured private division bringing about a sudden increase of the inhabitants into also within the Federal Capital City (FCC). Gwagwalada also experiences outstanding development and improved land conversion speed leading to temperature increase over time. The continuing loss of vegetal cover for construction as well as consequent buildings and urbanization normally led to a temperature rise in Gwagwalada urban with time [6]. Gwagwalada settlement is situated about 55 kilometers far from the Federal Capital City (FCC) inside the Federal Capital Territory. It lies amid latitude 08055 ‟ N also 09000 ‟ N and longitude 07000 ‟ E and 07005E [17]. Gwagwalada community area has a whole landmass of about 6,500 hectares. Gwagwalada city is made up of the older customary and latest designed sections. The old is the pre-1976 part, while the recent outcome from the development of the Federal Capital Development Authority following its intended responsibility within the spatial growth of the Federal Capital Territory (FCT). Its double parts' inner arrangement is relatively comparable to the pre-colonial city centers within the western along with northern parts of Nigeria [17]. The city centers are places in Gwagwalada, where the improvement of the metropolis is projected to increase out from thus substituting as increase pole of Gwagwalada city such places are phase 1,2, and 3, [18] (Figure 1).
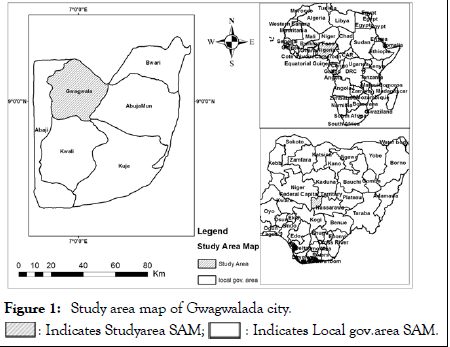
Figure 1: Study area map of Gwagwalada city. : Indicates Studyarea SAM;
 : Indicates Local gov.area SAM
Data and materials
The data applied for this research were derived data that holds spatial and atribute characteristics. The data comprises Landsat 7 Enhanced Thematic Mapper (ETM+) plus Landsat 8 Operational Land Imager (OLI) images, topographic maps, Temperature. Software packages consist of; ArcGIS version 10.5, Idrisi.
The Landsat imagery was acquired from (URL; http:// earthexplorer.usgs.gov). The imagery is, Landsat 7 ETM+image purchased on 27th December 2001 as well as Landsat 8 OLI purchased on the 22nd of January 2020. The satellite data has 30m spatial resolutions. ETM data have a spectral collection of 0.45-2.35 micrometers with bands 1,2,3,4,5,6,7 plus 8 while the OLI reached band 12.
Climate data (Air Temperature) were obtained from the Prediction of Worldwide Energy Resources (POWER)(https:// power.larc.nasa.gov/data-access-viewer/) for 2000 and 2019 yearly data.
Software analysis
The software employed is highlighted
ArcGIS 10.5: It’s a spatial and statistical analyst tool and was applied in the research to obtain together with the spatial analyses plus the spatial statistical analyses.
Idrisi: Supervised classification was being done by Idrisi, the land change of the Idrisi was applied to observe the land-use/ land-cover involving the years of surveillance.
Microsoft excel: is a spreadsheet software employ to approximate and investigate statistical information. The software was being used to spread out the statistical analysis.
To take out the research area, the topographic map covering the Enugu was georeferenced in the ArcGIS background. The methods approved for this study were grouped into four phases (a) Land Use/ Land Cover (LULC). (b) Land Surface Temperature (LST) generated. (c) Normalized Difference Vegetation Index (NDVI) generated. (d) Urban Heat Island Index.
Normalized difference vegetation index
NDVI is applied to calculate the vegetation abundance as well as useful to understand vegetation density plus assessing fluctuations in vegetal health.
NDVI=NIR-R
NIR+R
While NIR means the near-infrared band
R means Red band
It is delivered a single-band result precisely.
Land surface temperature
Land surface temperature is the temperature of the earth from sun’s emission [11]. ArcGIS 10.5 was employed to recover the earth perceptible Temperature. Firstly the thermal band 6 imagery was used to calculate LST in Landsat 7 while thermal band 10 imagery was used to calculate Landsat 8. Conversion of the bands to spectral radiance using the calculation L=LMIN+(LMAX-LMIN)*DN/255
L which means spectral radiance at the sensor’s aperture in Wm-2sr-1 μm-1
LMIN which means spectral radiance scaled to QCALMIN (3.2 Wm-2sr-1 μm-1).
LMAX which means spectral radiance scaled to QCALMAX (12.65 Wm-2sr-1 μm-1).
QCAL which means DN
QCALMIN which means little sum quantized standardized pixel speed (equivalent to LMIN) in DN (0).
QCALMAX highest quantized standardized pixel rate (comparable to LMAX) in Digital Number (DN=255).
After which, it converted from spectral radiance to radiant surface temperature with the following formula
Tk=K2/(ln(K1/L+1)
Tk means the radiant surface temperature (in Kelvin).
K2 means calibration constant 2 (1282.71 K).
K1 means calibration constant 1 (666.09 Wm-2sr-1 μm-1).
L means the spectral radiance at the sensor in Wm-2sr-1 μm-1.
Which proceed with the conversion of radiant surface temperature to Land Surface Temperature with the following formula LST=TB/ (1+(λ TB/ ρ) lnε
LST means the Land Surface Temperature (in Kelvin).
TB means the Radiant Surface Temperature (in Kelvin).
λ is the wavelength of emitted radiance (11.5 μm).
ρ is h × c/σ (1.438×10⁻² m K).
h is Planck’s constant (6.26 × 10⁻³⁴ J s).
c is the velocity of light (2.998 × 10⁸ m/sec).
σ is Stefan Boltzmann’s constant (1.38 × 10⁻²³ J K-1).
ε is emissivity.
Then, the Land Surface Temperature will be changed to Celsius (Tc) as highlighted below
TC=LST-273
Where LST: Land Surface Temperature (in Kelvin).
Land use land cover
A supervised classification using the Maximum Likelihood Classifier was performed on a false-color composite (RGB 345) of Landsat 8 OLI imagery. The training areas were categorized into built-up areas, roads vegetation, and water body. A statistics table was obtained from the percentage of the land cover of the classes obtained. An accuracy assessment was performed using Google Earth for ground-truth verification did you use an error matrix, the overall accuracy was 75%.
Urban heat island index
The mainly frequent approach to examine the heat island occurrence is evaluating city areas with nearby rural areas. The majority of the researches, in this case, have been prepared by calculating the UHI index. The UHI index is employed to examine the rise of temperature development caused by heat island, evaluated with rural nearby areas. This index outlined below:
UHI=Tu-Tr
Tu is the Average Temperature of the city center plus, Tr is the Average Temperature of the rural regions.
Landuse/land cover analysis
The imagery was classified among five areas; Buildups, Vegetations, Bare surfaces, Waterbody, and Rocks and was been looked at from 2001 and 2020 respectively. The results of the land use classification show that Gwagwalada, Abuja which covers an area of 1,043 km2 , in 2001 was more dominated with the vegetative cover of 492.33 km, followed by buildup which was 228.85 km, while the water body was 102.36 km and bare surface and rocks account for 62.38 km and 78.19 km respectively. But in 2020, the case was different, because the vegetation reduced by 211.60 km, buildup increased to 660.89 km as a result of urbanization. While the water body reduced to 8.68 km due to the climate change effect. And rocks, as well as bare surface, reduced to 45.35 km and 37.59 km respectively (Figures 2 and 3).
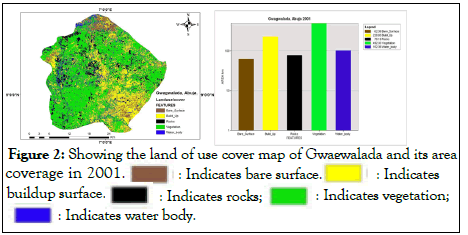
Figure 2: Showing the land of use cover map of Gwagwalada and its a coverage in 2001 : Indicate bare surface.
 : Indicates buildup surface.
 : Indicates rocks;
 : Indicates vegetation;
 : Indicates water body.
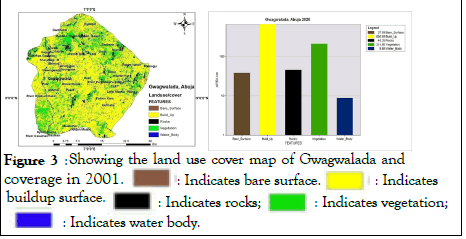
Figure 3: Showing the land of use cover map of Gwagwalada and its a coverage in 2001 : Indicate bare surface.
 : Indicates buildup surface.
buildup surface : Indicates rocks;
 : Indicates vegetation;
 : Indicates water body.
Analysis of the spatial pattern of normalize differential vegetation index (NDVI)
NDVI principles are indicated as a percentage fluctuating in rate from -1 to 1 however in groundwork, large difficult values show water, values with zero indicate bare soil, and values near one indicate solid green vegetation. In 2001 normalize differential vegetation index ranged from 0.09 to-0.38, with settlements like GwoGwai, Dobi, sharamaje, Pate, and Gunrafia having values from -0.38--0.18, while settlements like Maiakipai, River Chakun, Shebona, and Ebwa recorded a value of -0.18--0.16. And Pashi, Gasakba, Gajabe, Baban, Wuna, and Gidanbi recorded -0.12--0.09. The areas with the higher value show that there is vegetation presence (Figure 4).
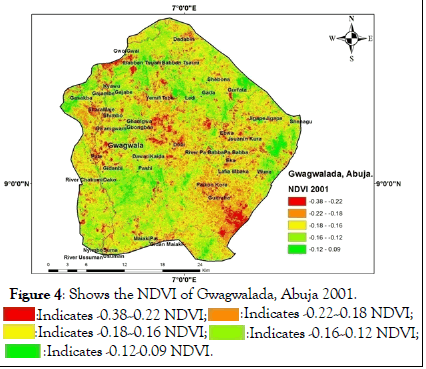
Figure 4: show the NDVI of Gwagwalada, Abuja 2001. :Indicates -0.38--0.22 NDVI;
 :Indicates -0.22--0.18 NDVI
 :Indicates -0.18--0.16 NDVI
 :Indicates -0.16--0.12 NDVI
 :Indicates -0.12-0.09 NDVI.
In 2020 the NDVI values increased from -0.05 to 0.37. Areas like River Chikun and Dobi had -0.05-0.10, while Paikon, Pashi, Tabe, Shebona, Gada, Gurfata, Gajabe, Kyawu, Ledi, and Jigape had values of 0.13-0.15. Finally, Shenagu, Laifia Mbaka, Dadabiri, GwoGwai, Tsauni, and Nyimbo had values of 0.17-0.37. This is attributed to the seasonal changes, plant photosynthetic activity, biomass, plant and soil moisture, plant stress, etc (Figure 5).
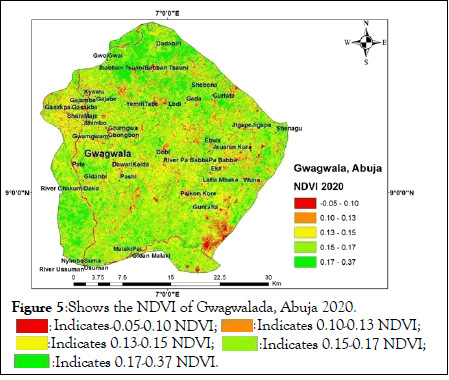
Figure 5: show the NDVI of Gwagwalada, Abuja 2020. :Indicates -0.05-0.10 NDVI;
 :Indicates 0.10-0.13 NDVI
 :Indicates 0.13-0.15 NDVI
 :Indicates 0.15-0.17 NDVI;
 :Indicates 0.17-0.37 NDVI.
Land Surface Temperature (LST) analysis
LST can be defined as an energy molecule on a surface. The hotter they are, the more they move. The LST of Gwagwalada as of 2001 shows the temperature to range from 42.36 C to 24.35 C. While in 2020 it increased from 43.87 C to 26.19 C, this is a result of an increase in urbanization, deforestation, surface imperviousness, and anthropogenic activities in the environment. In 2001, some areas like Gidanbi, Pashi, Nyimbo Suma, and MaiakiPai experienced a decrease in temperature, but in 2020 these affected areas experienced an increase in temperature. The high increase of people coming into Gwagwalada for settlement and more deforestation going on in the area and exposing the rocks and bare lands which in turn reflect the solar radiation to the environment as given rise to the increase in land surface temperature. Figure shows the LST of Gwagwalada in 2001 (Figures 6-8).
Figure 6: shows the LSTof Gwagwaladain 2001. :Indicates 24.35-28.80 LST;
 :Indicates 28.80-30.29 LST;
 :Indicates 30.29-31.27 LST;
 :Indicates 31.27-32.69 LST;
 :Indicates 33.69-42.36 LST.
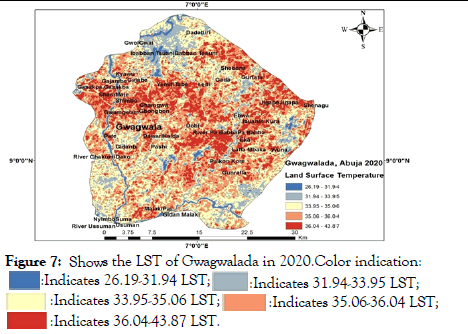
Figure 7: shows the LSTof Gwagwalada in 2020.Color indication:. :Indicates 26.19-31.94 LST;
 :Indicates 31.94-33.95 LST;
 :Indicates 33.95-35.06 LST;
 :Indicates 35.06-36.04 LST;
 :Indicates 36.04-43.87 LST.
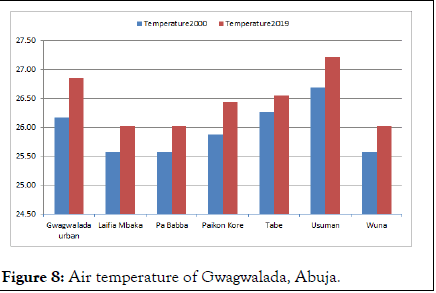
Figure 8: Air temperature of Gwagwalada, Abuja.
Urban heat island index
This approach looks at the heat island occurrence and evaluating city areas with nearby rural areas. In essence, the urban heat island index is air temperature urban substrate by air temperature rural. Table 1 shows the annual air temperature of Gwagwalada city and its rural or suburban environs, between 2000 as well as 2019 respectively (Tables 1 and 2).
| Data list | Data type | Data | Data source | Resolution |
|---|---|---|---|---|
| Landsat 7 | Secondary | Satellite imagery | Earth explorer | 30 m |
| Landsat 8 | Secondary | Satellite imagery | Earth explorer | 30 m |
| Temperature | Secondary | Climate data | Prediction of worldwide energy resources, NASA |
Table 1: Data types and sources.
| Towns | Temperature 2000 | Temperature 2019 |
|---|---|---|
| Gwagwalada urban | 26.17 | 26.86 |
| Laifia Mbaka | 25.58 | 26.02 |
| Pa Babba | 25.58 | 26.02 |
| Paikon Kore | 25.88 | 26.44 |
| Tabe | 26.27 | 26.56 |
| Usuman | 26.7 | 27.22 |
| Wuna | 25.58 | 26.02 |
Table 2: Air temperature of Gwagwalada, Abuja.
| Towns | Temperature 2000 | Temperature 2019 | Temperature difference |
|---|---|---|---|
| Gwagwalada urban | 26.17 | 26.86 | 0.69 |
| Laifia Mbaka | 25.58 | 26.02 | 0.44 |
| UHI | 0.59 | 0.84 | |
| Gwagwalada urban | 26.17 | 26.86 | 0.69 |
| Pa Babba | 25.58 | 26.02 | 0.44 |
| UHI | 0.59 | 0.84 | |
| Gwagwalada urban | 26.17 | 26.86 | 0.69 |
| Paikon Kore | 25.88 | 26.44 | 0.56 |
| UHI | 0.29 | 0.42 | |
| Gwagwalada urban | 26.17 | 26.86 | 0.69 |
| Tabe | 26.27 | 26.56 | 0.29 |
| UHI | 0.1 | 0.3 | |
| Gwagwalada urban | 26.17 | 26.86 | 0.69 |
| Usuman | 26.7 | 27.22 | 0.52 |
| UHI | 0.53 | 0.36 | |
| Gwagwalada urban | 26.17 | 26.86 | 0.69 |
| Wuna | 25.58 | 26.02 | 0.44 |
| UHI | 0.59 | 0.84 |
Table 3: Air temperature difference and UHI index of Gwagwalada, Abuja.
From the table, it can be said that the air temperature of Gwagwalada increased from 2000 to 2019 due to the increased intensity of solar radiation to the exposed environment. Most of the vegetation is lost due to man’s activities and construction of surface imperviousness, thereby making the environment to receive direct solar radiation. Greenhouse gas also contributed to the increase in air temperature, most of the carbons emitted to the environment through cars, generators, and so on.
Adaptation and mitigation strategies
From the analysis and findings, it is discovered that what gave rise to the increase in the temperature and urban heat island in Gwagwalada, Abuja was mainly increasing in urbanization, which brought congestion of the town and construction of surface impervious structures like tarred roads, buildings, and concrete walkways, thereby encouraging deforestation and greenhouse gas emissions.
The following are recommended for adaptation and mitigation of urban heat island within Gwagwalada, Abuja;
•Afforestation should be encouraged.
•Planting of vegetation like green grasses and trees along the streets and roads should be encouraged.
•Roofing of houses with green color coatings that will absorb the heat in the environment should be encouraged.
•The creation of water springs and fountains should be encouraged.
•The government should develop and encourage the use of biofuel to reduce the combustion of hydrocarbon, carbon monoxide, and carbon dioxide, which are greenhouse gasses.
•Awareness and enlightenment should be created on the effect of urban heat island on the environment.
This work studied the effect of an increase in temperature and the urban heat island of Gwagwalada, Abuja. Looking at the change detection of the area between 2001 and 2020, it was discovered that in 2001, vegetation occupied the highest area of the study area while buildup followed it and the water body also was higher, while rocks and bare surface occupied the least area. While in 2020, the buildup was more as a result of an increase in urbanization, followed by vegetation, bare surface, and rocks, while the water body is the least due to climate change effect. On NDVI, in 2001 normalize differential vegetation index ranged from 0.09 to -0.38 while in 2020 to increase to 0.37 to -0.05. This is attributed to the seasonal alterations, plant photosynthetic activity, biomass, plant as well as soil moisture, plant stress, etc.
The LST of Gwagwalada as of 2001 shows the temperature to range from 42.36 C to 24.35 C. While in 2020 it increased from 43.87ºC to 26.19 ºC, this is a result of the increase in urbanization, deforestation, surface imperviousness, and anthropogenic activities in the environment. It can be said that the air temperature of Gwagwalada increased from 2000 to 2019 due to the increased intensity of solar radiation to the exposed environment. Most of the vegetation is lost due to man’s activities and construction of surface imperviousness, thereby making the environment receive direct solar radiation. Greenhouse gas also contributed to the increase in air temperature, most of the carbons emitted to the environment through cars, generators, and so on.
In conclusion, from the analysis, it is estimated that the temperature of the study area will be increasing every year and may result in the discomfort of the people living in the study area. Mitigations and adaptations of urban heat island have been outlined in this research to further help in reducing the effect of the urban heat island.
The research reveals the consequence of the urban heat island of Gwagwalada, Abuja, and its surrounding suburbs and possible ways to mitigate and adapt to it. But most of the health implication of urban heat island was not looked at, so it calls for further researches into it.
The authors desire to recognize two organizations, the United States Geological Survey (USGS) as well as the Prediction of Worldwide Energy Resource (POWER) forgiven the data used for this research.
Citation: Agu CC, Ikwuka A, Hudu HM (2021) Environmental Impact Analysis on the Increase in Temperature and Urban Heat Island: A Case Study of Gwagwalada, Abuja. J Oceanogr Mar Res. S4: 006.
Received: 22-Nov-2021 Accepted: 06-Dec-2021 Published: 13-Dec-2021
Copyright: © 2021 Agu CC, et al. This is an open-access article distributed under the terms of the Creative Commons Attribution License, which permits unrestricted use, distribution, and reproduction in any medium, provided the original author and source are credited.