Journal of Oceanography and Marine Research
Open Access
ISSN: 2572-3103
ISSN: 2572-3103
Research Article - (2019)Volume 7, Issue 1
An environmental and geochemical investigation of 33 surficial sediments of the continental shelf north and north east of Lesvos Island Greece was undertaken to study the mineralogy and geochemistry of the sediments and understand the distribution and sources of various major and trace elements. Texturally all the sediments contain high amounts of mud and clay indicating a uniform facies at depths between 30m - 300m. The sediments are a mixture of terrigenous components (albite, K-feldspar, muscovite, quartz, illite, amphibole and biogenic components (calcite, Mgcalcite, aragonite). Pyrite and glauconite are ascribed to diagenesis. There are four distinctive groups of elements each of which includes related elements, derived from different natural sources on land or in the marine basin. The first group (Ca, Sr) reflects the biogenous carbonate fraction and is negatively correlated against every other element determined. A second (Si, Al, Fe, Na, K, Ti, Ba and Zr) group reflects the aluminosilicate minerals derived from the alteration of volcanic rocks, and a third group (Mg, Ni, Cr, C and Zn) reflects the aluminosilicate minerals derived from the alteration of ultrabasic rocks (peridotites) and the organic carbon. The group of Fe, Mn, Zn and Y is a diagenetic association reflecting the distribution of these elements with pyrite. The association of Cu with Zn reflects a mineralization control in the sediment area. Finally, La and Ce are associated with the K-bearing minerals, while P is related to K and Fe-finegrained minerals. The concentrations of heavy metals in the sediments are normal comparing to the contents of other AEGEAN SEA sediments and are due to natural lithogenic sources.
Sediment; Major and trace elements; Lesvos island; Aegean sea
It is known that the continental shelf represents a complex sedimentary environment. Various physical, geological and geochemical processes control sediment deposition in this environment.
The distribution of elements in shelf sediments is affected by several factors such as sedimentation rates which are much higher and physicochemical conditions which are quite different than those in the open ocean. Because the shelf sediments are also affected by recent tectonics they may therefore be composed of relict, reworked or recent sediments in various combinations.
The area of the Aegean Sea is geologically important as it lies along the boundary of the Eurasian and African Plates [1].
The Aegean Sea therefore provides an excellent basin model for sedimentation near the edge of an active orogenic region. Relatively few marine geological studies have been carried out of bottom sediments of the Aegean Sea and these have provided sparse information on the chemical composition of the sediments [2-4]. More information on the chemical composition of south Aegean Sea sediments has been reported by Smith & Cronan [5]. The first mineralogical – geochemical study of the Lesvos Sea sediments was that of Kelepertsis & Chatsidimitriadis [6]. They carried out a detailed mineralogical and geochemical study of recent bottom sediments from the Kalloni Gulf.
The area studied lies north of the northern coast of Lesvos Island (Figure l). Sampling of the marine sediments around Lesvos Island along the whole coast was carried out in the summer of 1987, together with the collection of geophysical data. For this purpose, 33 surficial unconsolidated sediment samples from water depths of 30 to 300m were collected using Van Veen or Dietz la Fond grab samplers (Figure 2).
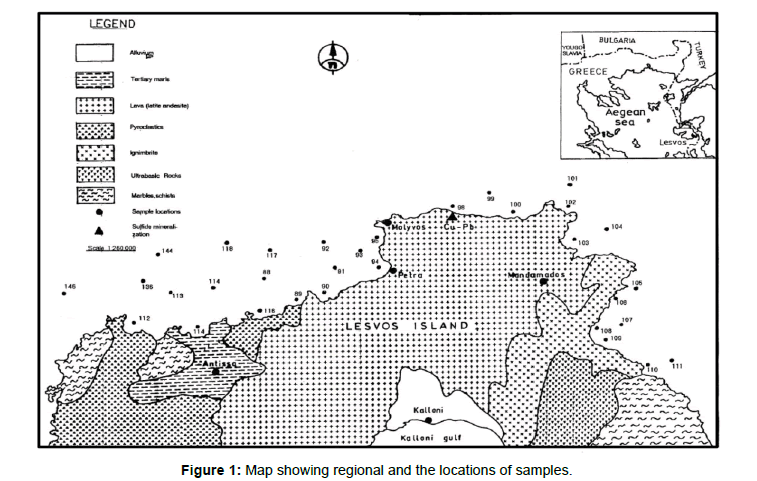
Figure 1. Map showing regional and the locations of samples.

Figure 2. Bathymatric map.
The object of this paper is to document and account for the grain size distribution whiles the clay mineralogy and the chemistry of Lesvos island sediments are also examined. In addition the sources and dispersal of elements and their partitioning between different mineral phases are investigated.
Geology of the northern land area
The following lithological units, in order of decreasing age, constitute the structure of Lesvos Island [7-9]:
(1) Autochthonous series (basement) consisting of metamorphic rocks;
(2) Volcanosedimentary series comprising volcanic rocks of various composition;
(3) Tectonic cover of Ophiolites;
(4) Meta-Alpine formation consisting of Neogene deposits and pyroclastics.
Volcanic rocks of andesitic composition outcrop along the north coast while Neogene
Marl deposits appear along the northwest coast of the island. Neogene sediments of mainly Miocene age consist of a mixed lithofacies of marls, tuffs, ignimbrites, limestones, sandstones and pyroclastic volcanic rocks [10]. In the same area small occurrences of the basement metamorphic rocks of palaeozoic age are encountered.
Granulometric analyses
Sediment texture is an important parameter in understanding the distribution of elements in the sediments. Granulometric analyses have been applied on all surface sediment samples using standard sieve techniques. The sediments consist of sands, muddy sands, and sandy muds, with each area having all these facies represented, but in slightly differing amounts [11]. The percentages of mud (silt + clay; -0.63 mm) are high (72.20-100%) excluding the value of 62.65 for the sample 88) in almost all the sediments studied. All the samples are fossiliferous with bioclasts and foraminiferal tests, gray in color and soft. The major constituents of the sand fraction are terrigenous and biogenic components. The former comprise mainly quartz, feldspar and the latter shell fragments and foraminiferal tests. The distribution of sand and mud fractions is shown in Figure 3.
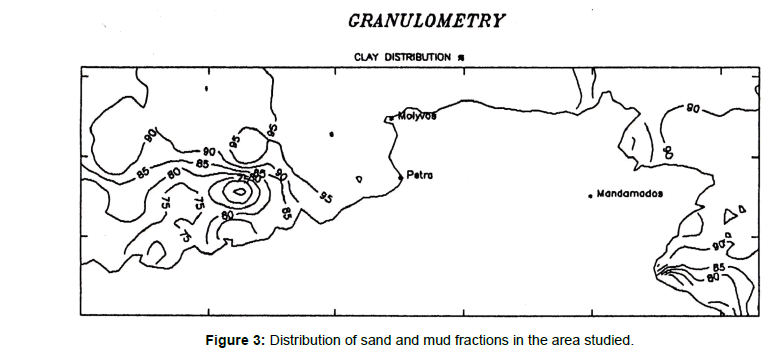
Figure 3. Distribution of sand and mud fractions in the area studied.
Laboratory Methods
Representative samples of the collection made at each station were washed salt free with distilled water, dried in an oven at 50'C and crushed to a fine grade for mineralogical and chemical analysis.
Mineralogical identification was made by X-ray powder diffraction analysis using a Philips diffractometer employing Cu-Ka radiation at the Department of Geology, Athens University. Small portions of the dried bulk sample powders were prepared for X-ray powder diffraction by grinding them with acetone and depositing the slurry on a glass plate. The mineralogy of the sediments is shown in Table l. The < 0.063 mm fraction of 6 samples was also analyzed by XRD for mineral identification. The minerals present and their amounts in each sample are shown in Table 2.
| Sample N Mineral | 88 | 89 | 90 | 91 | 92 | 93 | 94 | 95 | 96 | 97 | 98 | 99 | 100 | 101 | 102 | 103 | 104 | 105 | 106 | 107 | 108 | 109 | 110 | 111 | 112 | 113 | 114 | 115 | 116 | 117 | 118 | 136 | 144 |
| Quartz | X | X | X | X | X | X | X | X | X | X | X | X | X | X | X | X | X | X | X | X | X | X | - | X | X | X | X | X | X | X | X | X | X |
| Calcite | X | - | - | X | - | - | X | - | - | - | - | X | - | X | - | X | X | X | - | X | - | - | - | - | - | X | X | X | X | X | X | X | X |
| High-Mg Calcite | - | X | X | - | X | X | - | X | X | X | X | X | X | - | X | - | - | - | X | - | X | X | - | X | X | - | - | - | - | - | X | - | X |
| K-fcldspar | - | - | - | - | X | - | X | - | - | X | X | - | - | - | - | - | - | - | X | X | - | - | - | - | - | - | - | - | - | - | - | - | - |
| Albitc | X | X | X | X | X | X | X | X | X | X | X | X | X | X | X | X | X | X | X | X | X | X | - | X | X | X | X | X | X | X | X | X | X |
| Pyrite | X | X | X | X | X | X | X | X | X | X | X | - | - | X | X | X | X | X | X | X | X | X | - | X | X | X | X | X | X | X | X | X | X |
| Glauconite | - | - | - | - | - | - | - | X | X | X | X | - | - | - | - | - | - | -- | - | - | - | - | - | - | X | X | - | - | - | - | - | - | - |
| Muscovite | - | - | - | - | - | - | X | - | - | - | - | X | - | - | X | - | X | - | - | - | - | - | - | - | - | - | - | - | X | - | - | X | X |
| Illite | X | X | X | - | - | X | - | - | - | - | - | - | X | X | - | X | - | X | X | X | X | X | - | - | - | - | - | - | - | X | X | - | - |
| Aragonite | - | - | - | X | X | X | X | - | - | X | X | - | - | - | - | - | - | X | X | X | - | - | - | X | - | - | - | - | - | - | - | - | - |
| Ankerite | - | - | - | - | - | - | - | - | - | - | - | - | - | X | - | - | - | X | - | - | - | - | - | - | - | - | - | - | - | - | - | - | - |
| Amphibole | X | X | X | - | - | - | - | - | - | - | - | - | - | - | - | - | - | - | - | - | - | - | - | - | X | X | X | - | - | - | - | - | - |
Table 1: Mineralogical components identified by X-ray diffraction for the bottom sediments studied.
| Sample No Mineral | 89 | 97 | 101 | 103 | 105 | 116 |
|---|---|---|---|---|---|---|
| Feldspars | 65 | 60 | 35 | 5l | 55 | 5l |
| Muscovite | 26 | 30 | 55 | 42 | 30 | 35 |
| Quartz | 9 | l0 | l0 | 7 | l5 | 14 |
| Montmorillonite | trace | trace | trace | trace | trace | trace |
| Calcite | trace | trace | trace | trace | trace | trace |
Table 2: Mineralogical composition (%) of the < 0.063 mm fraction of 6 samples.
Quantitative chemical analyses of the elements SiO2, Al2O3, Fe2O3, MgO, CaO, Na2O, K2O, TiO2, P2O5 MnO2, Cr, Ba, Cu, Zn, Ni, Sr, La, Zr, Ce and Y were carried out by inductively coupled Ar plasma emission spectroscopy calibrated against international rock standards at the ACME ANALYTICAL LABORATORIES LTD., Vancouver, Canada. A weight of 0.2 gram of each sample is fused with 1.2 gram of LiBO3 and is dissolved in 100 ml 5% HNO3. Organic carbon determination was carried out by heating the samples in an oven at 450°C for I hour. Ignition loss was determined by heating the samples at 1000"C for two hours.
Mineralogy
The main minerals present are the carbonate minerals (calcite, Mg-calcite and occasionally aragonite), quartz, feldspars (albite, K-feldspar), muscovite, clay minerals (illite), glauconite, pyrite and traces of amphibole. Ankerite was detected in two samples (101, 105).
The following minerals were identified in the <0.063 mm fraction of the sediments (Table 2): albite, muscovite, quartz, illite and traces of calcite and montmorillonite.
The major part of this fraction consists of albite and muscovite while quartz is present in small amounts (5-13.6%).
Geochemistry
Concentration ranges of the chemical data (major elements as oxides) are shown in Table 3, while Table 4 depicts the correlation matrix. All elements display considerable ranges in concentration with excellent linear correlation between most elements. Four general groups of elements can be distinguished by their relative behavior using factor analysis.
| Element | Element Entire area (n=33) |
|---|---|
| CaCO3 (wt%) | 1.20- - 58.90 (25.43) |
| Corg | 1.90- - 10.37 ( 3.64) |
| SiO2 | 27.05- - 59.84 (44.10) |
| Al2O3 | 6.32- - 15.54 (12.00) |
| Fe2O3* | 2.25- - 5.75 ( 3.85) |
| MgO | 2.24- - 5.24 ( 3.40) |
| CaO | 3.77- - 27.59 (14.20) |
| Na2O | 1.66- - 3.58 ( 2.50) |
| K2O | 1.32- - 3.09 ( 2.20) |
| TiO2 | 0.32- - 0.77 ( 0.50) |
| P2O5 | 0.06- - 0.36 ( 0.15) |
| LOI | 5.60- - 35.50 (26.80) |
| Cr (ppm) | 14 - 291 (78) |
| Ba | 428 - 1405 (921) |
| Cu | 12 - 147 (33) |
| Zn | 33 - 85 (53) |
| Ni | 5 - 106 (40) |
| Sr | 497 - 1843 (1053) |
| La | 2 - 33 (10) |
| Zr | 71 - 212 (132) |
| Ce | 20 - 114 (45) |
| Y | 9 - 17 (12) |
Table 3: Ranges of chemical components and their averages (in parentheses).
| SiO2 | Al2O3 | Fe2O3 | MgO | CaO | Na2O | K2O | TiO2 | P2O5 | MnO | Cr | Ba | Cu | Zn | Ni | Sr | La | Zr | Ce | Y | |
|---|---|---|---|---|---|---|---|---|---|---|---|---|---|---|---|---|---|---|---|---|
| SiO2 | 1.00 | |||||||||||||||||||
| Al2O3 | 0.89 | 1.00 | ||||||||||||||||||
| Fe2O3 | 0.57 | 0.54 | 1.00 | |||||||||||||||||
| MgO | -0.29 | -0.27 | 0.18 | 1.00 | ||||||||||||||||
| CaO | -9.92 | -0.92 | -0.67 | 0.06 | 1.00 | |||||||||||||||
| Na2O | 0.73 | 0.72 | 0.06 | -0.56 | -0.591 | 1.00 | ||||||||||||||
| K2O | 0.62 | 0.59 | 0.19 | -0.59 | -0.550 | 0.54 | 1.00 | |||||||||||||
| TiO2 | 0.72 | 0.73 | 0.87 | 0.14 | -0.840 | 0.26 | 0.27 | 1.00 | ||||||||||||
| P2O5 | 0.44 | 0.32 | 0.46 | -0.25 | -0.340 | 0.13 | 0.45 | 0.35 | 1.00 | |||||||||||
| MnO | 0.24 | 0.29 | 0.62 | 0.33 | -0.28 | -0.19 | -0.02 | 0.43 | 0.25 | 1.00 | ||||||||||
| Cr | 0.02 | -0.12 | 0.01 | 0.52 | -0.12 | -0.12 | -0.26 | 0.04 | -0.44 | -0.05 | 1.00 | |||||||||
| Ba | 0.71 | 0.63 | 0.12 | -0.67 | -0.54 | 0.81 | 0.74 | 0.30 | 0.41 | -0.22 | -0.23 | 1.00 | ||||||||
| Cu | 0.01 | 0.21 | 0.25 | 0.09 | -0.20 | -0.07 | 0.01 | 0.24 | -0.02 | 0.32 | 0.07 | -0.11 | 1.00 | |||||||
| Zn | 0.10 | 0.28 | 0.65 | 0.52 | -0.41 | -0.27 | -0.13 | 0.60 | -0.01 | 0.53 | 0.20 | -036 | 0.51 | 1.00 | ||||||
| Ni | -0.15 | -0.11 | 0.20 | 0.69 | -0.12 | -0.42 | -0.34 | 0.17 | -0.44 | 0.22 | 0.77 | -0.54 | 0.35 | 0.62 | 1.00 | |||||
| Sr | -0.66 | -0.67 | -0.70 | 0.27 | 0.83 | -0.16 | -0.26 | -0.79 | -0.13 | -0.47 | -0.37 | -0.15 | -0.30 | -0.64 | -0.51 | 1.00 | 1.00 | |||
| La | 0.31 | 0.22 | 0.05 | -0.34 | -0.28 | 0.36 | 0.59 | 0.08 | 0.07 | -0.24 | -0.05 | 0.55 | -0.07 | -0.17 | -0.15 | -0.17 | 1.00 | |||
| Zr | 0.82 | 0.83 | 0.29 | -0.40 | -0.79 | 0.78 | 0.67 | 0.52 | 0.30 | -0.07 | -0.00 | 0.78 | 0.05 | -0.06 | 0.20 | -0.47 | 0.44 | 1.00 | ||
| Ce | 0.35 | 0.42 | 0.05 | -0.39 | -0.39 | 0.26 | 0.65 | 0.17 | 0.13 | -0.09 | 0.09 | 0.47 | 0.18 | 0.04 | 0.03 | -0.27 | 0.25 | 0.47 | 1.00 | |
| Y | 0.29 | 0.34 | 0.42 | 0.21 | -0.47 | 0.05 | 0.32 | 0.41 | 0.05 | 0.32 | 0.01 | -0.02 | -0.03 | 0.53 | 0.29 | -0.56 | 0.30 | 0.17 | 0.12 | 1.00 |
Table 4: Correlation coefficients (after log transformation).
The first group includes Ca and Sr which tend to be positively correlated between each other and negatively correlated against every other element determined. The correlation between Ca and Sr is very good (r=0.83).
A second group includes SiO2, Al2O3, Fe2O3, Na2O, K2O, TiO2, Ba and Zr. All elements in this group vary positively against each other to greater or lesser degrees (r=0.57-0.89).
A third group includes Fe20, MnO, Zn, Y (r= 0.42-0.65) and a fourth group consists of MgO, Cr, Ni, Zn and C (r= 0.52-0.69). The elements in both groups vary positively against each other to greater or lesser degrees.
Calcium and strontium
The sediments are moderately carbonate - rich with the majority of the samples containing l5-49% CaCO3: with an average of about 25%. Figure 4 shows that the highest concentrations of carbonate occur in the sea sector north of Molyvos and Arghenos and north west of Petra town. The CaO and Sr contents of these sediments are derived from skeletal components (identified in the sediments) and therefore are biogenic. Strontium in all aspects follows the distribution of CaO with which it is strongly correlated (r=0.83; Table 4).
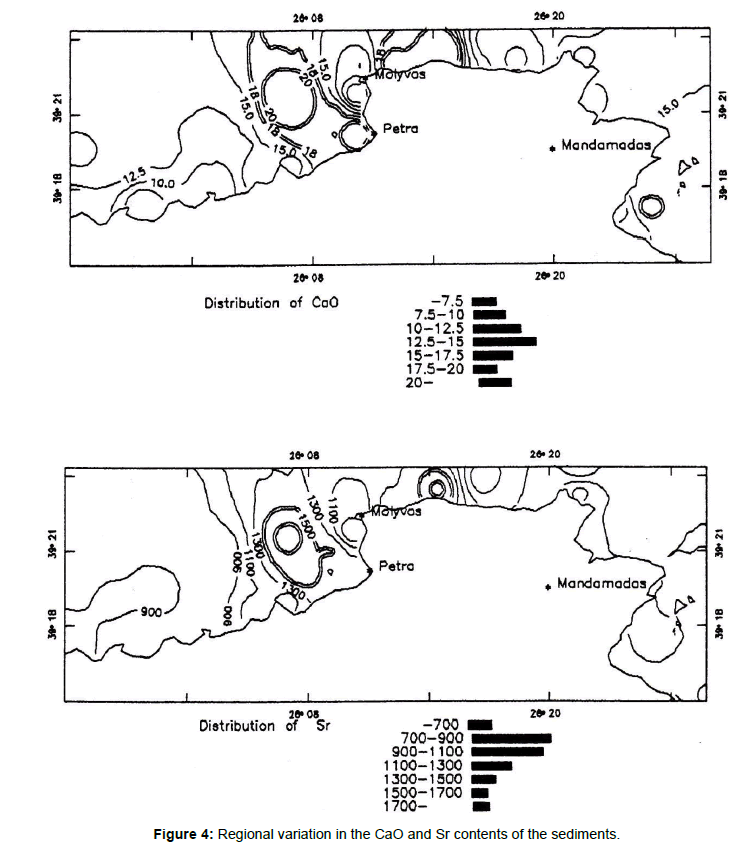
Figure 4. Regional variation in the CaO and Sr contents of the sediments.
The Sr contents of the sediments range between 715 and 1843 ppm, and the presence of aragonite is reflected in very high Sr concentrations in these sediments. A small CaCO3 proportion in the finer fraction of sediments is attribute to the degradation of shell parts of gastropods, lamellibranchs and tests of foraminifera which are seen in the coarse fraction.
Silicon, aluminum, iron, sodium, potassium, titanium, barium and zirconium
This group includes elements which are positively intercorrelated and are associated with illite, muscovite, glauconite and feldspars. The inverse correlation of this association to Ca and Sr reflects the presence of carbonate fraction forming the shells of marine organisms. Figure 5 shows the geographical distribution of the elements of this group.
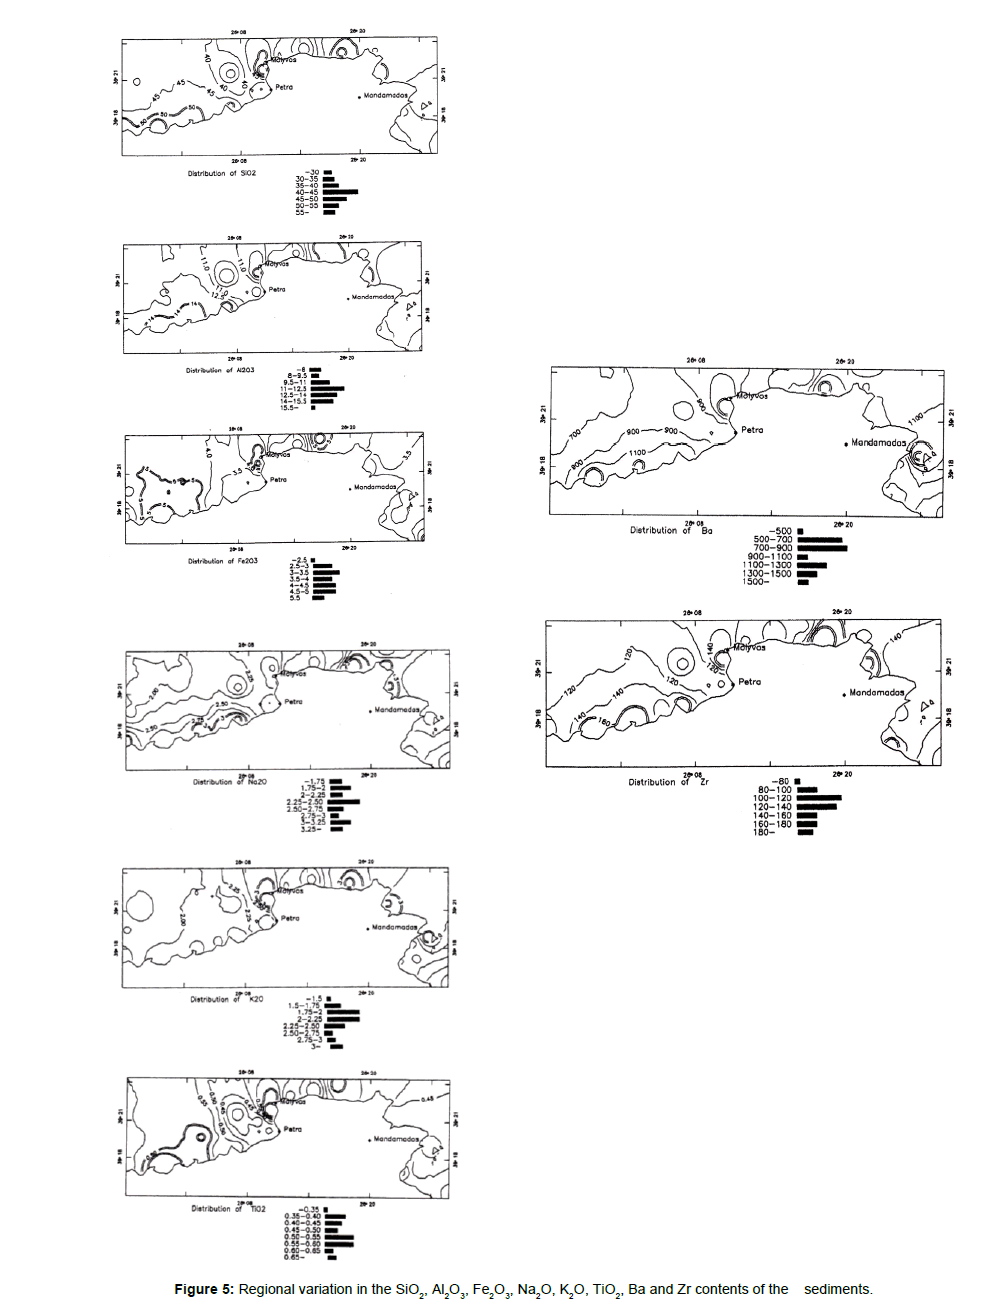
Figure 5. Regional variation in the SiO2, Al2O3, Fe2O3, Na2O, K2O, TiO2, Ba and Zr contents of the sediments.
According to Deer et al. Ti is usually associated with elements with octahedral coordination [12]. Within the clay structures Ti4+ substitutes for Al+3 and according to Bostrom et al. both these elements are terrigenous [13]. The correlation between Ti and Al is high (r= 0.73) and according to Bostrom the Al/Ti ratio indicates the source material [14]. A high ratio (near 20) suggests a terrigenous source, while weathering products of average oceanic rock should have low Al/Ti ratios around 5. The Al/Ti ratios for the sediments studied are around 20 which means a dominantly terrigenous source. A small fraction of TiO2 is also associated with the opaque minerals ilmenite and rutile which have been identified in the heavy fraction of the Mytilini bottom sediments. According to Goldberg & Arrhenius, TiO2 occurs as anatase and rutile in pelagic clays [15]. The proportion of Si is controlled primarily by the aluminosilicates and only secondarily by the silica minerals (quartz).
Medium positive correlation (r=0.54) of Fe2O3 with Al2O3, Table 4 suggests that a proportion of Fe is associated with the clay minerals and other detrital minerals. According to Hirst, Fe in clays is present as isomorphous substitution of Fe2+ and Fe3+ for Mg2+ or Al3+ in the crystal lattices. The second source of Fe in these sediments is the iron sulphide and glauconite [16].
The Ba, K, Na association is attributed to illite, muscovite, albite and K-feldspar contents. The close association of Ba with K2O reflects its ability to substitute for K in feldspars, muscovite and illite [17].
Zr occurs in clay minerals, muscovite and feldspars. It substitutes for Al in the octahedral sites of clays and feldspars [18]. Minor contribution from heavy minerals such as Zircon may account for the higher values of Zr in some samples.
Iron, manganese, zinc and yttrium
The distribution of Fe shows three nearshore areas of enhanced concentration (Figure 6). This can be readily explained as the result of influx of iron-rich clastic sediments and iron oxides/hydroxides derived from the andesitic rocks of the adjacent land areas. Some of the iron may also be derived from Fe-rich solutions associated with submarine volcanic exhalation, fumaroles, land and with submarine thermal springs and hot grounds are well-known for the area. Pyrite is present as an authigenic mineral in all the samples studied; it is most likely formed by the bacterial decay of organic matter under reducing conditions.
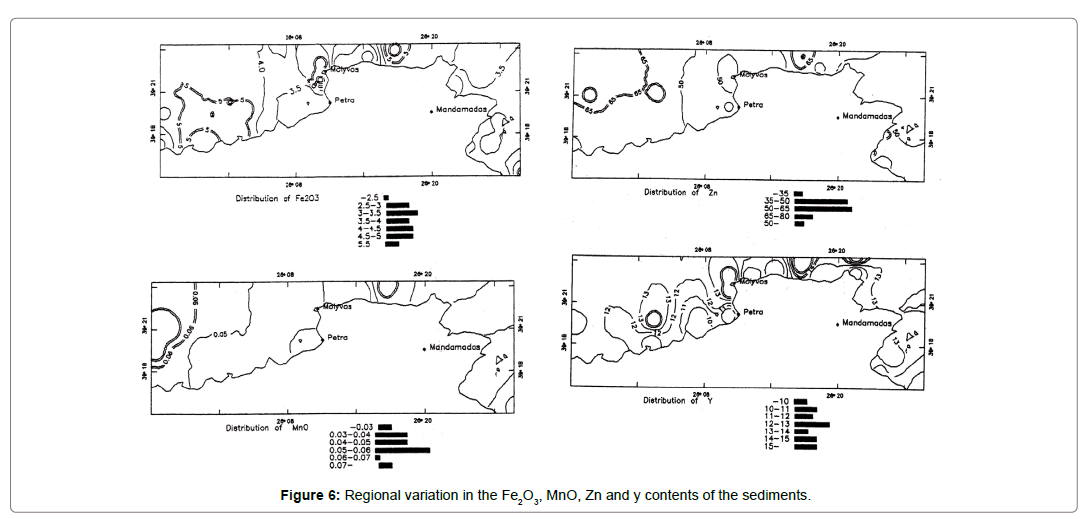
Figure 6. Regional variation in the Fe2O3, MnO, Zn and y contents of the sediments.
Positive correlation of Mn, Zn with Fe suggests that Mn and Zn can be present in pyrite in the form of admixtures of other minerals or in solid solutions with pyrite [12]. The second source of Zn in these sediments is the ferromagnesian minerals (amphibole), since a positive correlation (r=0.52) exists between Zn and Mg contents. A weak correlation exists between Y and Fe2O3 contents suggesting its association with Fe-bearing minerals.
Magnesium, chromium, nickel zinc and organic carbon
The close association of these elements in the sediments studied may be interpreted as reflecting the input of clastic sediments derived from the weathering of basic and ultrabasic rocks. Figure 7 shows that Mg, Cr and Ni are higher in samples from the north and north-east coast of the island and this is consistent with the geology of the adjacent island land (andesites and ultrabasic rocks). According to Goldschmidt both Mg and Ni occur in smectites [19]. Within the smectite structure Ni2+ substitutes for Mg2+ in the octahedral sites.
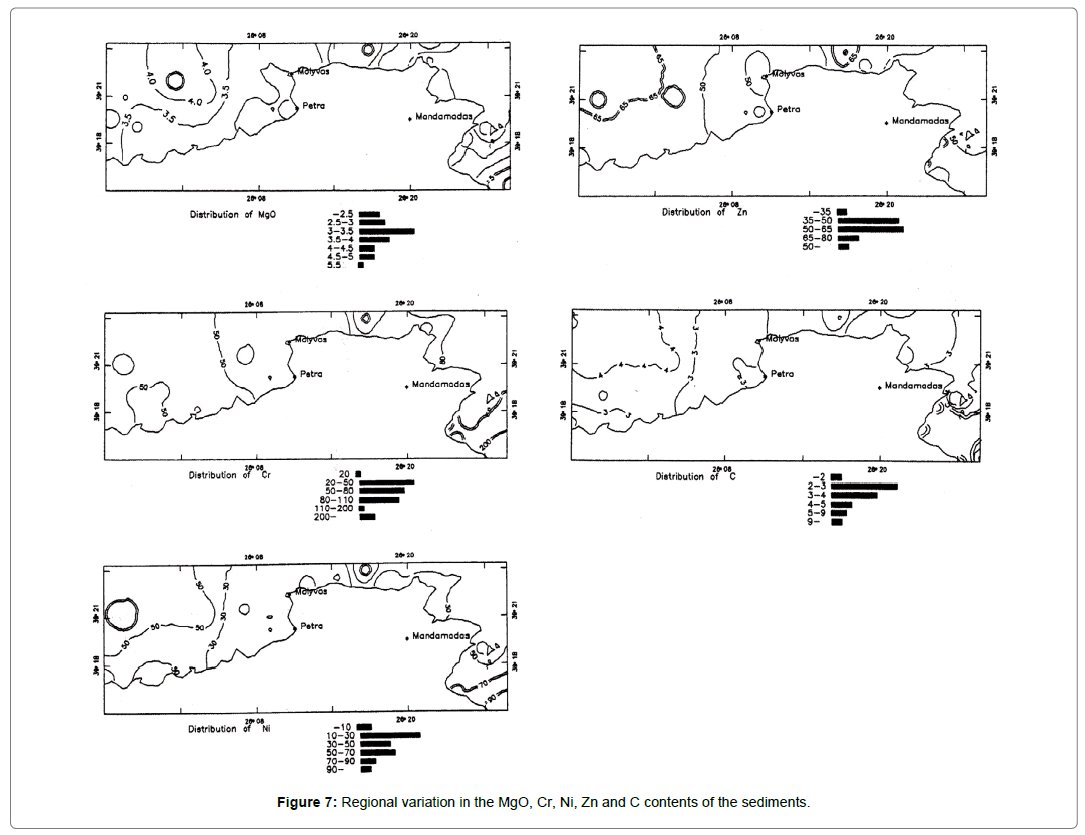
Figure 7. Regional variation in the MgO, Cr, Ni, Zn and C contents of the sediments.
From Table 3 it is apparent that the sediments are enriched in Mg compared with "average shales" which reflects the input of clastic sediments derived from basic and ultrabasic rocks [20]. However, the interpretation of the higher Mg contents is complicated by the presence of skeletal Mg-calcite in some of these sediments.
The area most enriched in organic carbon is the marine region southeast of Madamados village (Figure 7). The higher organic carbon contents in this area could be attributed to the higher productivity of overlying waters, preservation of deposited organic matter by finegrained nature of the sediments and similarity in the settling velocity of fine-grained sediments and organic matter. In addition to these factors, the enrichment of organic carbon in the entire area studied results in a strong reducing environment and subsequent preservation of organic matter occurring at the same time as the formation of iron sulphide.
Phosphorous
The P2O5 contents in the sediments studied range between 0.06 and 0.36% with a mean value of 0.16% which is in accordance with the value of 0.15% for the average shale [21]. Positive correlations exist between P2O5 and K2O / Fe2O3 contents (Table 4) suggesting that it is associated with K2O and Fe2O3 fine grained minerals, being absorbed on them. In the reducing environment of the oxygen minimum zone the interstitial waters get enriched in phosphate content by anaerobic destruction of organic material. According to JITTS, the silts are capable of adsorbing very large quantities of phosphate [22].
Lanthanum and cerium
The major distribution of La and Ce is controlled by the presence of K-feldspars, muscovite and illite since a good positive correlation exists between La, Ce and K2O contents (r= 0.59 and 0.65 respectively).
Copper and zinc
Figure 8 shows two areas of elevated copper concentrations and two areas of highest zinc concentrations. A medium correlation exists between copper and zinc contents suggesting that both elements are associated in a mixed sulfide mineralization. The zinc anomaly (A) is related to known onshore mineralized rocks while the second one (B) may be related to submarine sulfide mineralization. The zinc anomaly (B) coincides with the copper anomaly (B).
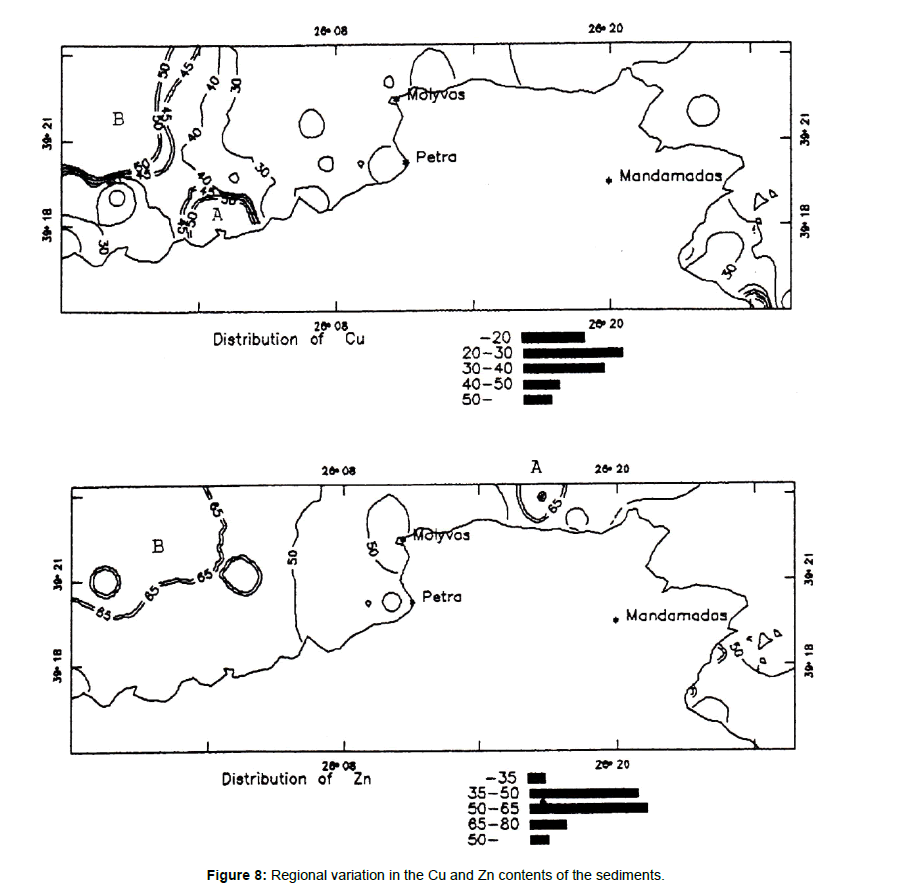
Figure 8. Regional variation in the Cu and Zn contents of the sediments.
In comparison with other geochemical studies in the Mediterranean, in the Aegean Sea, and with "average shale-geochemistry" the chemical composition of the sediments studied has been recalculated on a calcium carbonate-free basis (Table 5). The Lesvos bottom sediments are characterized by their high concentrations of Sr and Ba, while Mn, Ni, Zn contents are lower than those in the other average sediments. The average Cr content in the average Lesvos sediment is lower than that in the Aegean and Cilicia basin but higher than in the "average shale". The Cu concentration is approximately similar to the mean of the other sediments in Table 5. The La contents of the Lesvos sediment are lower than those of the average shale while Zr and Ce contents are approximately the same.
| 1 (N=33) | 2 | 3 | 4 (N=98) | |
|---|---|---|---|---|
| CaCO3 % | 25.43 | 65.3 | - | 35.6 |
| Ca % | 10.17 | 26.13 | 2.21 | 14.42 |
| Mg % | 2.05 | 1.82 | 1.5 | 2.95 |
| Al % | 8.47 | 4.87 | 8 | 7.98 |
| Ti % | 0.42 | 0.33 | 0.46 | 0.43 |
| Fe % | 3.61 | 3.53 | 4.72 | 5.72 |
| Na % | 2.44 | - | 0.96 | - |
| K % | 2.37 | - | 2.57 | - |
| Si % | 27.61 | - | 27.15 | - |
| P (ppm) | 936 | - | 700 | - |
| Mn (ppm) | 415 | 783 | 850 | 1679 |
| Ni (ppm) | 54 | 17 | 68 | 269 |
| Cr (ppm) | 106 | 137 | 90 | 457 |
| Cu (ppm) | 44 | 37 | 45 | 56 |
| Zn (ppm) | 71 | 93 | 95 | 117 |
| Ba (ppm) | 1234 | - | 580 | - |
| Sr (ppm) | 1412 | - | 300 | 611 |
| Y (ppm) | 16 | - | 26 | - |
| Zr (ppm) | 177 | - | 160 | - |
| La (ppm) | 13 | - | 92 | - |
| Ce (ppm) | 62 | - | 59 | - |
| Table heading: 1= Present study sediments; 2= Aegean Sea (SMITH and CRONAN, 1975); 3= Average shale (TUREKIAN and WEDEPOHL, 1961); 4= Cicilia basin sediments, northeast Mediterranean (SHAW and BUSH, 1978);- = no analysis | ||||
Table 5: Average compositions of marine sediments north of Lesvos island on a carbonate - free basis, average element abundances reported for other continentalshelf sediments, and average shale.
The shallow-water shelf sediments of the south Aegean sea do show some similarities in major element chemical composition with the bottom sediments of the sea north of Lesvos Island [5]. The main difference between them is the higher carbonate and the lower Al% content in the south Aegean sediment. There are not any major differences between the average contents of Al, Ti, Fe, K, Si, and P in the Lesvos bottom sediments and the "average shale" the only exception being the higher Na content in the Lesvos sediment which is due to the albite presence.
The mineralogical and chemical composition of the Lesvos bottom sediments described above suggest that they are admixtures of biogenous debris poor in trace elements and terrigenous material of variable composition. Correlation analysis indicates that the variation of the chemical data of the Lesvos marine sediments can be explained by a few controls depending firstly on provenance and secondly on diagenesis. Provenance controls the types of minerals and organic debris which comprise the sediments. Environment of deposition regulates the relative proportions of biogenic and terrigenous material, and the grain size. Major and trace element composition of sediments may vary with mineralogy and organic matter content [23]. The sedimentary cycle of weathering, physical and chemical erosion, deposition, diagenesis and ultimately lithification involves a spectrum of chemical and physical processes which can be conveniently considered in terms of source effects, processes, that occur during transport and deposition, and post-depositional processes [24-27].
In the case of the Lesvos offshore sediments the high and almost constant mud (<0.063 mm) content suggests a uniform environment of water deposition. So, the variation in the chemical composition of the sediments is not expected due to depositional regime. The "carbonate" factor accounts for the association of Ca and Sr, a second "aluminosilicate control" accounts for the association of Si, Al, Fe, Na, K, Ti, Ba and Zr, and a third "ultrabasic control" accounts for the association of Mg, Ni, Cr, C and Zn.
The association of Fe, Mn, Zn and Y and the presence of pyrite in all sediments studied is considered a diagenetic factor. The association of Cu with Zn may be considered as "a mineralization-source control", since mineralized volcanic rocks (Cu, Zn, Pb) are known in the adjacent land of Lesvos near the coast of Arghenos area (Figure 1). The Cu and Zn have been derived either from chemical weathering of the onshore mineralization and transported along the coast within the marine basin or from submarine Cu-Zn-Pb mineralization [28-30]. The reconnaissance of the geochemical anomalies of Cu and Zn in the basin sediments north of Lesvos Island suggests that marine sedimentologic - sedimentary geochemical research may be useful in applied geochemistry, for locating hidden mineral deposits of economic significance.
We thank the Marine Geology Department of I.G.M.E for providing the samples studied after previous permission of the General Director of I.G.M.E.
Citation: Kelepertsis A, Andrinopoulos A (2019) Environmental Research and Geochemical Evaluation of Recent Bottom Sea Sediments North and North –East of Lesvos Island, Greece. J Oceanogr Mar Res 7:188. doi: 10.35248/2572-3103.19.7.188
Received: 14-Jan-2019 Accepted: 05-Feb-2019 Published: 12-Feb-2019 , DOI: 10.35248/2572-3103.19.7.188
Copyright: © 2019 Kelepertsis A, et al. This is an open-access article distributed under the terms of the Creative Commons Attribution License, which permits unrestricted use, distribution, and reproduction in any medium, provided the original author and source are credited.