Clinical Pediatrics: Open Access
Open Access
ISSN: 2572-0775
ISSN: 2572-0775
Research - (2019)Volume 4, Issue 3
Introduction: Autistic Spectrum Disorder (ASD) is increasing in across USA. Paediatricians and physicians in both Colorado and Australia continue to see high caseloads however this prevalence uptick remains largely unexplained. Since drug use is an obvious potential source of developmental brain damage the present study was undertaken to
study drug-ASD associations at state level.
Methods: Existing datasets from the US Department of Education Individuals with Disabilities Act, the Substance Abuse and Mental Health Services Administration National Survey of Drug Use and Health, and the Drug Enforcement Agency cannabinoid concentration in seizures were re-analyzed.
Results: ASD rates are high and rising fastest in Colorado, Maine, Massachusetts, Oregon, Rhode Island and New Jersey but falling in Oklahoma and Iowa. When the nine highest cannabis use states are grouped together ASD is rising significantly faster there than elsewhere (time:status interaction in quadratic mixed effects model p<0.0001). On univariate regression ASD rate was significantly positively associated with alcohol and cannabis exposure and with the cannabinoids Δ9-tetrahydrocannabinol, cannabinol, cannabichromene, cannabigerol and tetrahydrocannabivarin. These effects remained after multivariate adjustment for Δ9-tetrahydrocannabinol and cannabidiol (from p<0.0001). Cannabidiol correlated with ASD rate when a three year lag was introduced (R=0.7483, p=0.0032).
Conclusion: These data show that increased cannabinoid exposure explains on bivariate and multivariate regression much of the recent rise in ASD across USA, and in the context of other reports, also at some local cluster levels. Together with numerous mechanistic reports these data argue for causality and indicate a large case-control study.
ASD-like neurobehavioural toxicological syndromes likely represent the commonest form of cannabis-related teratology following peri-gestational exposure.
Cannabis; Opioids; Cannabidiol; Cannabinol; Tetrahydrocannabinol; Autism spectrum disorder
ASD: Autism Spectrum Disorder; CB1R: Cannabinoid type 1 receptor; DEA: Drug Enforcement Agency; IDEA: US Department of Education Individuals with Disabilities Act; NSDUH: National Survey of Drug Use and Health; Robo: Roundabout, a guidance molecule receptor for axonal growth cones and arterial endothelial tips; SAMHSA: Substance Abuse and Mental Health Services Administration; Slit: Slits 1-3, arterial and axonal guidance molecule and ligand for Robo; +: An additive operator for regression calculations; ~: Tilde, a middle sign separating the two sides of a regression calculation; *: Asterisk, an operator used in regression calculations to include additive and interactive relationships
Autistic spectrum disorder (ASD) is one of the commonest development abnormalities of children affecting a mean of 1.68% of 8 year old boys across USA and up to 4.5% of 8 year old boys in New Jersey [1]. Surveys show substantial rates of rise in ASD incidence of 20% over two years in New Jersey and 30% in Colorado. Indeed a recent bill was placed before the Colorado House of Representatives to have autism declared a state of emergency in various Colorado counties [2].
Whilst many previous epidemiological studies have been conducted the cause/s remain largely elusive. Higher socioeconomic status, having a previous autistic child, advanced parental age, gestational inflammation, twin associations, diabetes, bleeding and drugs [3-5] including cannabinoids [6,7] have been previously implicated.
Three of three longitudinal studies of cannabis use have confirmed impairments of executive and cortical functioning and ADHDand autistic- like cognitive deficits following Prenatal Cannabis Exposure (PCE) [8-11]. This compelling prospective evidence would appear to place an epidemiological and mechanistic link between ASD and cannabinoid consumption on a firm scientific foundation.
A large Hawaiian study of 300,000 deliveries found 21 major birth defects were elevated after PCE [12]. Since ASD is commoner than the commonest of these defects, and since neurobehavioural toxicology is likely to be a power (squared) or pseudo-exponential function of exposure to multiple cannabinoids, in the context of rising cannabinoid use, rising Δ9-tetrahydrocannabinol concentrations, and cannabinoids now entering the US food chain, it would appear that ASD-like neurobehavioural toxicology will increasingly become the leading manifestation of increased gestational cannabinoid exposure. In 2017 161,000 women in USA used cannabis whilst pregnant; and for 69,000 use was near-daily [13].
Many reports of cannabinoid toxicology and genotoxicity suggest an asymptotic (steeply rising) pseudo-exponential (mimicking an exponential rise) dose-response relationship [14-18]. The implications of this on neurobehavioural neurotoxicology and general toxicology may prove to be most profound as the population moves into a higher cannabis use paradigm.
It is important to note that cannabinoids have been shown previously to be involved in numerous pathways impacting brain development so that many molecular, cellular and neurodevelopmental links between cannabinoid exposure and brain pathology have been described. Potential mechanisms by which cannabinoids could impact brain development and function relevant to ASD expression are manyfold and have been reviewed elsewhere [8,19-23] and this is briefly summarized here. Cannabinoids negatively affect neurogenesis a process critically important in the developing brain for the long distance migration of human neocortical neurons and the formation of the large and exuberant human cortex [24,25]. By interfering with the formation of actin and tubulin which forms the microtubules of the mitotic spindle THC interferes with cell division [21]. THC interferes with notch signalling [26,27] which is a key body morphogen and especially important for brain and heart morphogenesis [28-31]. The endocannabinoid system is a key regulator of synaptogenesis [32,33]. The neurexin-neuroligin scaffolding pair is a key transsynaptic membrane complex governing synapse development and stabilization which is impeded by exogenous phytocannabinoids [34]. Cannabinoids affect immune and microglial function and thus synaptic pruning and ability to focus, concentrate and learn from experience [35]. Cannabinoids interfere with stathmin which is a key molecular pathfinder for growth cone steering and guidance [36] and has also been shown to be involved with synaptogenesis, neurogenesis and NMDA dependent memory [37].
The ratio of the guidance molecules slit to robo has been shown to be a key regulator of human and mammalian cortical development and diverts foetal subventricular neurogenesis from a small-capacity direct pathway to a slower but more prolific indirect pathway and is immediately responsible for the large human neocortex [25]. This ratio is adversely affected by cannabinoids [24]. Slit/Robo also guide axons [24]. Mitochondria carry a full complement of endocannabinoid signalling machinery [38,39] and not only generate the energy for DNA protection and maintenance but also signal directly to the nuclear genome by several metabolic pathways and shuttles [40] and are impeded by cannabinoids [16-18, 41- 43] in a manner which directly interferes with major neuronal functions including signalling and memory [38,39]. Acting via type 1 endocannabinoid receptors (CB1R’s) cannabinoids are proinflammatory [44,45] which negatively impacts neurogenesis [19,38,46-48]. Cannabinoids can have deleterious effects on macro and micro-vasculature and the stem cell niches to which they contribute [49-52]. Negative effects have been documented on both sperm [53-56] and ova [57]. Foetal alcohol syndrome is known to act epigenetically in part via CB1R’s [58]. Exogeneous cannabinoids are also known to suppress the cortical oscillations which are increasingly being understood to be fundamental to many cortical functions [59].
Finally cannabinoids including small doses of Δ9- tetrahydrocannabinol, cannabidiol, cannabichromene and cannabidivarin are known to have substantial epigenetic effects [60-63] a finding which achieves particular significance in the light of the large literature on the epigenetic aetiopathogenesis of ASD [64,65].
Since the USA regularly surveys drug use in a nationally representative sample [13] and is undergoing a period of social change in relation to the use of cannabis and other drugs we investigated the extent to which extant epidemiological evidence of drug and cannabinoid use were associated with ASD incidence at the ecological level. Since the link between cannabinoid use and ASD-like syndromes has already been established by prior work, we limited ourselves to a consideration of the extent to which this previously demonstrated link might be reflected in currently available national datasets. Whilst it is not possible to demonstrate causality in an ecological-associational level study in the interpretation of our findings we gave careful consideration to the relationship between our results and the criteria of causality as outlined by Bradford Hill in 1965 [66].
Data sources
Data on the US National Database from the US Department of Education Individuals with Disabilities Act (IDEA) was used [67]. Data on state level use of various addictive drugs were sourced from the Substance Abuse and Mental Health Administration (SAMHSA) National Survey of Drug Use and Health (NSDUH) including shapefiles and SAS database files [13]. Data on cannabinoid concentration of US Drug Enforcement Agency (DEA) Seizures were from published sources [68,69]. State based levels of individual cannabinoids were derived by multiplying the monthly cannabis use by the Federal concentration of each cannabinoid separately.
Statistics
Data were analyzed in “R” from Central R Archive Network version 3.5.2 and R Studio 1.1.463 2018. Parameters were log transformed to optimize normality assumptions where appropriate. Models were compared using analysis of variance procedures. Time was not transformed. Full regression models were reduced following the classical procedure of elimination of the least significant term. Maps and graphs were plotted in ggplot2. Bivariate maps were drawn using colorplaner 0.1.4. Time series analysis was performed with the stats package. Two-tailed t-tests of statistical significance were used throughout. P<0.05 was considered significant.
Ethics
These studies were approved by the Human Research Ethics Committees of Southcity 7-Day Family Medical Centre in Brisbane, Australia and the University of Western Australia in Crawley, Perth, Western Australia.
Data from the IDEA database were combined with SAMHSA NSDUH and DEA published data on levels of cannabinoid concentration identified in Federal seizures of drugs to analyze the relationship between autism rates and drug use at US state level [13,67-69].
Figure 1: A shows a map of US states by rates of last month cannabis consumption, Figure 1B shows a US state-based map of ASD rates, and Figure 1C shows a bivariate colorplane map of both parameters together on the same plot. Purple shading in Figure 1C indicates that both last month cannabis use and autism are high in California.
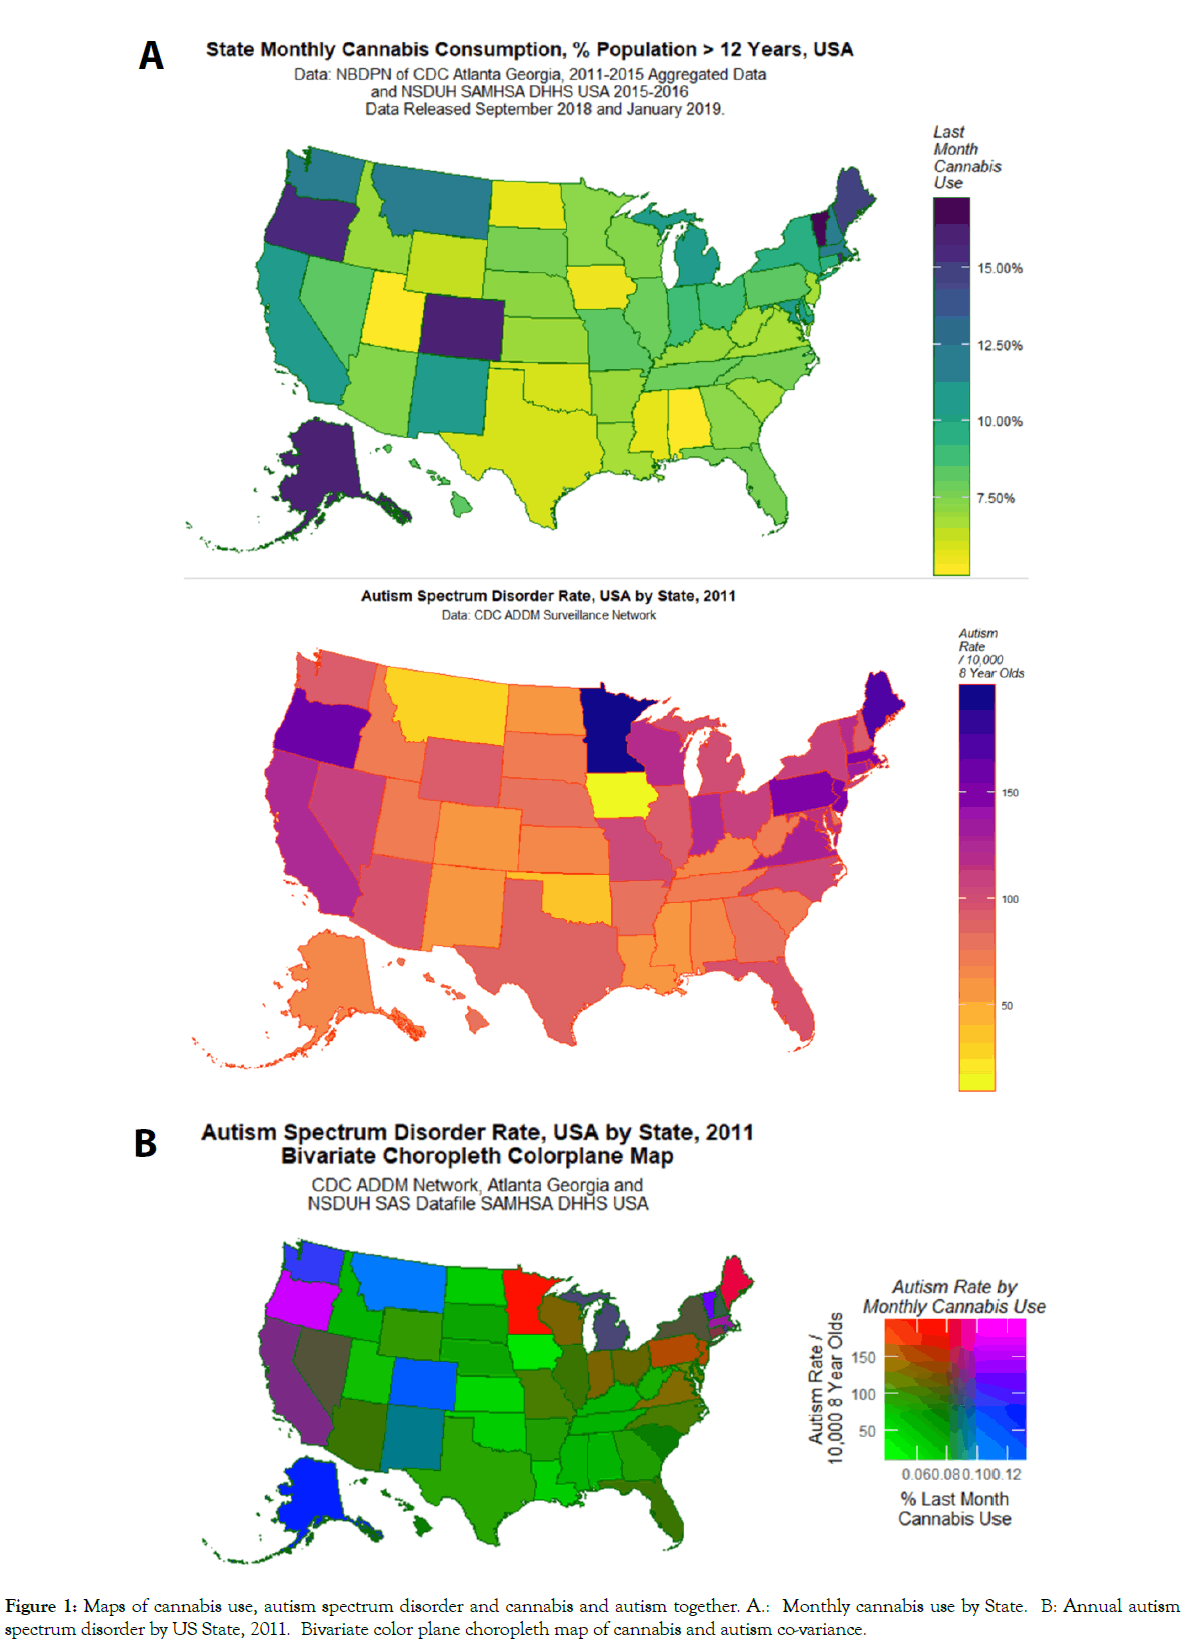
Figure 1: Maps of cannabis use, autism spectrum disorder and cannabis and autism together. A.: Monthly cannabis use by State. B: Annual autism spectrum disorder by US State, 2011. Bivariate color plane choropleth map of cannabis and autism co-variance.
Supplementary Figures 1A and B shows the rate of ASD in 25 and 26 states respectively.
Figure 2 shows the published concentration of seven different cannabinoids over time in Federal seizures at the national level [68,69].
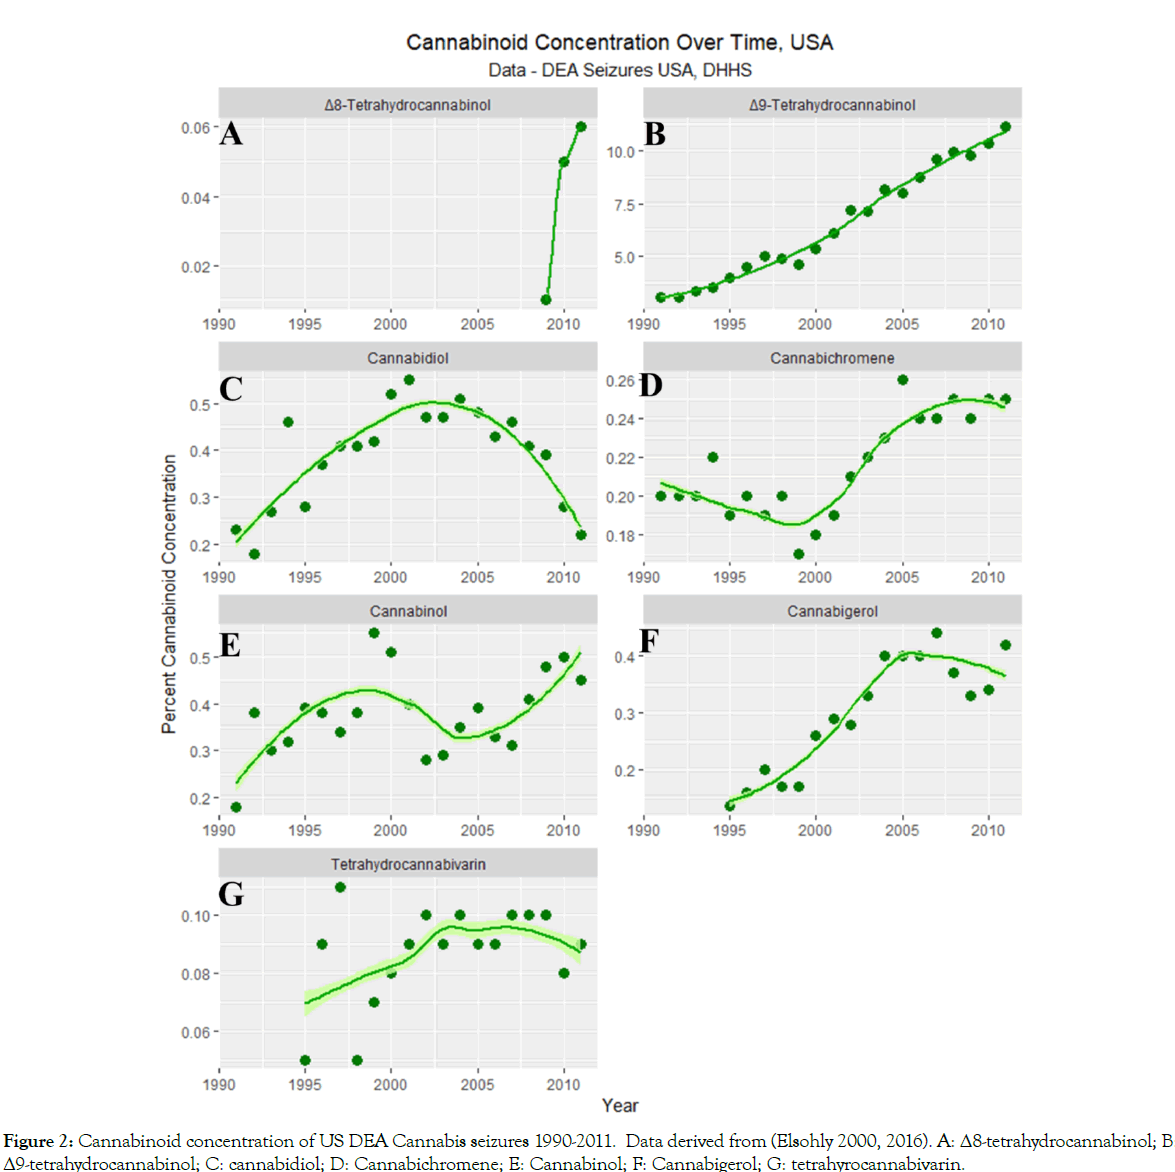
Figure 2:Cannabinoid concentration of US DEA Cannabis seizures 1990-2011. Data derived from (Elsohly 2000, 2016). A: Δ8-tetrahydrocannabinol; B: Δ9-tetrahydrocannabinol; C: cannabidiol; D: Cannabichromene; E: Cannabinol; F: Cannabigerol; G: tetrahyrocannabivarin.
Figures 3 and 4 illustrate the rates of ASD in 25 and 26 states respectively. The data have been split into two sets to assist with over plotting. A combined plot appears as Supplementary Figure 2. Figure 4 shows high levels of ASD in Minnesota, Colorado, Maine and Massachusetts and low and decreasing levels in Iowa. Figure 5 shows high ASD levels in Oregon, Rhode Island and New Jersey but low and flattening out levels in Oklahoma.
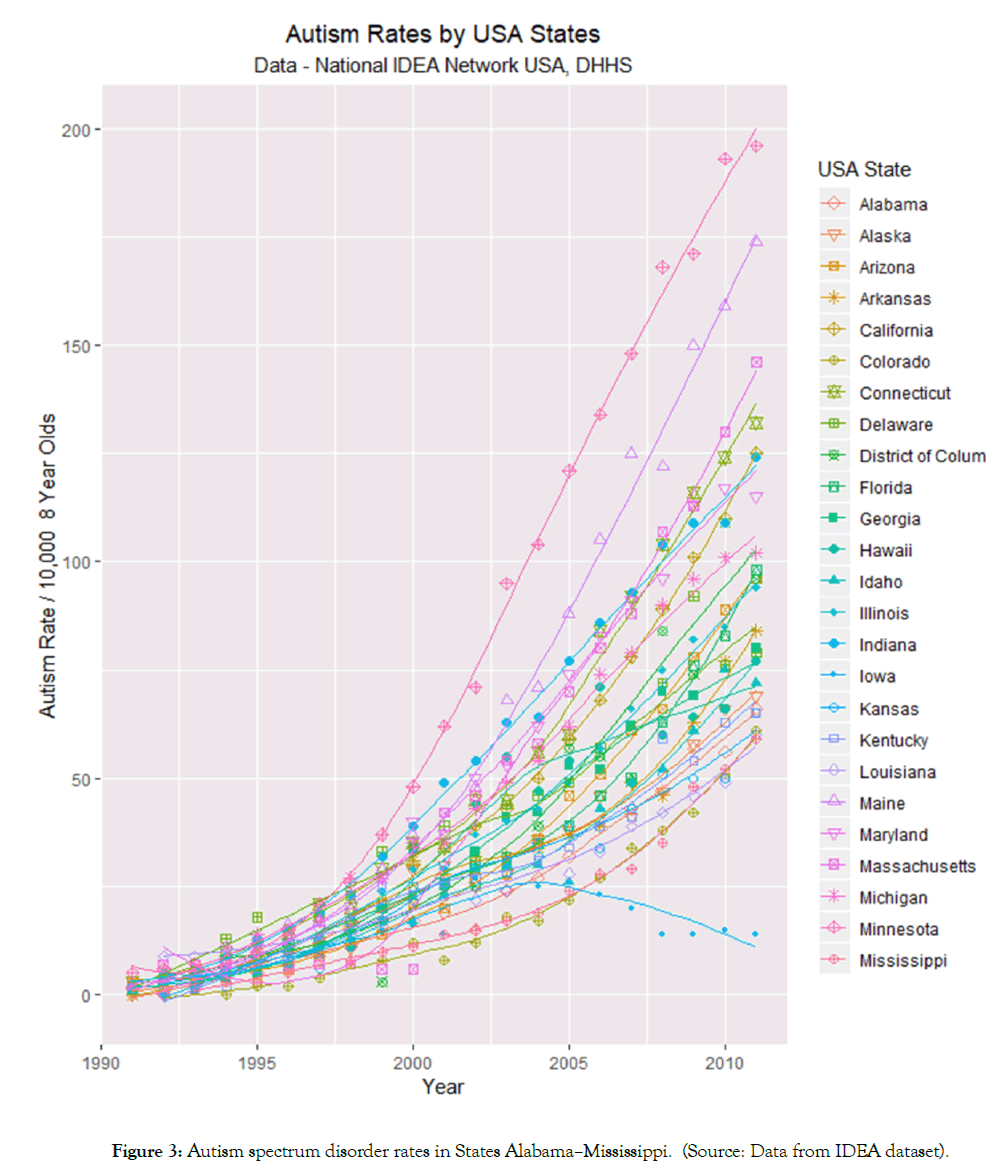
Figure 3: Autism spectrum disorder rates in States Alabama–Mississippi. (Source: Data from IDEA dataset).
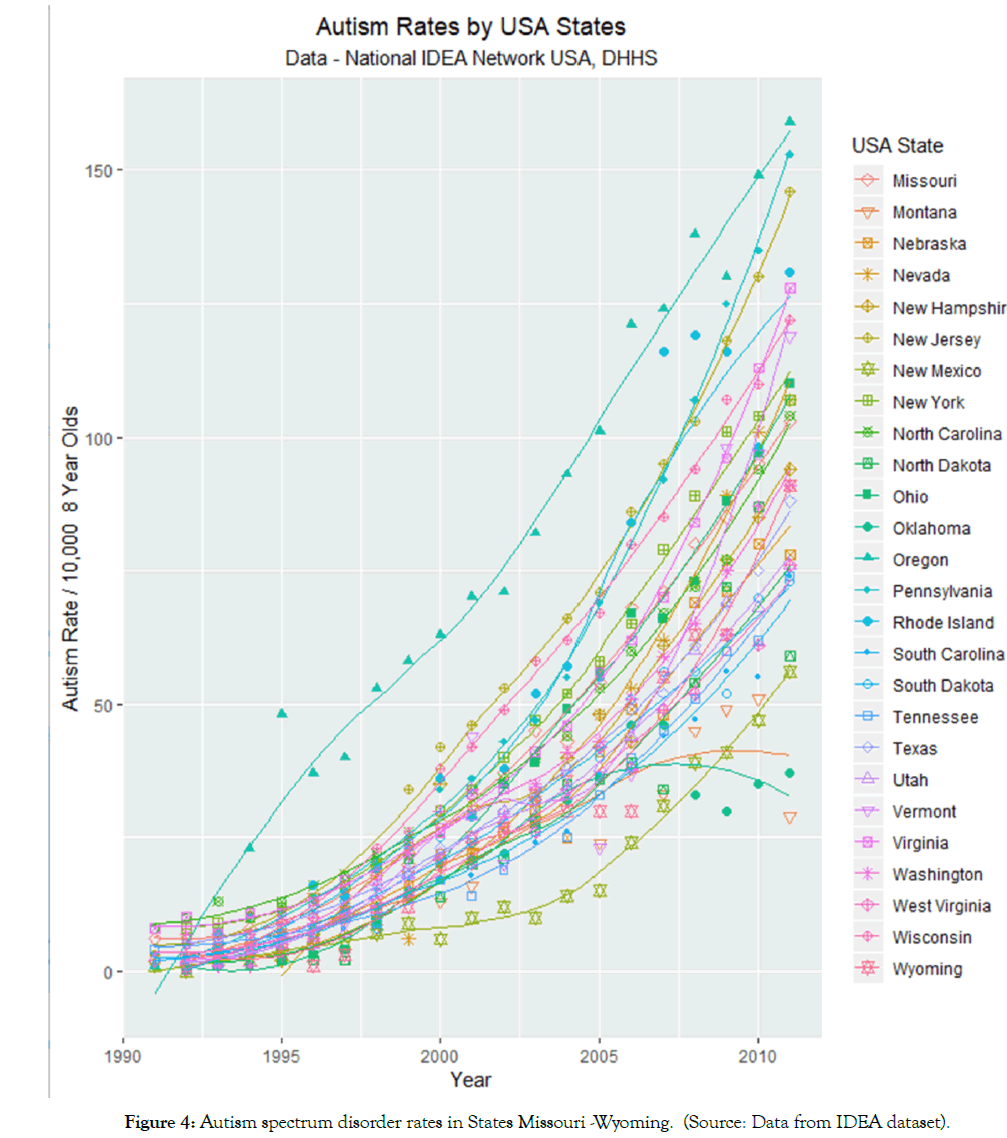
Figure 4: Autism spectrum disorder rates in States Missouri -Wyoming. (Source: Data from IDEA dataset).
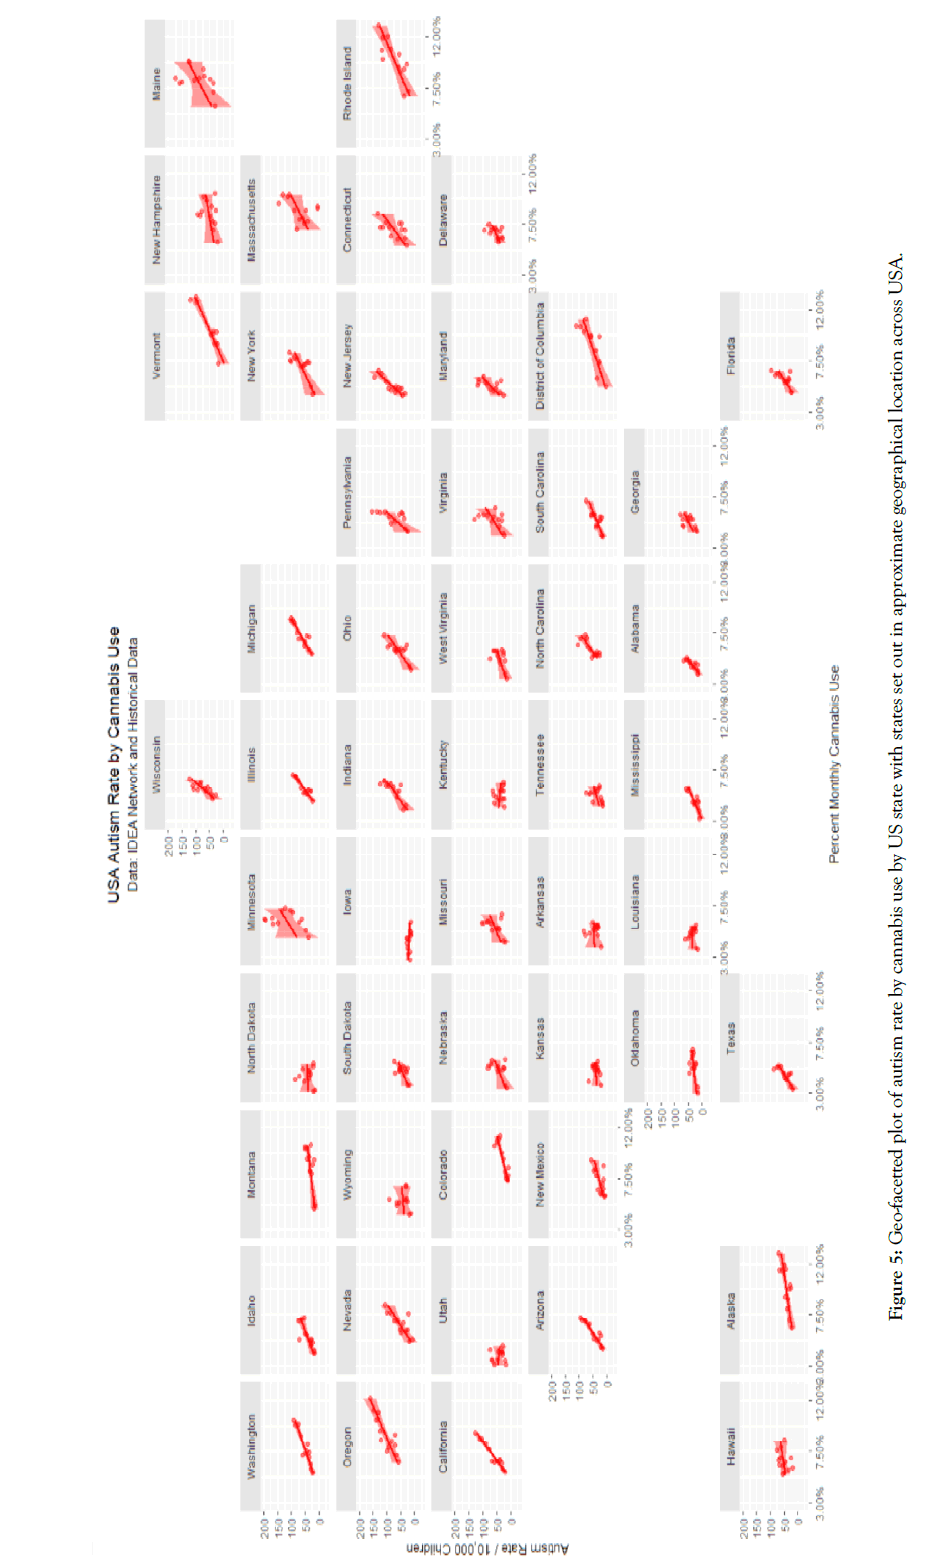
Figure 5: Geo-facetted plot of autism rate by cannabis use by US state with states set out in approximate geographical location across USA.
The relationship of the ASD rate to time appears to concave upwards. Plotting of the square root of the ASD rate against time linearizes this relationship as shown in Supplementary Figure 3. This comparison can be formalized by conducting an analysis of variance (ANOVA) study of models of ASD rate linear and quadratic in time. The AIC of the linear model is 1726.158 and that of the quadratic model is 1557.113 (F=185.63, df=1, p<2.0x10⁻¹⁶). This result confirms that the model quadratic in time provides superior fit to the data.
When the ASD rate is regressed against quadratic time and state using Iowa as the baseline comparator 128 terms are significant (Supplementary Table 1).
Figure 5 presents a geofacetted plot of the rate of autism against cannabis use in each state. This graph plot sets out a scatterplot of the ASD rate against cannabis use for each state with each state in the approximate position it occupies in the USA and forms a very clear way to compare the scatterplots and their regression lines for each state. One note that in each case the data falls closely on the least squares regression lines with different, albeit generally increasing trends with cannabis use, in each state.
States may be divided into average and high cannabis use rates based on the most recent results of the SAMHSA NSDUH. In this survey the states of Colorado, Alaska, Washington state, Oregon, Montana, Massachusetts Washington DC, Rhode Island and Vermont were the nine highest ranking states. When these states were classed as high use the graph shown in Figure 6 is obtained. Table 1 shows the outcome of linear regression procedures on this data for both linear models and for mixed effects models with the state as a random effect, for models linear and quadratic in time in both cases. As shown in Table 1, many terms are highly significant and the time: cannabis_use_status interaction is significant in all models from p<0.0001. Models quadratic in time were superior to the linear-only models for both linear and mixed effects models (linear models: F=189, dF=1, p<2.0x10 -16; random effects models log ratio=333, p<0.0001).
| Linear Models | ||||||||
|---|---|---|---|---|---|---|---|---|
| Parameter | Parameters | Model | ||||||
| Est. | Std. Error | t value | Pr(>|t|) | Adj. R Squ | F | df | p | |
| Autism ~ Time* factor (Cannabis_Exposure) | ||||||||
| Time | 0.196 | 0.0073 | 26.69 | <2e-16 | 0.781 | 1210 | 31,019 | <2.0E-16 |
| Cannabis_High | -36 | 16.1 | -2.239 | 0.025 | ||||
| Time: Cannabis_High | 0.0179 | 0.008 | 2.237 | 0.026 | ||||
| Autism ~ (Time)2 *factor (Cannabis_Exposure) | ||||||||
| Time | 40.224 | 1.3512 | 29.77 | <2e-16 | 0.815 | 1120 | 41,018 | <2.0E-16 |
| (Time)2 | -9.114 | 1.3561 | -6.72 | 3.00E-11 | ||||
| Time: Cannabis_High | 4.1692 | 1.4778 | 2.82 | 0.0049 | ||||
| Mixed Effects Models | ||||||||
| Parameter | Parameters | Model | ||||||
| Value | Std. Error | dF | t-value | p | AIC | BIC | Log Lik | |
| 2005-2013 | ||||||||
| Autism ~ Time*factor (Cannabis_Exposure), State as Random | ||||||||
| Time | 0.1782 | 0 | 970 | 34 | 0 | 1386 | 1415 | -687 |
| Cannabis_High | -38.39 | 13 | 49 | -3 | 0.004 | |||
| Time:Cannabis_High | 0.0192 | 0 | 970 | 3 | 0.002 | |||
| Autism ~ (Time)2*factor (Cannabis_Exposure), State as Random | ||||||||
| Time | 33.305 | 0.4064 | 968 | 81.9506 | 0 | 1031 | 1065 | -508 |
| (Time)2 | -6.995 | 0.4065 | 968 | -17.21 | 0 | |||
| Time:Cannabis_High | 4.1333 | 0.9955 | 968 | 4.1521 | 0 | |||
| (Time)2:Cannabis_High | -2.125 | 0.9978 | 968 | -2.1295 | 0.034 | |||
Table 1: Linear Regression Models
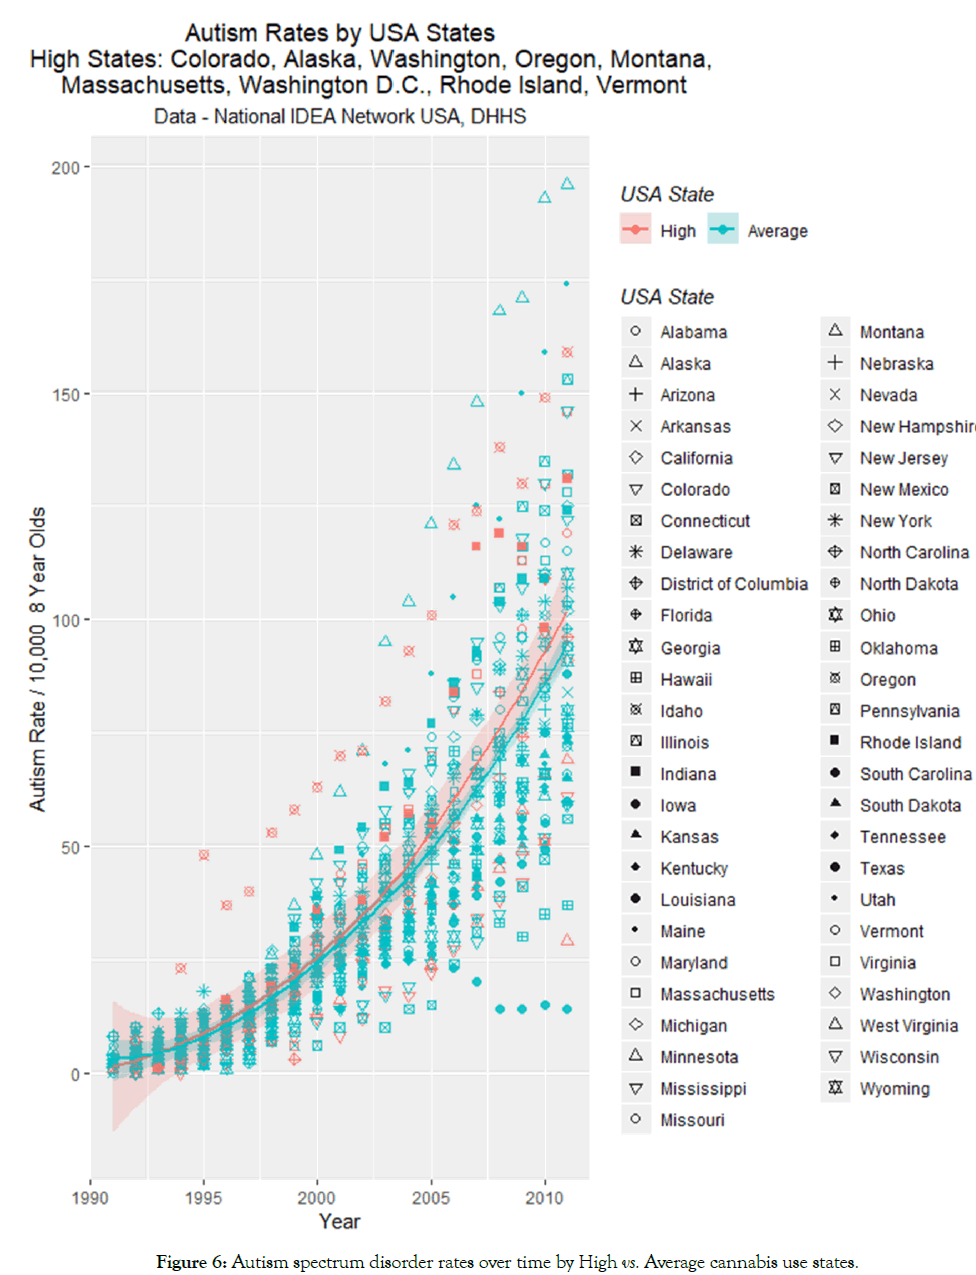
Figure 6: Autism spectrum disorder rates over time by High vs. Average cannabis use states.
The mean ASD rates in high v low states was 100.11+14.21 v 93.64+5.39 (p=0.6791).
Figure 7 plots the ASD rate against the use by state of the various addictive agents. Positive slopes of lines are obtained for alcohol and cannabis. These relationships are quantified by regression studies in the upper half of Table 2. There one notices highly significant and positive β-estimates for cannabis by both monthly and annual measures of use.
| Parameter | Parameters | Model | ||||||
|---|---|---|---|---|---|---|---|---|
| Est. | Std. Error |
t value | Pr(>|t|) | Adj. R Squ | F | df | p | |
| Autism Rate ~ Substance Use | ||||||||
| Alcohol Monthly | 2.8724 | 0.3081 | 9.322 | <2.0E-16 | 0.116 | 86.9 | 1,656 | <2.0E-16 |
| Binge Alcohol Monthly | 4.0727 | 0.7451 | 5.466 | 6.60E-08 | 0.042 | 29.9 | 1,656 | 6.55E-08 |
| Cigarettes Monthly | -6.799 | 0.7468 | -9.104 | <2.0E-16 | 0.111 | 82.9 | 1,656 | <2.0E-16 |
| Cocaine Annual | -0.239 | 0.0861 | -2.773 | 0.0057 | 0.01 | 7.69 | 1,656 | 0.0057 |
| Pain Relievers Annual | 0.0049 | 0.2026 | 0.024 | 0.9806 | -0.006 | 0 | 1,174 | 0.9806 |
| Cannabis Monthly | 0.9099 | 0.0839 | 10.84 | <2.0E-16 | 0.151 | 118 | 1,656 | <2.0E-16 |
| Cannabis Annual | 0.778 | 0.1093 | 7.115 | 3.47E-12 | 0.082 | 50.6 | 1,544 | 3.47E-12 |
| Autism Rate ~ Cannabinoid Use | ||||||||
| THC Monthly | 0.9768 | 0.0418 | 23.36 | <2.0E-16 | 0.453 | 546 | 1,656 | <2.0E-16 |
| Cannabidiol Monthly | -0.122 | 0.0749 | -1.623 | 0.105 | 0.003 | 2.63 | 1,656 | 0.1051 |
| Cannabinol Monthly | 0.6155 | 0.0713 | 8.637 | <2.0E-16 | 0.101 | 74.6 | 1,656 | <2.0E-16 |
| Cannabichromene Monthly | 1.0752 | 0.0598 | 18 | <2.0E-16 | 0.33 | 324 | 1,656 | <2.0E-16 |
| Cannabigerol Monthly | 0.8907 | 0.0475 | 18.75 | <2.0E-16 | 0.348 | 352 | 1,656 | <2.0E-16 |
| Tetrahydrocannabivarin Monthly | 0.8959 | 0.0697 | 12.85 | <2.0E-16 | 0.2 | 165 | 1,656 | <2.0E-16 |
Table 2: Univariate Relationship of ASD Rate to Substance and Cannabinoid Exposure.
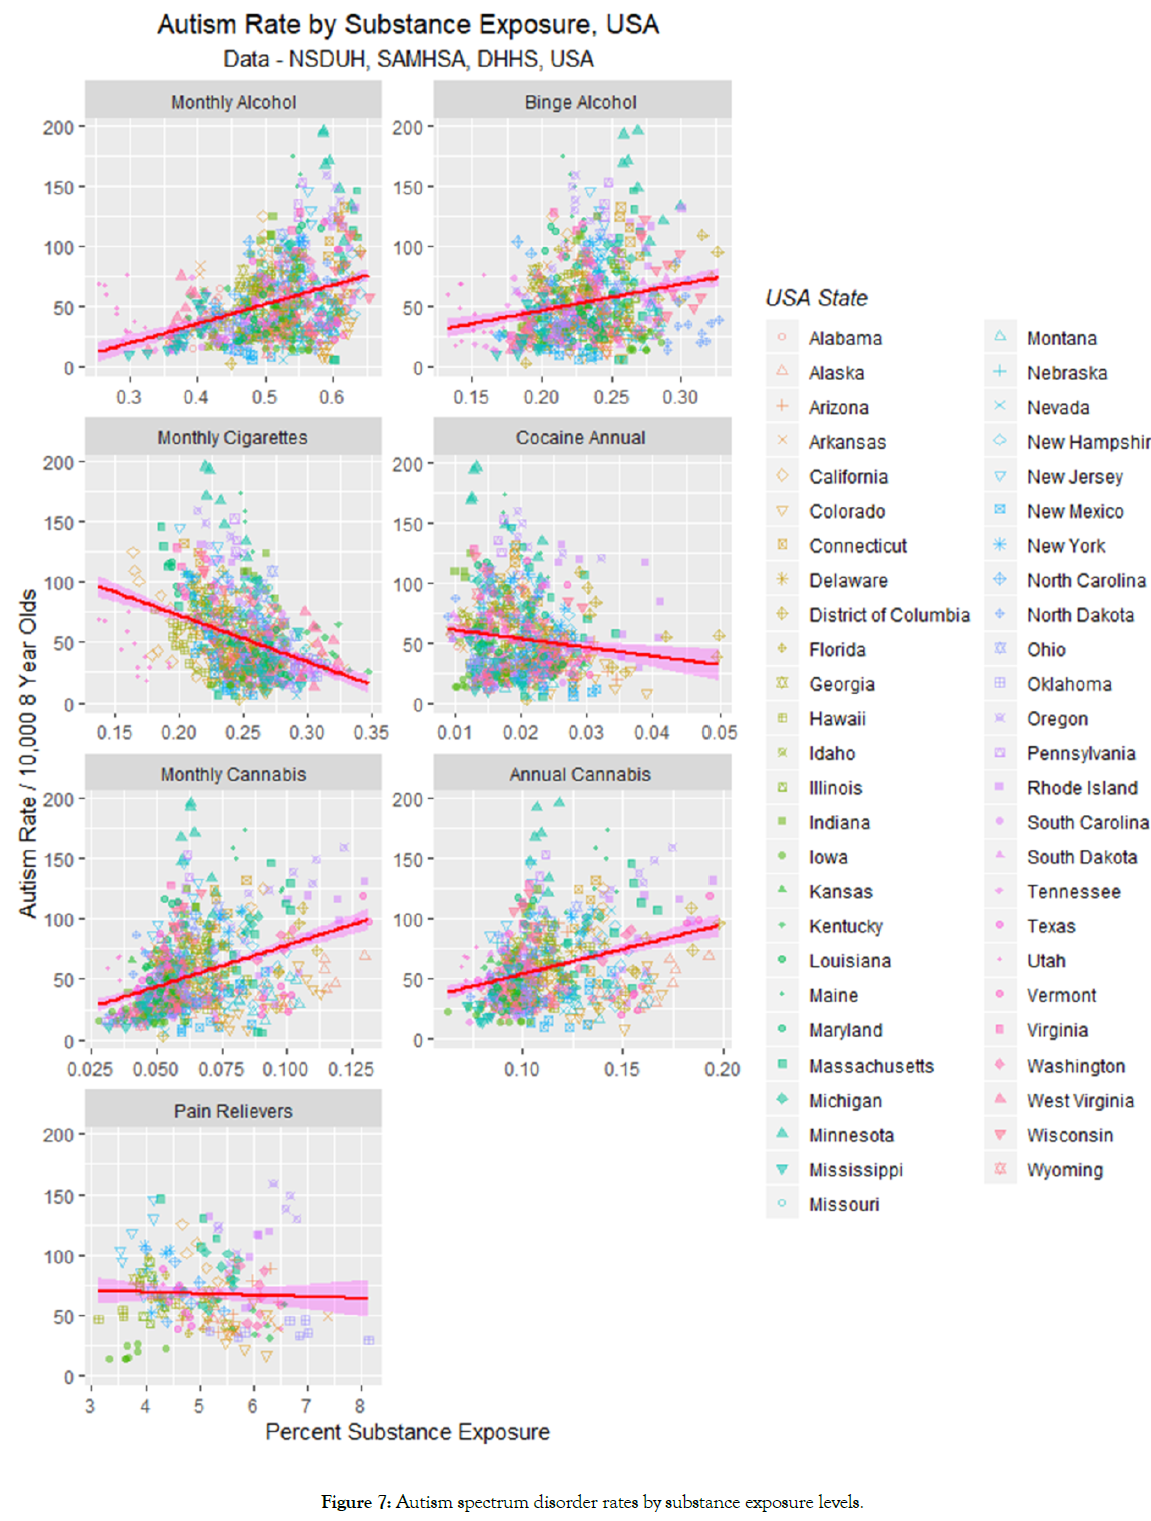
Figure 7: Autism spectrum disorder rates by substance exposure levels.
For this reason cannabinoids were broken down by the major ones for which data is available at the time of writing. The data are presented graphically in Figure 8. One notes a positive slope for five of the cannabinoids, but an apparently slightly negative slope for cannabidiol.
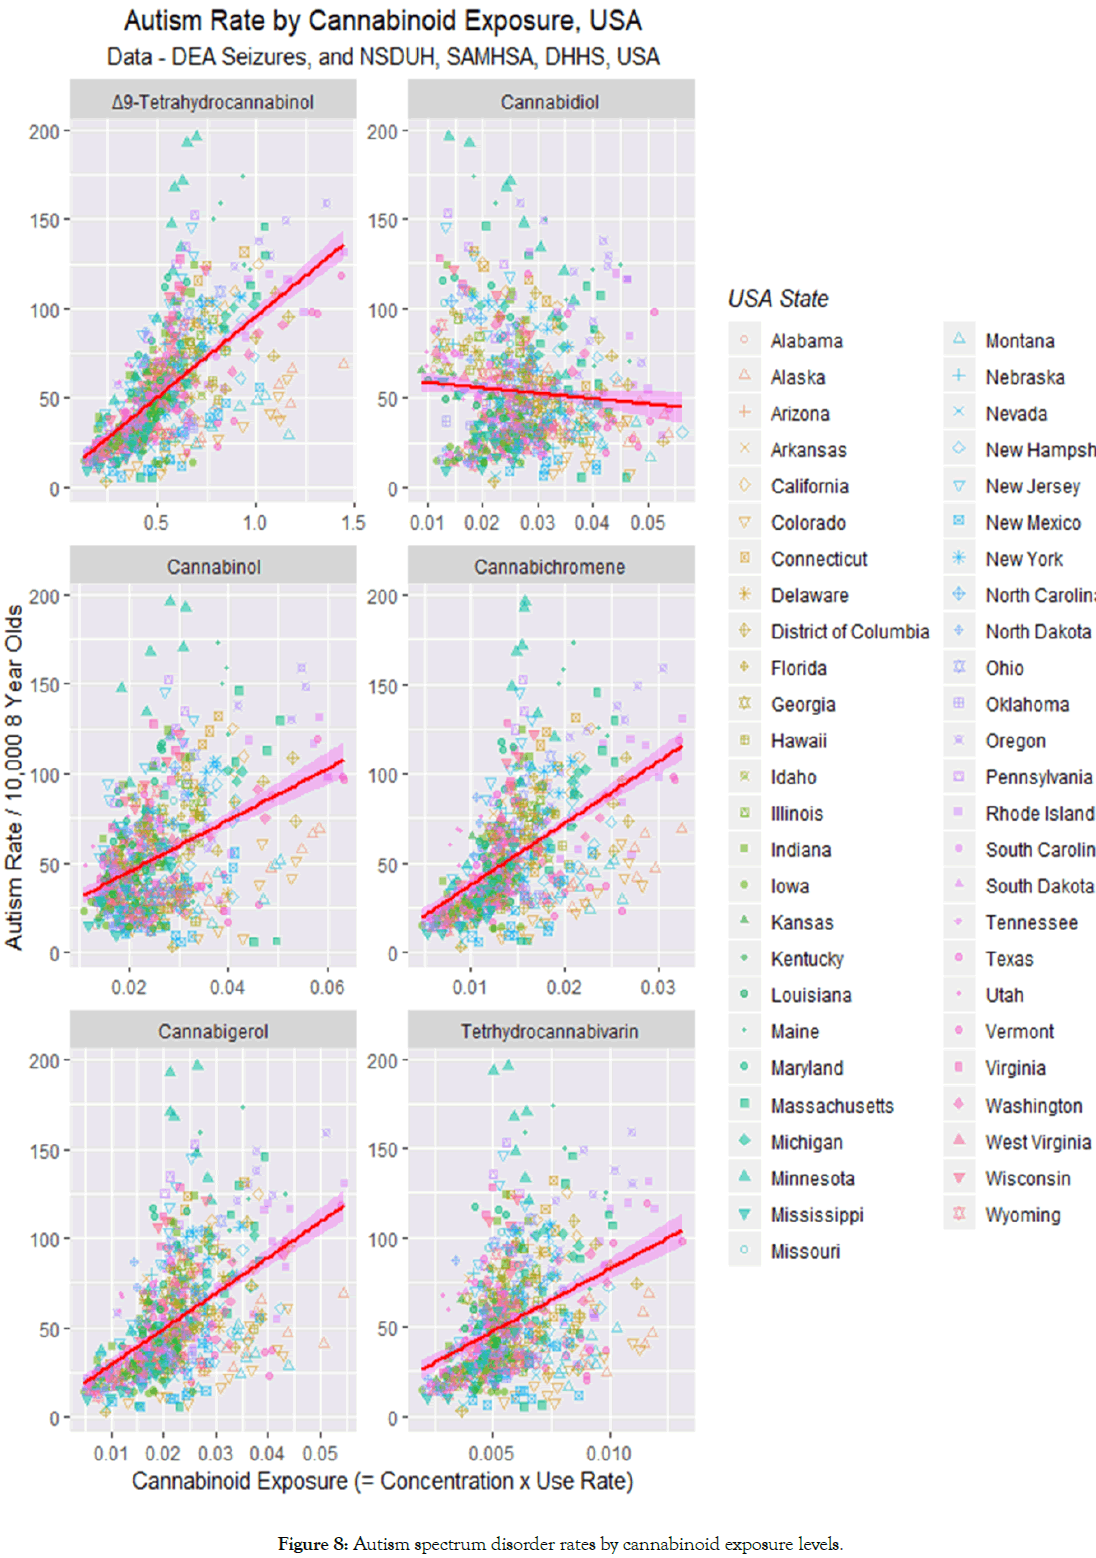
Figure 8: Autism spectrum disorder rates by cannabinoid exposure levels.
These effects are quantitated in the lower half of Table 2 which confirms strongly positive relationships for the five cannabinoids Δ9-tetrahydrocannabinol (THC), cannabinol, cannabichromene, cannabigerol and tetrahydrocannabivarin. The analysis in Table 2 shows that the slope of the regression line for cannabidiol is not significantly different from zero (t=-1.623, p=0.1050).
Having demonstrated in single variable analyses an apparent relationship between the use of various substances and the ASD rate, a natural consideration related to the relative importance of the various substances on linear regression. Table 3 explores this question. When all cannabinoids are regressed against ASD rate in a simple linear additive model only cannabidiol is significant (β-estimate=10.2, p<0.0001). When a model employing interactive terms in cannabinoid use is used the results are as shown in the second part of Table 3 which find that both THC (β-estimate=1.3, p=0.0001) and cannabidiol (β-estimate=4680.0, p=0.0007) are significant.
| Parameter | Parameters | Model | ||||||
|---|---|---|---|---|---|---|---|---|
| Est. | Std. Error | t value | Pr(>|t|) | Adj. R Squ | F | df | p | |
| 1991-2011 | ||||||||
| Linear Additive Model w All Cannabinoids | ||||||||
| Time | 0.132 | 0.0045 | 29.54 | <2.0E-16 | 0.571 | 438 | 2,655 | <2.0E-16 |
| CBD | 10.2 | 1.91 | 5.32 | 0 | ||||
| Interactive Model w All Cannabinoids | ||||||||
| Time:THC:CBD | -0.022 | 0.0051 | -4.19 | 0 | 0.582 | 184 | 5,652 | <2.0E-16 |
| THC | 1.33 | 0.33 | 4.03 | 0.0001 | ||||
| Time:CBD | 2.35 | 0.687 | 3.43 | 0.0007 | ||||
| CBD | -4680 | 1370 | -3.41 | 0.0007 | ||||
| 1995-2011 | ||||||||
| All Drugs Additive Model | ||||||||
| Alcohol | 3.4918 | 0.7474 | 4.67 | 0 | 0.432 | 23.2 | 6,169 | <2.0E-16 |
| Binge_Alcohol | -8.268 | 1.8225 | -4.54 | 0 | ||||
| Tobacco | -12.59 | 3.7767 | -3.33 | 0.0011 | ||||
| Cigarettes | 13.728 | 4.7634 | 2.88 | 0.0045 | ||||
| Cocaine | 16.323 | 6.6386 | 2.46 | 0.0149 | ||||
| All Drugs Interactive Model | ||||||||
| Cigarettes:Alcohol | -256 | 45 | -5.73 | 0 | 0.497 | 10.6 | 18,157 | <2.0E-16 |
| Cigarettes:CBD:Alcohol | 9280 | 2020 | 4.59 | 0 | ||||
| CBD:Alcohol | -1450 | 339 | -4.29 | 0 | ||||
| Cigarettes:CBD | -2E+05 | 41900 | -3.82 | 0.0002 | ||||
| Time:Cigarettes:CBD | 78 | 21 | 3.75 | 0.0003 | ||||
| CBD | 711 | 192 | 3.71 | 0.0003 | ||||
| Cigarettes:THC:CBD | 583000 | 165000 | 3.54 | 0.0005 | ||||
| Time:Cigarettes:THC:CBD | -290 | 82 | -3.55 | 0.0005 | ||||
| Time:Cigarettes:THC | 0.0208 | 0.006 | 3.45 | 0.0007 | ||||
| Time:Cigarettes:THC:CBD:Alcohol | 449 | 131 | 3.44 | 0.0007 | ||||
| Cigarettes:THC:CBD:Alcohol | -9E+05 | 263000 | -3.44 | 0.0008 | ||||
| Cigarettes | 6520 | 2090 | 3.11 | 0.0022 | ||||
| Time | 0.894 | 0.29 | 3.08 | 0.0024 | ||||
| Time:Cigarettes | -3.2 | 1.04 | -3.08 | 0.0024 | ||||
| Time:THC | -0.003 | 0.0013 | -2.16 | 0.0325 | ||||
| Alcohol | 1750 | 817 | 2.14 | 0.0338 | ||||
| Time:Alcohol | -0.848 | 0.406 | -2.09 | 0.0382 | ||||
| Binge_Alcohol | -4.01 | 1.95 | -2.05 | 0.0417 | ||||
THC: Δ9-tetrahydrocannabinol; CBD: Cannabidiol; CBN: Cannabinol
Table 3: Linear Regression Models of Relationship of ASD Rate to Substance and Cannabinoid Exposure.
When all the different substances were compared in a simple additive model the results obtained in the middle of Table 3 are derived.
When all the substances (excluding cannabis) and all the individual cannabinoids are regressed against the ASD Rate the results shown in the lower part of Table 3 are obtained. It is interesting to note that cannabidiol survives model reduction in nine terms from p<0.00001, and terms including Δ9-tetrahydrocannabinol occur six times (from p=0.0005).
When this exercise is repeated in a random effects mixed interactive model with state as a random effect, similar results are obtained (Table 4). Here Δ9-tetrahydrocannabinol is seen in four terms, cannabidiol in eight terms and cannabinol in one term.
| Parameter | Parameters | Model | ||||||
|---|---|---|---|---|---|---|---|---|
| Value | Std.Error | dF | t-value | p | AIC | BIC | LogLik | |
| 1995-2011 | ||||||||
| Alcohol | -364 | 40 | 592 | -9 | 0 | -5 | 75 | 20 |
| CBN | -11 | 3 | 592 | -4.4 | 0 | |||
| Time:Alcohol | 0 | 0 | 592 | 9.1 | 0 | |||
| THC:CBD:Alcohol | -1E+05 | 22471 | 592 | -4.6 | 0 | |||
| Time:THC:CBD:Alcohol | 51 | 11 | 592 | 4.6 | 0 | |||
| Cigarettes:THC:CBD:Alcohol | 204251 | 49651 | 592 | 4.1 | 0 | |||
| Time:Cigarettes:THC:CBD:Alcohol | -102 | 25 | 592 | -4.1 | 0 | |||
| THC | -1770 | 435 | 592 | -4.1 | 1E-04 | |||
| Time:THC | 1 | 0 | 592 | 4.1 | 1E-04 | |||
| Time:CBD | 0 | 0 | 592 | 4 | 1E-04 | |||
| Time:THC:Alcohol | -2 | 0 | 592 | -3.8 | 1E-04 | |||
| THC:Alcohol | 3114 | 819 | 592 | 3.8 | 2E-04 | |||
| Cigarettes:CBD:Alcohol | -527 | 157 | 592 | -3.4 | 8E-04 | |||
| Time:THC:CBD | -13 | 5 | 592 | -2.4 | 0.018 | |||
| THC:CBD | 25439 | 10781 | 592 | 2.4 | 0.019 | |||
THC: Δ9-Tetrahydrocannabinol; CBD: Cannabidiol; CBN: Cannabinol
Table 4: Mixed and Random Effects Models of Relationship of ASD Rate to Substance and Cannabinoid Exposure.
The above analysis seems to present mixed evidence relating to the effect of cannabidiol on the ASD rate. For this reason its relationship was explored further.
One note from Figure 2 that cannabidiol has a biphasic relationship with time having risen and then fallen since it is understood to be regulated in a manner opposite to Δ9-tetrahydrocannabinol in the Cannabis sativa plant. It is conceivable that this biphasic rise and fall is creating some confusion in the analysis since cannabidiol alone of all the cannabinoids assessed, does not display a unidirectional trend.
For this reason Figure 9 charts the ASD-cannabidiol data by individual year. Visual inspection suggests that there appears to be a rise in the slope of the least squares regression line till about 2007 and a subsidence thereafter. Careful inspection of Figure 2C shows that the cannabidiol concentration curve of Federal seizures apparently maximized in about 2002 which suggests a possible time lagged effect (Supplementary Table 2).
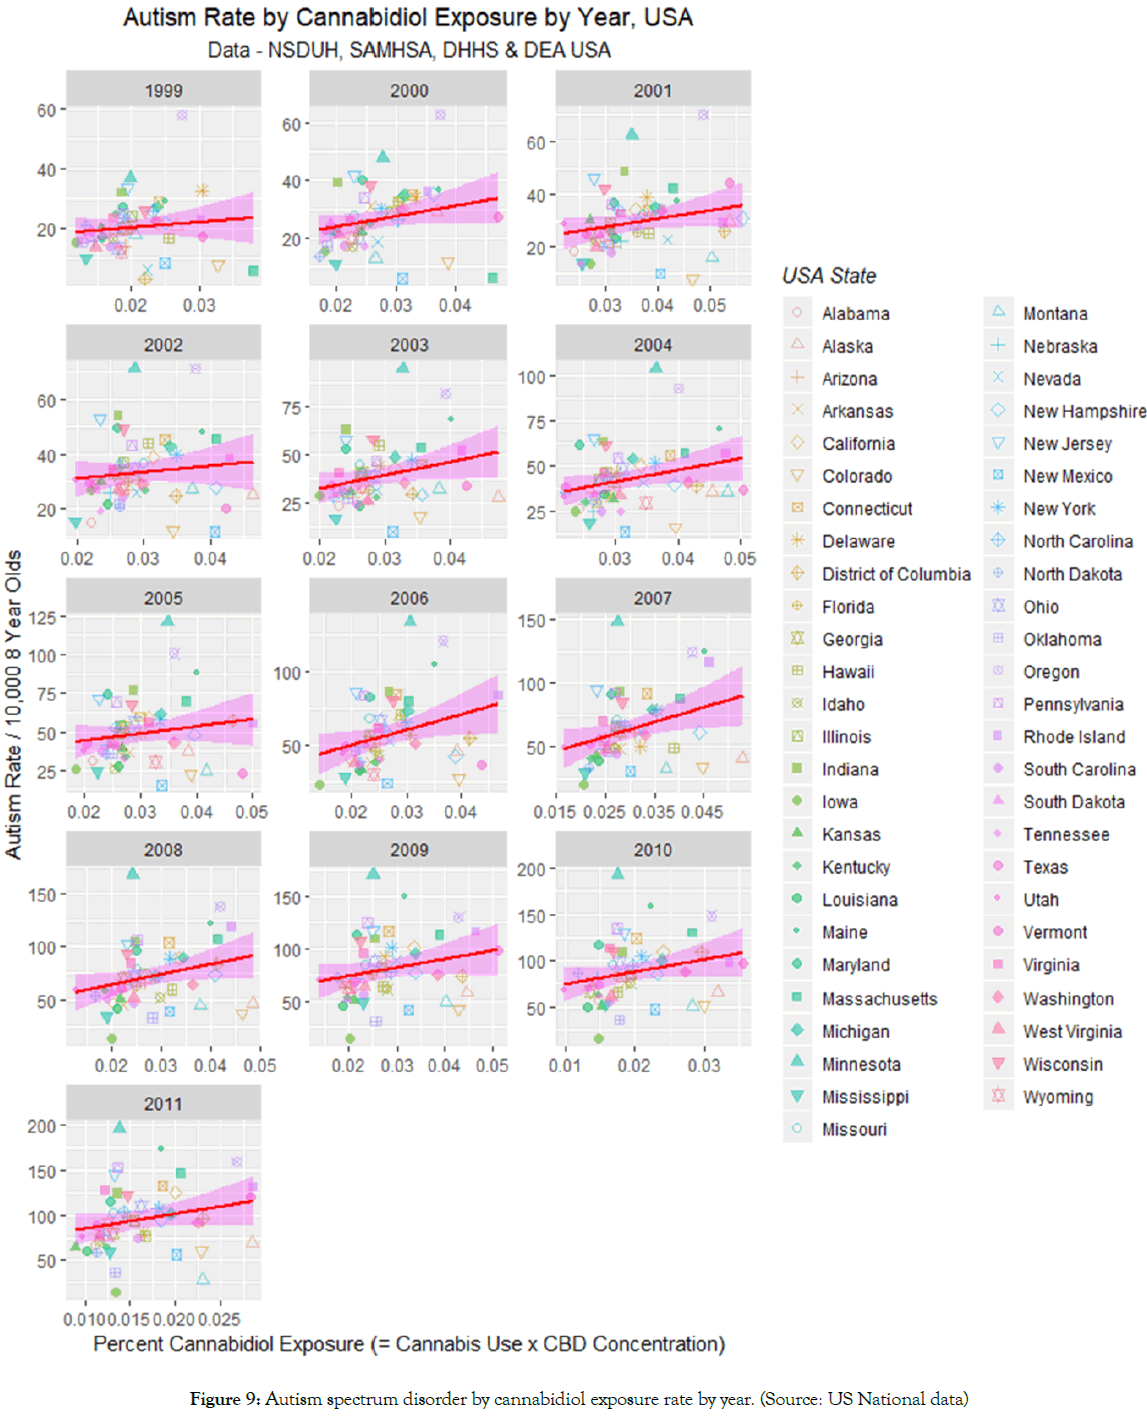
Figure 9: Autism spectrum disorder by cannabidiol exposure rate by year. (Source: US National data)
Figure 10A shows the slopes of the regression lines of Figure 9 against time and compares it to the curve for the cannabidiol concentration. An apparent time lag effect is seen.
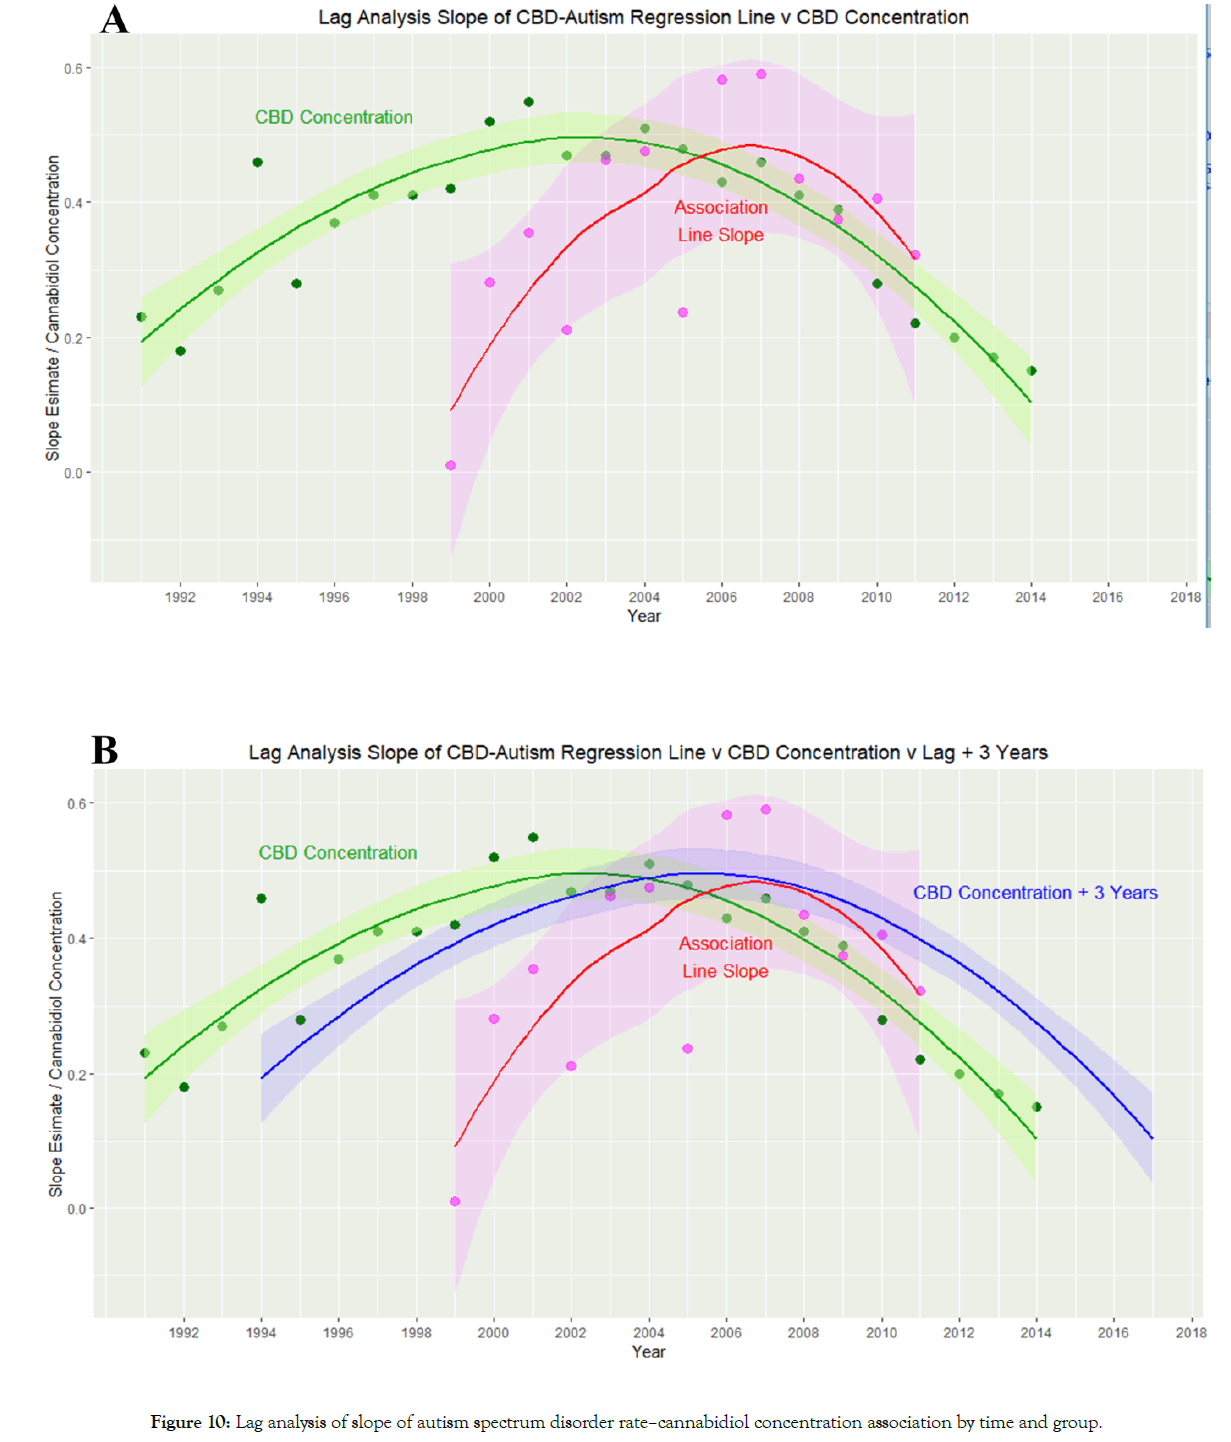
Figure 10: Lag analysis of slope of autism spectrum disorder rate–cannabidiol concentration association by time and group.
Supplementary Figure 4 shows autocorrelation and partial autocorrelation plots of this data. Supplementary Figure 5 presents a cross-correlation graph of the cannabidiol and ASD-cannabidiol slope data which indicates that the correlation maximizes around a lag of 3-4 years.
Figure 10B re-draws the plot of Figure 10A with a three-year lag added to the cannabidiol concentration curve. This has the effect of raising the cannabidiol–ASD-cannabidiol slope correlation from R=0.0165 (95%C.I. -0.5393–0.5624), t=0.0549, df=11, p=0.9572 up to R=0.7483 (95%C.I. 0.3357-0.9199), t=3.7414, df=11, p=0.0033.
Hence this more detailed analysis suggests that notwithstanding the declining cannabidiol content of US cannabis seizures, cannabidiol is indeed associated with the ASD rate, albeit after a lag period of 3-4 years or thereabouts. The salience of cannabidiol in the several multiple regression tabulations (Tables 3 and 4) described above is also clear.
Despite calls by at least two US Surgeons General [70,71] on the risks associated with drug use during pregnancy, and strong warnings by the American College of Obstetricians and Gynecologists [72] the issue of drug use in pregnancy and possible increases in neonatal morbidity has not been fully investigated. In the light of recent emerging data identifying drug-related causal pathways for neonatal morbidity, this study investigated the relationship between epidemiological data on US state-based drug use and the incidence of ASD, particularly to investigate the apparently mystifying rise in many parts of the USA and elsewhere.
This study confirmed that ASD is rising in all states except Iowa and Oklahoma. The overall trend shows a quadratic time-dependent increase. When the high cannabis use states of Colorado, Alaska, Washington state, Oregon, Montana, Massachusetts Washington DC, Rhode Island and Vermont are grouped together the ASD rate is rising faster than in the remainder of the country (time:status interaction p=0.0049 in a quadratic-time model). In the period 1995- 2011 ASD rose with alcohol and cannabis use but not with opioid pain relievers, tobacco and cocaine. Upon multivariate testing terms including alcohol, cigarettes, Δ9-tetrahydrocannabinol, cannabidiol and cannabinol remained significant in final models. The effect of cannabidiol was complex due to its inverted U-shaped time trend but was confirmed to be associated with ASD rates on lagged analysis.
These findings have far reaching significance. Data demonstrate clear evidence of association between alcohol, tobacco, Δ9- tetrahydrocannabinol and cannabidiol with ASD incidence. However the present study does not occur in a vacuum, but in the context of a wealth of mechanistic studies suggesting pathways by which many cannabinoids have been shown to interfere with brain growth and maturation and fundamental neuronal physiology. This potent combination of high level epidemiological evidence and a plethora of mechanistic pathways raises a potentially causal relationship as a major issue.
The cause of ASD is not understood. Heightened startle reflex, inability to concentrate, impaired IQ and difficulty of visual processing well described in the PCE neurobehavioural toxicology literature all bear close resemblance to various autistic features [8-11,73]. Abnormalities of cortical structure, white matter connections, and subcortical nuclei have been reported in ASD [74,75]. Similar changes have been seen after cannabis exposure [76,77] and indeed long term deficits of cortical and executive functioning have been reported in all three longitudinal studies of prenatally exposed children performed in Pittsburgh USA, Netherlands and Ottawa [8-11].
It is interesting to consider that the congenital cannabis exposure literature describes a range of defects from smaller heads, to microcephaly to anencephaly including immediate postnatal and intrauterine death [8,12,78,79]. This implies a spectrum of post- PCE neurological disorders from mild to moderate to severe neuroteratology.
It should also be observed that the present findings could arise either from a generalized effect on a whole population, or from a high signal effect from tiny communities. Evidence of spatial clustering of autism in parts of Utah and California suggest that this latter effect may be of public health importance [80-82]. Such clustering is consistent with local cannabis-based subcultures and this has indeed been documented in northern California [13].
It is not our view that cannabinoids are the only cause of ASD, as we feel that cannabinoids are but one cause amongst many. However since it seems clear that cannabinoids are likely to be an important cause of ASD, and since cannabinoid use has been shown to be increasing significantly across USA in recent years including by pregnant women [83,84] it would appear that at the very least the “cannabinoid-autism link” identified in this work is a potential major driver of the rise in autism rates across the country.
The data which are available do not allow us to ascertain if ASD itself is being reproduced, or if the disorder is merely being phenocopied. Given however that ASD itself represents a spectrum of disorders and is almost certainly of complex origin, this distinction would appear to be largely academic.
It is also known that cannabis can be excreted in breast milk for as long as six days after consumption [85,86]. Moreover as many as 85% of lactation consultants recently surveyed suggested that breast feeding continue in the cannabis dependent mother [87].
Our demonstration that autism rates relate closely and robustly to population exposures to cannabidiol is interesting and provocative for several reasons. In the comprehensive final model of all of the drugs by linear regression shown in Table 3 cannabidiol featured in nine terms compared to THC’s six terms, and when this exercise was repeated with a comprehensive mixed model in Table 4 cannabidiol featured in eight terms compared to THC’s four terms. Cannabidiol is widely available across USA where it is generally regarded as non-toxic and harmless due to the fact that it is not psychoactive like THC and indeed FDA is understood to be presently considering relaxing regulations in relation to it [86]. Our analysis was complicated by the generally falling concentration of cannabidiol in Federal seizures as US cannabis has been widely bred to maximize the THC content and minimize the cannabidiol content [88].
However cannabidiol is known to be both directly genotoxic [14,89-91] and to be toxic to mitochondria whose energy and normal metabolism is required for normal genome maintenance [38,39,92,93]. Proper expression of the protein complexes of the mitochondria is known to require coordinated transcription of the nuclear and genomic genomes. This is orchestrated by metabolic shuttles between the mitochondria and nucleus of key metabolites such as NAD+ (nicotinamide adenine dinucleotide cation), the malate- glucose-3-phosphate shuttle and acetyl-coenzyme A (which is the major source of acetyl groups for histone acetylation which activate gene transcription by opening the chromatin structure and making DNA accessible to the transcription machinery) together with various RNA species in addition to supplies of ATP itself [40]. ATP is required for the many energy-dependent reactions involved in DNA maintenance, transcription and nucleosomal positioning. Disruption of this delicate mitonuclear balance or the induction of the mitochondrial stress response changes the availability of metabolic substrates to the nucleus which are available to the epigenetic machinery and also changes the epigenetic state of the nuclear and mitochondrial genomes [40]. Hence the present implication of cannabidiol in ASD incidence at the epidemiologicalecological level merits further careful investigation. Given the ready and increasing availability of cannabidiol across USA, if confirmed by further studies these results may carry far reaching implications.
Whilst our study did not explicitly or by design investigate causal processes it is nevertheless of considerable interest to closely measure our findings against the suggested metrics of causality outlined classically by Bradford Hill in 1965 [66]. The nine criteria linked with causation cited by Hill were strength of association, consistency and reproducibility, specificity, temporality, biological gradient, plausibility, coherence, experiment and analogy.
Amongst these criteria, strength of association and biological gradient are clearly established by the high beta-coefficients for many of the regression equations and their vanishingly small p-values (from p<0.0001 for many cannabinoids Tables 1-4). Consistency and reproducibility is demonstrated by the persistence of these effects across the generality of US states. Specificity is shown as comparable effects were not seen for alcohol, opioids, cocaine or tobacco, some of which are known to impact brain development. Temporality is shown by the concordance of the changes in ASD over time across US states. Plausibility and coherence are demonstrated by the existence of multiple mechanistic pathways between cannabinoid exposure and abnormalities of brain development as summarized in the introduction and discussion sections of the present paper. Analogy is established by comparison with other drugs where other agents, such as SSRI antidepressants, drugs active on folic acid metabolism and cytotoxic are known to affect brain development [3-5].
Whilst this study is obviously not an experimental study, and indeed it would not be ethical to conduct such a study on human populations, in some respects the natural variation across the various US states implies that the study is to some extent quasiexperimental in nature. The demonstration that rising cannabis use was linked with increasing rates of ASD in 50 of 51 states (Figure 5) was particularly compelling. It is important to note here that cannabis use appears to be rising across the USA irrespective of the legal status of cannabis in the various jurisdictions. That cannabis use is rising in nearly all states aligns closely with rising autism rates in nearly all states. A detailed consideration of the interaction between the legal status of cannabis and the rate of autism was recently published which found an increased rate of ASD associated with more liberal paradigms of cannabis use including medical cannabis and frank cannabis legalization [23]. Thus whilst this study is not experimental per se, its quasi-experimental nature is consistent with a cannabinoid-autism link.
This brief review demonstrates that the present study in fact meets causal criteria for an association between cannabis and ASD on eight of the nine Hill criteria, whilst its quasi-experimental nature is consistent with requirements relating to experimental verification albeit whilst not being explicitly experimental in design.
Findings raise special concerns in relation to introduction of cannabidiol, cannabinol and many other cannabinoids into the US food chain as is understood to be in process following the US Farm Act [86,94]. Indeed in this regard the recent experience near Ain in France near the Swiss border is relevant. Press reports disclose a 58-fold elevation of upper limb phocomelia locally [95,96] along with a flourishing cannabis industry [97,98]. Micromelia was seen also in cattle–suggesting a food chain effect–but not in nearby Switzerland where cannabinoids had previously been banned. An epidemiological association of PCE with micromelia has been described [12]. The French investigation into this outbreak has since been re-opened.
Strengths of the present study include its relatively long duration, its national level datasets, and access to what are likely the best state-based figures of population drug use and ASD available internationally. Limitations relate to its ecological and epidemiological design and include its lack of access to individual level data and the approximations involved in approximating state level cannabinoid exposure. Both these issues can be corrected by a large case-controlled study with an objective measurement of drug exposure such as hair analysis [99].
This study confirms an association at the epidemiological-ecological level between ASD with cannabinoids Δ9-tetrahydrocannabinol and cannabidiol, and to a lesser extent tobacco and alcohol use. Since tobacco and alcohol use are declining US nation-wide this implicates both psychoactive and non-psychoactive cannabinoids in the quadratically rising ASD epidemic across 49 US jurisdictions, an association which is robust to multivariate adjustment for other drug use. The relationship between cannabidiol and ASD lags by several years. Particular concerns apply to contamination of the national food supply with cannabinoids and their asymptotic neurotoxicity and genotoxicity. In the context of multiple previously established mechanistic pathways these association-level findings are consistent with a casual pathway and position cannabis as a major suspect driving the present epidemic. We advocate a large case-controlled study be undertaken including objective measures of drug exposure to investigate dose-response and putatively causal effects.
No external funding for this study.
The authors have indicated they have no financial relationships to this article to disclose.
The authors have indicated they have no potential conflicts of interest to disclose.
Dr Reece designed the study, performed the statistical analysis and wrote the first draft.
Prof Hulse reviewed the manuscript for important intellectual content and revised the draft. He also provided administrative, research support and assisted with statistical advice and oversight.
All authors approved the final manuscript as submitted and agree to be accountable for all aspects of the work.
Citation: Reece AS, Hulse GK (2019) Epidemiological Associations of Various Substances and Multiple Cannabinoids with Autism in USA. Clin Pediatr OA 4:155.
Received: 15-Apr-2019 Accepted: 20-May-2019 Published: 27-May-2019 , DOI: 10.35248/2572-0775.19.4.155
Copyright: Copyright: © 2019 Reece AS, et al. This is an open-access article distributed under the terms of the Creative Commons Attribution License, which permits unrestricted use, distribution, and reproduction in any medium, provided the original author and source are credited.