Journal of Sleep Disorders & Therapy
Open Access
ISSN: 2167-0277
+44 1478 350008
ISSN: 2167-0277
+44 1478 350008
Research Article - (2019)Volume 8, Issue 2
Objectives: To evaluate changes in upper airway dimensions post Mandibular Setback (MS) surgery with Surgery First Orthognathic Approach (SFOA) and also to evaluate stabilty of these changes 01 year post surgery using Acoustic Pharyngometry (AP).
Methods: AP records of 10 patients treated with SFOA for MS were evaluated for changes in upper airway dimensions at T0 (Pre-treatment), T1 (01 week post-surgery) and T2 (01 year post surgery). Percentage changes in airway parameters were measured between T0 and T1 to study the changes in airway dimensions post-surgery and between T1 and T2 to know the stability of changes in upper airway dimensions 01 year post surgery and to ascertain relapse.
Results: The distribution of mean volume, mean area and minimum area at T1 was significantly lower compared to T0 (p-value<0.01). The distribution of mean volume and mean area at T2 was significantly higher compared to mean volume at T1 (p-value<0.001). The distribution of mean minimum area at T2 did not differ significantly compared to mean minimum area at T0 and T1 (p-value>0.05).
Conclusion: SFOA is a viable approach for management of maxillofacial deformities in selected cases. However, skeletal relapse and airway compromise in MS cases necessitates the clinician to meticulously diagnose and plan the treatment in these cases and a more extensive bi-jaw surgery may be considered at the expense of preventing airway compromise in these patients. A longitudinal study with a larger sample size and longer follow up period may be considered to validate the findings of this study.
Pharyngeal airway dimensions; Surgery First Orthognathic Approach (SFOA); Acoustic pharyngometry
The effect of orthognathic surgery involving mandibular advancement/setback on pharyngeal airway dimensions is a wellresearched fact [1]. Mandibular Advancement (MA) by Conventional Orthognathic Surgery (COS) or Distraction Osteogenesis (DO) increases the upper airway dimensions and is one of the most successful treatment modality for the management of Obstructive Sleep Apnea (OSA) in adult patients with a retrognathic mandible [2,3]. A long term study by Li et al have concluded a success rate >90% with maxillomandibular advancement in relieving OSA [4]. However, the effect of Mandibular Setback (MS) surgery on upper airway is not encouraging and imprudent MS can predispose the patient to upper airway sleep disorders [5,6].
Surgery First Orthognathic Approach (SFOA) is a recently popularized treatment modality for combined ortho-surgical treatment wherein the phase of pre-surgical orthodontics is eliminated and the patient is immediately taken up for orthognathic surgery. Post-surgical orthodontics is started as early as possible to utilise Rapid Acceleratory Phenomenon (RAP) to accelerate tooth movement and reduce the treatment time [7,8]. Though this technique is extremely effective in the hands of an experienced ortho-surgical team, various studies have documented an increased skeletal relapse following SFOA compared to COS mainly owing to post-surgical interim transitional occlusion in SFOA [9]. The upper airway caliber is directly influenced by the changes in position/size of the jaws and the relapse in airway dimensions is considered to be similar to the skeletal relapse [5,6].
Various modalities to assess upper airway dimensions include CT, MRI, and Lateral Cephalogram. These techniques have a limited use at present due to various constraints such as extraradiation exposure to the patient and cost factors. AP is a relatively newer technique to measure and compare airway dimensions post intervention. It is a non-invasive modality based on acoustic reflection technique which can be routinely used in clinical practice and can be done chair-side [10,11]. To the best of our knowledge, no study is available which compares stability of upper airway dimensions post MS surgery in patients treated with SFOA. Hence, this study was designed to evaluate and compare changes in upper airway dimensions post MS surgery with SFOA and also to evaluate stability of these changes 01 year post surgery using AP.
Study design
Retrospective observational study.
Study sample
This study was conducted at the Department of Orthodontics and Dentofacial Orthopedics of a tertiary care government teaching institute. The study sample comprised of orthodontic treatment records of 10 patients randomly selected from the institutional archives that underwent MS surgery with SFOA and met the inclusion criteria of the study. The radiographs (OPG and Lateral cephalogram) used in the study were recorded using the same machine (Model: ADVAPX cephalostat machine, Company: Panorraitic System, Printer: Fujifilms DRY PIX 7000) with a standardized technique. AP for all patients was done with ECCOVISION® Acoustic Pharyngometer™ at the Division of orthodontics and Dentofacial Orthopedics.
Inclusion criteria
• Complete treatment records available.
• No history of any systemic disease/condition affecting bone metabolism.
• Adult patients (CVMI Stage VI).
• Pre and post-treatment radiographs and Acoustic AP from same equipment with a standardized technique.
• MS cases treated with SFOA.
• Skeletal Class III with ANB <-4 degrees, reverse overjet >2 mm.
• Crowding/spacing <5 mm.
Exclusion criteria
• Syndromic cases/cases with any systemic disease affecting bone metabolism.
• CVMI stage <VI.
• Skeletal Class III patients treated with Bi-jaw orthognatic surgery/DO surgery.
• History of previous trauma to jaws or previous ortho-surgical treatment.
Categorization of study sample
The study sample comprised of equal numbers of male and female patients to avoid gender bias (05 males and 05 females). All the selected patients were treated with same protocol with SFOA for mandibular setback and post-surgical orthodontics was carried out using 0.018 MBT pre-adjusted edgewise appliance.
The AP was taken at three time frames:
T0: Pre-treatment.
T1: 01 week post-surgery.
T2: 01 year post surgery.
The pharyngeal airway dimensions (volume, mean area, minimum area and minimum distance) were recorded at T0, T1 and T2. Percentage change in the above mentioned parameters were measured between T0 and T1 to know the changes in airway dimensions post-surgery. Percentage changes between T1 and T2 were determined 01 year post surgery to know the stability of changes in airway dimensions and to ascertain relapse (if any). The data collected was compiled in MS Excel work sheet and was subjected to statistical analysis.
Statistical analysis
The data on continuous variables was presented as Mean and Standard Deviation (SD). The pair-wise statistical comparisons of distribution of means of continuous variables was performed using Repeated Measures Analysis of Variance (RMANOVA). The underlying normality assumption was tested before subjecting the study variables to RMANOVA. All the results are shown in tabular as well as graphical format to visualize the statistically significant difference more clearly.
In the entire study, the p-values less than 0.05 were considered to be statistically significant. All the hypotheses were formulated using two tailed alternatives against each null hypothesis (hypothesis of no difference). The entire data was statistically analyzed using Statistical Package for Social Sciences (SPSS version 21.0, IBM Corporation, USA) for MS Windows.
The results of this study are as below:
Change in volume
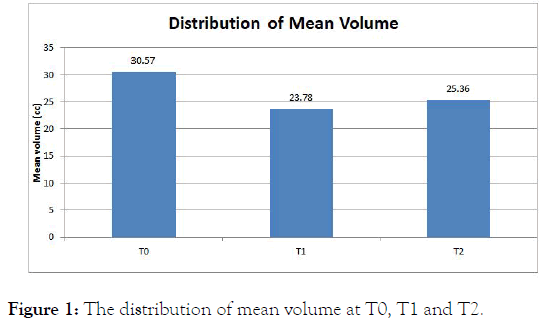
The distribution of mean volume at T1 and T2 was significantly lower compared to mean volume at T0 (p-value<0.01 for both). The distribution of mean volume at T2 was significantly higher compared to mean volume at T1 (p-value<0.001). The mean % change in volume at T1 from T0 was 78.11% and mean % change in volume at T2 from T1 was 107.05% (Table 1 and Figure 1).
Table 1: The comparison of pre-treatment (T0) and post-treatment (T1 and T2) mean of study parameters.
| Time interval | Volume (cc) (n=10) | Mean Area (cm2) (n=10) | Minimum area (cm2) (n=10) | Minimum distance (cm) (n=10) | ||||
|---|---|---|---|---|---|---|---|---|
| Mean | SD | Mean | SD | Mean | SD | Mean | SD | |
| T0 | 30.57 | 4.89 | 3.08 | 0.50 | 1.61 | 0.53 | 18.44 | 2.92 |
| T1 | 23.78 | 4.73 | 2.38 | 0.47 | 1.25 | 0.40 | 18.66 | 2.98 |
| T2 | 25.36 | 4.52 | 2.54 | 0.45 | 1.30 | 0.53 | 19.04 | 1.47 |
| % Change T1-T0 | 78.11 | 11.66 | 77.57 | 11.81 | 81.39 | 24.23 | 105.46 | 34.24 |
| % Change T2-T1 | 107.05 | 3.77 | 107.08 | 3.087 | 110.33 | 61.47 | 106.43 | 31.25 |
| p-value (Intra-group) | ||||||||
| T0 v T1 | 0.001*** | 0.001*** | 0.006** | 0.879NS | ||||
| T0 v T2 | 0.002** | 0.001*** | 0.159NS | 0.584NS | ||||
| T1 v T2 | 0.001*** | i | 0.752NS | 0.735NS | ||||
Note: P-value by Repeated Measures Analysis of Variance (RMANOVA). P-value<0.05 is considered to be statistically significant. **p-value<0.01, ***p-value<0.001, NS-Statistically non-significant.

Figure 1: The distribution of mean volume at T0, T1 and T2.
Change in mean area
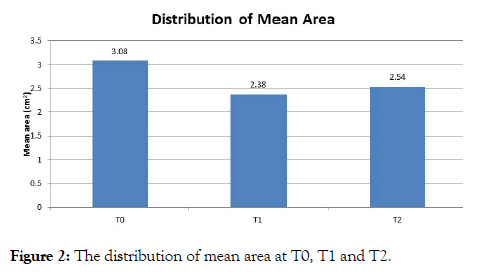
The distribution of mean area at T1 and T2 was significantly lower compared to mean area at T0 (p-value<0.001 for both). The distribution of mean area at T2 was significantly higher compared to mean area at T1 (p-value<0.001). The mean % change in mean area at T1 from T0 was 77.57% and mean % change in mean area at T2 from T1 was 107.08% (Figure 2).

Figure 2: The distribution of mean area at T0, T1 and T2.
Change in minimum area
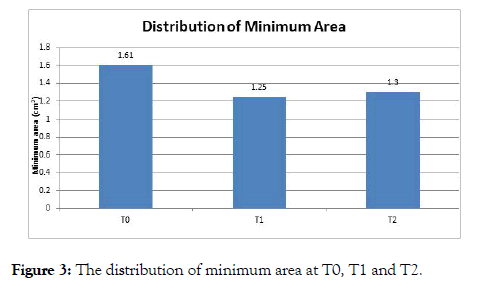
The distribution of mean minimum area at T1 is significantly lower compared to mean minimum area at T0 (p-value<0.01). The distribution of mean minimum area at T2 did not differ significantly compared to mean minimum area at T0 and T1 (p-value>0.05 for both). The mean % change in minimum area at T1 from T0 was 81.39% and mean % change in minimum area at T2 from T1 was 110.33% (Figure 3).

Figure 3: The distribution of minimum area at T0, T1 and T2.
Change in minimum distance
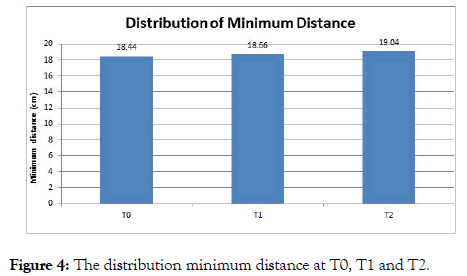
The distribution of mean minimum distance at T1 and T2 did not differ significantly compared to mean minimum distance at T0 (p-value>0.05 for both). The distribution of mean minimum distance at T2 did not differ significantly compared to mean minimum distance at T1 (p-value>0.05). The mean % change in minimum distance at T1 from T0 was 105.46% and mean % change in minimum distance at T2 from T1 was 106.43% (Figure 4).

Figure 4: The distribution minimum distance at T0, T1 and T2.
The posterior positioning of the pharyngeal soft tissues secondary to MS surgery especially the base of the tongue may predispose an individual to OSA which is a global health risk at present. This was first reported by Guilleminault et al. [12] who observed OSA in two patients post MS surgery in Skeletal Class III patients and have gained wide spread attention among the Surgeons and Orthodontists since then. Upper airway imaging done by lateral cephalogram is a two dimensional representation of a three dimensional structure and hence reliability is questionable. On the other hand, though CT and MRI produce a reliable three dimensional representation of the airway, their feasibility in routine clinical practice is questionable due to cost and radiation exposure related factors. AP is a non-invasive clinical modality which can be recorded chair-side at no radiation exposure and is a widely accepted modality to assess airway obstruction and response of airway to functional appliance therapy/maxillo-mandibular surgery to relieve OSA. Therefore, AP was used to assess airway dimensions in this study [11-18].
The results of this study indicate a significant decrease in airway volume and mean area between T0 and T1 and a minimal increase during follow up between T1 and T2. Our results are in concurrence with the findings of Zayer et al., who in a systematic review observed a significant reduction in pharyngeal airway dimensions post MS surgery. The authors also observed a minimal increase in airway over one year follow up which is again similar to our study. However, no studies selected for the systematic review utilised AP as the diagnostic modality [15].
A study done by Chen et al., concluded that pharyngeal airway was more compromised in surgical procedures involving only MS surgery as compared to a bi-jaw orthognathic surgery for correction of skeletal class III. The authors also suggested that whenever possible, a bi-jaw rather than only single jaw surgery should be considered for correcting skeletal class III deformity to prevent constriction of pharyngeal airway which may lead to development of OSA. In our study, the post-surgical volume and mean area reduced to 78.11% and 77.57% of pre-treatment values respectively. The increase in volume and mean area during one year follow up (T2) was 107.05% and 107.08% of post-surgical values (T1). Keeping these findings in view, the authors of the present study also opine that a Bi-jaw surgery may be considered in skeletal class III patients especially in cases of larger mandibular setbacks to safeguard the airway [11].
SFOA is a recently popularized approach to overcome the drawbacks associated with COS. A systematic review done by Maria et al., concluded that SFOA is a paradigm shift for management of skeletal deformities in the maxillofacial region with a high patient acceptance and satisfactory treatment outcomes. The authors also stressed upon the lack of long term studies in this regard. A study done by Kim et al., observed a horizontal relapse >3 mm in 39% of SFOA group compared to 15.8% of COS group which necessitates further studies in this field. To our best knowledge, there is no study evaluating the post-surgical stabilty of airway dimensions in skeletal class III patients treated by SFOA. Therefore, this study was undertaken evaluate and compare airway dimensions in these patients at various stages i.e. T0, T1 and T2. A statistically significant increase in airway dimensions (volume and mean airway) was observed between T1 and T2 (p-value<0.001) indicating a proportionate relapse of the skeletal and dental corrections also. This would caution the clinician during treatment planning to explore additional option of a bi-jaw surgery to prevent skeletal and dental relapse especially in cases with larger advancements [19,20].
1. SFOA is a viable approach for management of maxillofacial deformities in selected cases. However, skeletal relapse and airway compromise in MS cases (as observed in this study) necessitates the clinician to meticulously diagnose and plan the treatment in these cases and a more extensive Bi-jaw surgery may be considered at the expense of preventing airway compromise in these patients.
2. A longitudinal study with a larger sample size and longer follow up period may be considered to validate the findings of this study.
Not applicable.
No source of funding
Record based study
Not applicable
Not applicable
Not applicable
Citation: Agarwal SS (2019) Evaluation of Pharyngeal Airway Dimensions Following Mandibular Setback Surgery in Patients Treated with Surgery First Orthognathic Approach. J Sleep Disord Ther 8: 302. doi: 10.35248/2167-0277.19.8.302
Received: 17-Apr-2019 Accepted: 17-May-2019 Published: 24-May-2019 , DOI: 10.35248/2167-0277.19.8.302
Copyright: © 2019 Agarwal SS. This is an open-access article distributed under the terms of the Creative Commons Attribution License, which permits unrestricted use, distribution, and reproduction in any medium, provided the original author and source are credited.