Journal of Horticulture
Open Access
ISSN: 2376-0354
+44-77-2385-9429
ISSN: 2376-0354
+44-77-2385-9429
Research - (2019)Volume 6, Issue 3
In the present experimental study, we evaluated some tomato cultivars in greenhouse and field conditions in order to determine superior cultivars for yield and yield component traits. The experimental lay out adopted was the Randomized Complete Block Design (RCBD) which was replicated three (3) times. The combined analysis of variance showed significant (p<0.01 and p<0.05) variability among the genotypes, locations and genotype-location interactions (G × L) for almost all the traits. The relative performances of the genotypes differed with location. Among the genotypes evaluated, Mongal F1, Platinum F1, Nkansah HT, Wosowoso, Roma and Sumo F1 displayed superior performance for fruit yield across all locations.
Agronomic; Environment; Greenhouse; Improvement; Productivity; Tomato
Tomato (Solanum lycopersicum L.) belongs to the Solanaceae family and it is one of the most widely cultivated vegetable crops whose fruits serve as rich sources of important antioxidant compounds, vitamins and minerals required in human nutrition [1-5]. The crop thrives well in a wide range of environmental conditions and can be well cultivated in different seasons, diverse geographical locations, and on both small and large scale commercial farms [6,7]. In Ghana, a broad variety of tomato genetic resources, both local and introduced types are produced under different production systems [8]. Such genetic materials represent a rich pool of genetic resources which can be utilized for further crop improvement programmes aimed at selecting those which are well adaptable to either specific or multiple environmental settings. In recent times, the technology of growing tomatoes in greenhouses has become an important aspect of most commercial production systems [9,10]. The conditions in the greenhouses could be attuned to differ from that occurring in an open field settings in regard to light, temperature and relative humidity which do affect the crop’s growth, development, fruit quality, fruit appearance and market value [11]. Agronomic traits are good markers to assess variability in crops and consequently, the selection of desirable parents for advancement in crop breeding programmes. In this instance, genotype variability and performance evaluation are easy to be conducted in the required growing conditions of a crop through the use of agronomic data [12]. In view of this it is reasonably significant to assess crop performance in greenhouse conditions in comparison with open field production of tomatoes in order to advise farmers on agronomic practices needed to be followed with the aim of increasing tomato productivity. The present study therefore sought to compare agronomic data under open field and greenhouse conditions and to identify best performers for cultivation and future tomato improvement programmes. The information gathered from this study will be beneficial to tomato growers and set the stage for further improvement programmes.
The experimental activities
We conducted tomato experiments at the University of Ghana Forest and Horticultural Crops Research Centre (FOHCREC) located within the forest agro-ecological zone in the eastern region of Ghana. Plastic seed trays filled with carbonated rice husks (biochar as growth medium) were used to raise the seedlings of all the cultivars in a greenhouse environment (Tables 1 and 2). All the required daily nursery practices were observed in order to produce vigorously uniform seedlings which were subsequently transferred to the experimental fields after 21 days of germination (Figure 1). In each of the two (2) experimental sites, a composite soil sample was taken and analyzed for physical and chemical properties (Table 2) using standard laboratory procedures. The experiments were arranged in a Randomized Complete Block Design (RCBD) with three replications. Seedlings were transplanted in a spacing of 30 cm × 40 cm at both experimental locations. For the field experiment, each genotype was transplanted in four rows of five plants while under greenhouse conditions, seedlings were transplanted in two drip rows of five plants each. Data were collected from 6 tagged plants in the middle rows. The climatic conditions prevalent in the two experimental sites were recorded (Tables 3 and 4). Agronomic practices including watering, fertilizer application, plant protection, weed control, and plant support were followed to raise the crop to the stage of harvesting. Fruits were harvested by hand picking when they had reached their physiological maturity (fully ripe) stage.
| Genotype | Source | Genotype | Source |
|---|---|---|---|
| Wosowoso | University of Ghana | Shaktiman | FOHCREC |
| Nkansah HT | FOHCREC | Heinz-1370 | Agriseed Ltd. |
| Pectomech | Agriseed Ltd. | Cherry | Agriseed Ltd. |
| Roma | Agriseed Ltd. | Mongal F1 | Agriseed Ltd. |
| Roma VF | Agriseed Ltd. | Nirvana F1 | Dizengoff |
| Buffalo | Agriseed Ltd. | Inlay F1 | Agriseed Ltd. |
| 11-172 | FOHCREC | Platinum F1 | Agriseed Ltd. |
| L11 | FOHCREC | Thorgal F1 | Agriseed Ltd. |
| NS 504 | FOHCREC | Cobbra F1 | Agriseed Ltd. |
| #20880 | FOHCREC | Sumo F1 | Agriseed Ltd. |
| HT: Heat tolerant; FOHCREC: Forest and Horticultural Crops Research Center. | |||
Table 1: Tomato genotypes used in the study.
| Property | Texture | Sand (%) | Silt (%) | Clay (%) | pH | N (%) | P (mg kg-1) |
K (cm kg-1) |
OC | EC (dsm-1) |
|---|---|---|---|---|---|---|---|---|---|---|
| Field | Sandy-clay-loam | 52.1 | 25.9 | 22.0 | 6.3 | 0.6 | 7.74 | 0.6 | 2.26 | 0.73 |
| Greenhouse | Sandy-clay-loam | 41.45 | 29.92 | 27.10 | 5.10 | 0.13 | 10.18 | 0.54 | 1.53 |  0.61 |
N: Nitrogen; P: Phosphorus; K: Potassium; OC: Organic carbon; EC: Electrical conductivity.
Table 2: Physicochemical properties of the soils sampled from the experimental locations.
| Temperature | Relative humidity | ||||
|---|---|---|---|---|---|
| Month | Maximum | Minimum | Maximum | Minimum | |
| November, 2014 | 40.70 | 16.70 | 79.89 | 31.23 | |
| December, 2014 | 39.26 | 16.70 | 81.20 | 34.23 | |
| January, 2015 | 40.65 | 16.68 | 88.40 | 33.25 | |
| February, 2015 | 40.34 | 16.71 | 82.30 | 34.24 | |
Table 3: Climatic data in the greenhouse environment (Source: FOHCREC).
| Temperature (°C) | Relative humidity (%) | Rainfall | |||
|---|---|---|---|---|---|
| Month | Maximum | Minimum | Maximum | Minimum | mm |
| November, 2014 | 34.40 | 23.51 | 94.98 | 39.52 | 0.47 |
| December, 2024 | 34.57 | 22.79 | 99.11 | 45.15 | 1.90 |
| January, 2015 | 34.57 | 22.54 | 98.64 | 46.19 | 2.11 |
| February, 2015 | 34.80 | 22.60 | 99.43 | 47.75 | 0.70 |
Table 4: Climatic data at the field experimental location (Source: FOHCREC).
| Mean Square | |||||||||||
|---|---|---|---|---|---|---|---|---|---|---|---|
| Source | df | PHT | SD | NL | CC | NPB | RTL | NFF | FPF | NFS | |
| R | 2 | 16.59 | 1.27 | 8.73 | 7.43 | 0.29 | 1.68 | 4.01 | 2.76 | 3.61 | |
| L | 1 | 185450.69** | 22.97** | 2060.65** | 2382.35** | 0.80* | 97.20** | 63.08** | 625.63** | 126.08** | |
| G | 19 | 495.30** | 2.09** | 435.70** | 62.80** | 2.13** | 35.18* | 26.43** | 24.89** | 138.22** | |
| * | |||||||||||
| G x L | 19 | 249.14** | 0.89* | 114.10** | 76.06** | 0.93** | 78.17* | 12.36** | 18.18** | 47.18** | |
| * | |||||||||||
| ERR | 78 | 3.06 | 0.40 | 6.78 | 2.70 | 0.11 | 0.91 | 0.29 | 0.46 | 1.13 | |
| CV (%) | 10.21 | 7.46 | 21.48 | 9.23 | 17.64 | 11.90 | 13.11 | 9.02 | 12.79 | ||
| Mean Square | |||||||||||
| Source | df | FPFS | FSP | DFM | TPP | FPT | NFPT | FPP | SFW | YPP | |
| R | 2 | 4.23 | 14.17 | 0.10 | 2.21 | 0.01 | 0.17 | 0.85 | 10.12 | 25.10 | |
| L | 1 | 76.80** | 94.10* | 5.04* | 182.43** | 7.86** | 0.97* | 217.16** | 3697.22** | 182.18** | |
| G | 19 | 228.13** | 300.68** | 207.64** | 155.47** | 4.17** | 2.66** | 392.84** | 3043.86** | 5707.92** | |
| G x L | 19 | 61.43** | 222.57** | 18.86** | 43.47** | 1.52** | 0.41** | 23.12** | 303.31** | 477.98** | |
| ERR | 38 | 2.43 | 33.69 | 1.06 | 0.96 | 0.25 | 0.16 | 0.44 | 7.46 | 7.05 | |
| CV (%) | 14.14 | 12.58 | 9.25 | 34.29 | 12.92 | 20.02 | 67.99 | 35.44 | 57.30 | ||
Significant at p<0.05; **Significant at p<0.01; CV=Coefficient of variability; PHT= Plant height; SD=Stem Diameter; NL= Number of leaves; CC=Chlorophyll content, NPB=Number of primary branches; RTL=Root length; NFF=Number of days to 1st flowering; FPF=Number of days to 50 % flowering; NFS=Number of days to fruit set, FPFS=Number of days to 50 percent fruit set; FSP=Percentage fruit set per plant; DFM=Number of days to fruit maturity; TPP=Number of truss per plant; FPT=Number of flowers per truss; NFPT=Number of fruits per truss; FPP=Number of fruits per plant; SFW=Single fruit weight and YPP=Yield per plant.
Table 5: Analysis of variance for the tomato traits under greenhouse conditions.
Data collection
Data was collected on ten (10) quantitative characters sampled from each plot per replication, via;
Plant Height (PHT): The mean perpendicular height (cm) of six tagged plants, measured from the soil level to the tip of the shoot at reproductive stage (30 days after transplanting) of the crop using a meter rule.
Chlorophyll content (CC): Chlorophyll content (nm) was determined on six tagged plants, at reproductive stage of the plant growth using the chlorophyll meter and the mean value determined.
Number of days to 50% flowering (FPF): The mean number of days from transplanting until 50% of the tagged plants had flowered.
Fruit set percentage (FSP): Fruit set percentage was determined by dividing the number of fruits by the number of flowers per cluster and the mean computed and expressed in percentage.
Number of days to fruit maturity (DFM): The mean number of days from transplanting until 50% of the tagged plants had at least one fruit ripened (at breaker stage).
Number of trusses per plant (TPP): The number of trusses per plant was counted on tagged plants and the mean number of trusses per plant determined.
Number of flowers per truss (FPT): The number of flowers per truss was counted for 10 trusses on each of the tagged plants and the mean number determined
Number of fruits per plant (FPP): The mean number of harvested fruits from each of the six recorded plants.
Single fruit weight per plant (SFW): The total weight (g) of fruits harvested from tagged plants divided by the total number of fruits harvested from tagged plants.
Fruit yield per plant (YPP): The mean fruit weight for each of the six record plants was used to calculate yield per hectare and converted to yield in tones’ per hectare (t/ha).
Statistical analysis of data
Data collected from each of the two growing conditions (field and greenhouse) were analyzed for variances using the GENSTAT statistical software (12th edn) (Table 5).
On the basis of the combined analysis of variance mean squares in terms of genotype, location and genotype-location interaction (G × E) recorded for almost all characters studied was significant (p<0.01 and p<0.05) (Table 4). Significant variation was observed among the studied traits across the two locations (Figures 1-10). Greenhouse-produced tomato cultivars were earlier in attaining 50% flowering as well as number of days to fruit maturity (Figures 3 and 5). Also, higher values for plant height and percent fruit set were recorded in the greenhouse experiment (Figures 2 and 5). However, chlorophyll content, number of truss per plant, number of flowers per truss as well as number of days to 50% flowering were higher under field conditions (Figures 3, 4, 7 and 8). Fruit yield is a complex trait and thus influenced by several yield components. Considering the average performances of all genotypes under greenhouse conditions, Mongal F1, Platinum F1, Nkansah HT, Cobbra F1, Wosowoso, Sumo F1, and NS 504 showed superior performance for fruit yield and are good materials for tomato production under greenhouse experimental conditions (Figure 11). Similarly, Mongal F1, Platinum F1, Nkansah HT, Wosowoso, Roma, Roma VF and Buffalo exhibited better fruit yield performance among all the genotypes evaluated under open field conditions for fruit yield. Across the two locations, four tomato genotypes showed superior performances. These genotypes were Mongal F1, Platinum F1, Nkansah HT and Wosowoso and thus represent materials good for tomato production irrespective of differences in location of the experiments (Figure 11). The mean fruit yields of most of these genotypes exceeded or were closer to their respective location averages. A common observation among most of the genotypes with superior performances for fruit yield was higher scores for one or more yield component traits including number of fruits per plant, number of trusses per plant, single fruit weight and total fruit weight per plant.
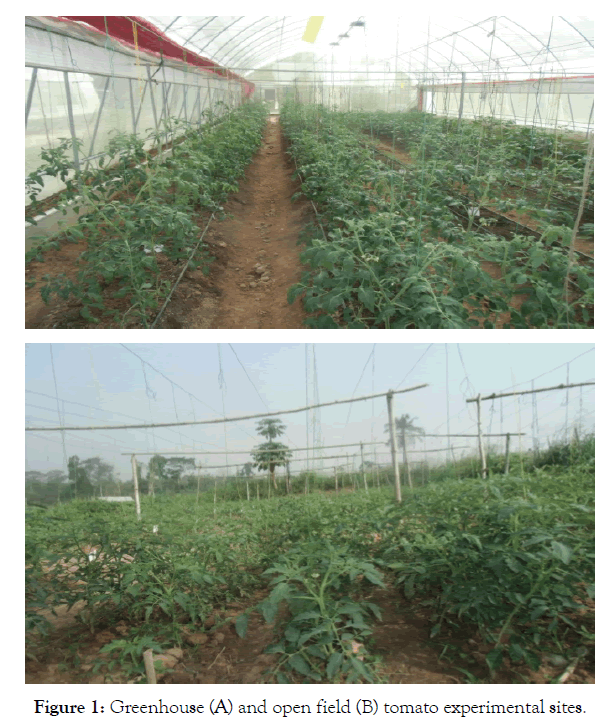
Figure 1: Greenhouse (A) and open field (B) tomato experimental sites.
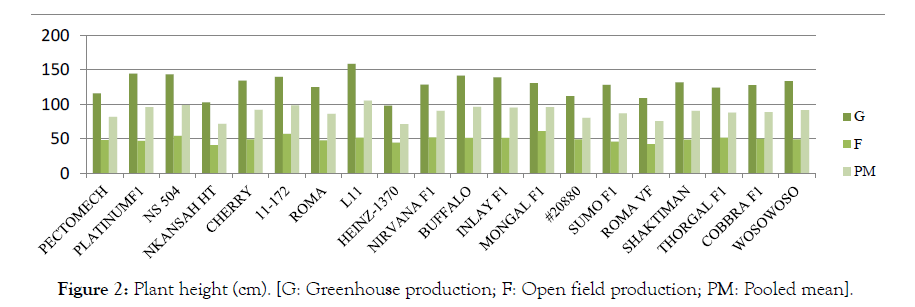
Figure 2:Plant height (cm). [G: Greenhouse production; F: Open field production; PM: Pooled mean].

Figure 3:Chlorophyll content. [G: Greenhouse production; F: Open field production; PM: Pooled mean].

Figure 4:Days to 50 % flowering. [G: Greenhouse production; F: Open field production; PM: Pooled mean].
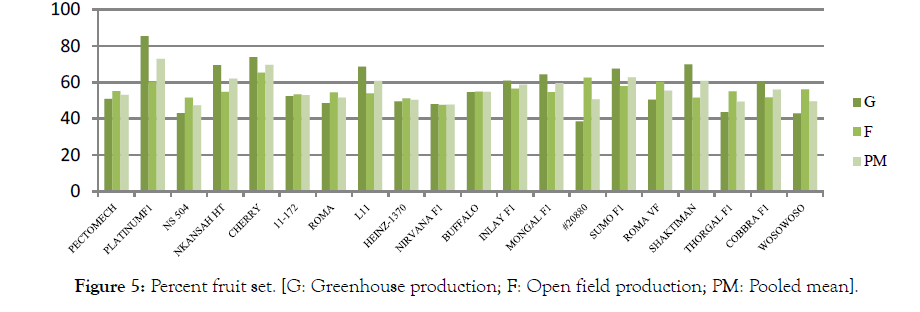
Figure 5:Percent fruit set. [G: Greenhouse production; F: Open field production; PM: Pooled mean].
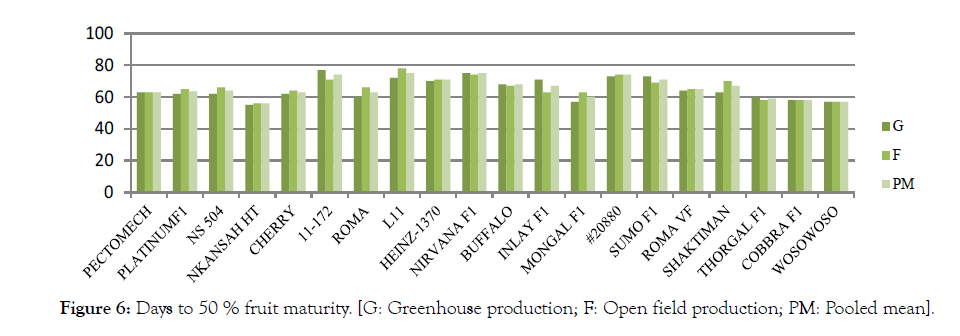
Figure 6:Days to 50 % fruit maturity. [G: Greenhouse production; F: Open field production; PM: Pooled mean].
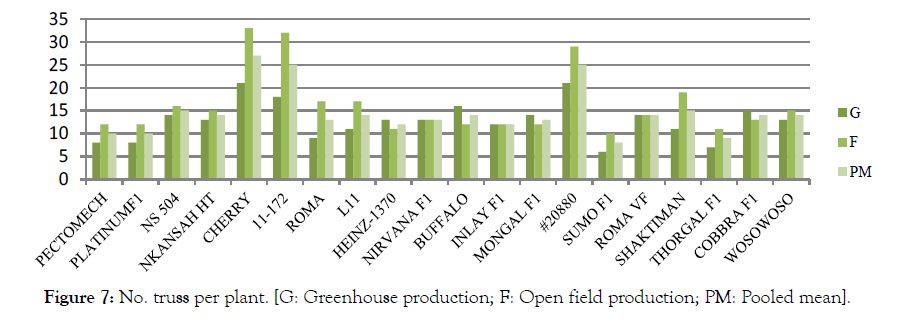
Figure 7:No. truss per plant. [G: Greenhouse production; F: Open field production; PM: Pooled mean].
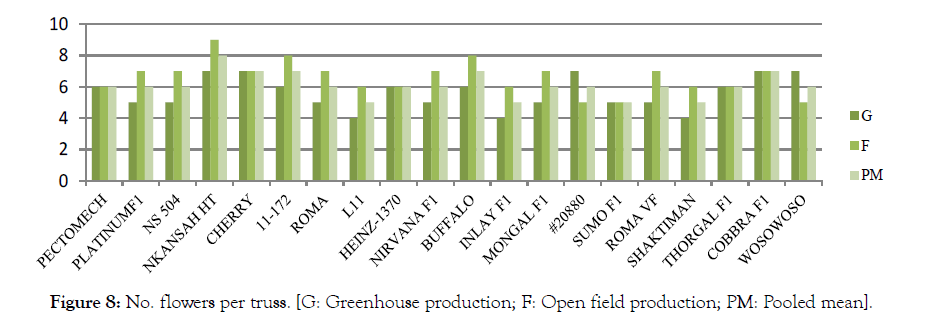
Figure 8:No. flowers per truss. [G: Greenhouse production; F: Open field production; PM: Pooled mean].
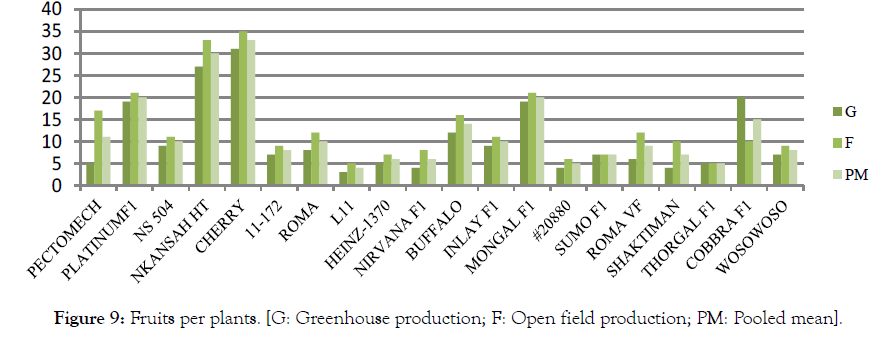
Figure 9:Fruits per plants. [G: Greenhouse production; F: Open field production; PM: Pooled mean].
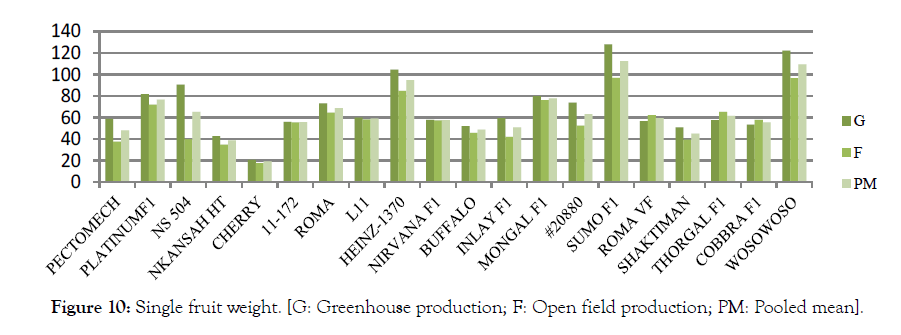
Figure 10:Single fruit weight. [G: Greenhouse production; F: Open field production; PM: Pooled mean].
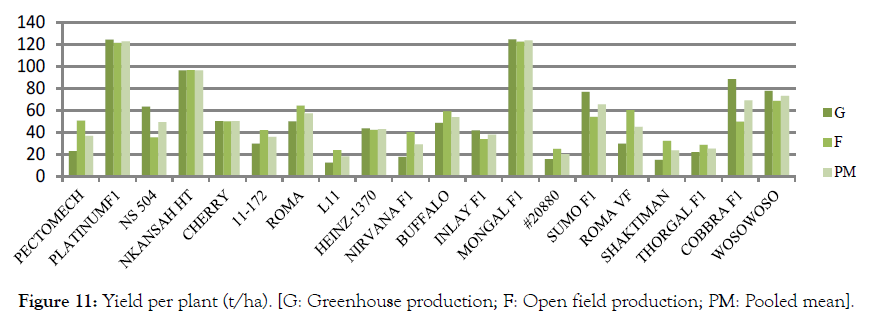
Figure 11:Yield per plant (t/ha). [G: Greenhouse production; F: Open field production; PM: Pooled mean].
The significant (p<0.01) mean squares recorded for location and G × L interaction suggested that the experimental locations were diverse. This resulted to differences in response of the genotypes to location changes as manifested in their varied performances across the two experimental conditions. The challenge then is the need to select or develop varieties tailored to each specific and/or multiple locations. Therefore, one of the most important rationales behind genetic variability studies is the identification of suitable environments where a trait which is intended to be improved upon is most likely to show a consistent expression. Environmental factors influenced the performance of the genotypes evidenced by the magnitude of variability in the genotype-by-location interaction (G × L). Plant height was significantly higher under greenhouse conditions as compared with the genotypes produced under field conditions. Similar observation was made by who reported 150.25 cm and 52.41 cm of plant height under greenhouse and field conditions respectively [13]. These authors found that relative humidity which was higher in the greenhouse environment resulted to higher vegetative growth and improved productivity of tomato fruit yield. The growth and productivity of tomato is significantly influenced by its reproductive or phenological characters. Understanding these economically important characters is essential in planning crop improvement programmes because genotypes with short reproductive or phenological cycle along with high fruit yield are normally selected for commercial cultivation [14]. The significance of genotype, location and Genotype × Location interaction for all the reproductive and phenological characters implied that variability existed among the genotypes evaluated in each location. Both genotypic and environmental factors influence tomato plants to flower early or delay in flowering [14]. Generally, the performances of the genotypes for reproductive and phenological traits were inconsistent across the experimental locations due to the interaction between genotype and the environment. Number of days to 50% flowering differed among the various genotypes. The presence of variability among tomato genotypes for number of days to flowering has been reported in earlier studies. Previous studies indicated that phenological traits of tomato such as number of days to flowering, fruit set and fruit maturity were earlier under greenhouse conditions as compared with results obtained under field conditions [15]. Variation in number of days to 1st flowering which ranged from 25 to 30 days after transplanting has been reported in previous studies [16]. Percentage fruit set is an important character for increasing the productivity of tomato in terms of fruit yield. It serves as a good indicator for determining the extent of resistance or tolerance of a genotype to the surrounding environmental conditions particularly temperature [14]. It is reported that higher percent fruit set is required to achieve high fruit yield [14]. High percentage fruit set was recorded under greenhouse conditions than that of the field and varied greatly among the experimental locations. Genotypes such as Platinum F1 (72.93%) and Nirvana F1 (47.76%) recorded maximum and minimum values for percent fruit set across locations. Earlier investigations reported minimum and maximum values of 50.33% to 84.09% [14], 72.84% to 86.21% and 83.1% to 93.9% [17,18]. Differences recorded by different authors may be due to differences in the genetic materials and locations evaluated. Genotype Platinum F1, Cherry, Sumo F1 and Nkansah HT showed a better mean performance for this trait. They are therefore considered as superior heat resistant or tolerant genotypes. Number of days to fruit maturity was higher under greenhouse conditions as compared with that of the field. The genotypes showed high variability for the trait in each location and across locations. Similar observations were previously reported by Nagalakshmi et al. and Cheema et al. [19,20]. Genotypes Nkansah Ht, Wosowoso, Cobbra F1 and Thorgal F1 showed early fruit maturity across locations and represent good genetic materials for increasing the productivity of tomato. An earlier study revealed that reproductive development traits including number of trusses per plant and number of fruits per truss were higher under greenhouse conditions than that of the field [15]. The results of the present study indicated that number of truss per plant and number of flowers per truss were higher under field conditions while number of fruits per truss was higher under greenhouse conditions. Such differences may result from differences in surrounding environment as well as differential response of different genotypes to different environmental conditions. A study reported that higher number of flower clusters contributes to increased fruit yield in tomato and this was attributed to inherent genetic factors [14]. Variability in reproductive development characters has been reported in previous studies and ranged from 6.9 to 8.6 for number of truss per plant 2.9 to 7.8 for number of flowers per truss and 1.72 to 5.11 for number of fruits per truss [21,22]. With respect to yield, the tomato genotypes generally showed diverse fruit yield performances which agreed with findings by other workers [23-25]. This was as a result of differences in number and type of genetic materials used, location as well as growing environment. A narrow difference in fruit yield was recorded between the genotypes produced under greenhouse and that produced under field conditions. Some genotypes including Pectomech, L11, Nirvanna F1, #20880 and Shaktiman performed poorly under greenhouse conditions indicating their poor adaptation to greenhouse conditions. Average tomato fruit yield as reported earlier was higher under polyhouse condition (80.6 t/ha) than that of the open field (57.2 t/ha) [26]. In a related study, phenological development and productive ability of tomato were compared and the results obtained revealed high fruit yield under polyhouse condition (81 t/ha) than that of the field (57 t/ha) [15]. Also, 8 tomato genotypes were evaluated under field conditions which revealed a low fruit yield of 6 117.30 – 11 359.2 kg/ha [8]. This was attributed to poor rainfall, high day and night temperatures in the experimental period, as well as attack by root knot nematodes. Other reports on tomato fruit yield differences among cultivars include that of who reported minimum and maximum yield of 15 907 kg/ha and 42 908 kg/ha respectively [27]. Similarly, recorded average fruit yield of tomato in a range of 135.10–1046.80 q/ha and that genotypes with medium and large numbers of fruits per plant produced more fruit yield as compared with those with large fruit sizes but smaller number of fruits per plant [14]. This observation agrees with the present study where genotype Nkansah HT with medium sized fruits and higher number of fruits per plant produced high fruit yield per plant [27].
Systematic breeding programmes aimed at improving tomato fruit yield require information on the nature and magnitude of variability in agronomic traits of the crop. Results of the present study revealed an existence of useful variability in the genotypes. Following the present findings, promising tomato genotypes based on their fruit yield (t/ha) under greenhouse conditions were Mongal F1, Platinum F1, Nkansah HT, Cobbra F1, Wosowoso, Roma, Sumo F1 and NS 504. Tomato genotypes Mongal F1, Platinum F1, Nkansah HT, Cobbra F1, Wosowoso, Roma, Sumo F1, Roma VF and Buffalo showed superior fruit yield under field conditions. Across the two locations, Mongal F1, Platinum F1, Nkansah HT, Cobbra F1, Wosowoso, Roma and Sumo F1 were superior genotypes for fruit yield. Most of the top performing genotypes for yield recorded higher scores for one or more yield component traits including number of fruits per plant, trusses per plant, single fruit weight and total fruit weight per plant. Generally, the performance of almost all the genotypes evaluated differed across locations due to the interaction between the genotypes and their environment. Thus, the expressions of most traits were influenced by genetic and environmental factors as well as their interaction.
This work was conducted with support from Vegetable and Environ Dome Greenhouse unit of the University of Ghana Forest and Horticultural Crops Research Centre (FOHCREC), Ghana.
Citation: Nkansah GO, Blay ET, Asante IK, Ochar K (2019) Evaluation of Selected Tomato (Solanum lycopersicum L.) Cultivars in Ghana for Superior Fruit Yield and Yield Component Traits. J Horttic 6:262. Doi: 10.35248/2376-0354.19.06.262
Received: 27-Sep-2019 Accepted: 14-Oct-2019 Published: 22-Oct-2019
Copyright: © Nkansah GO, et al. This is an open-access article distributed under the terms of the Creative Commons Attribution License, which permits unrestricted use, distribution, and reproduction in any medium, provided the original author and source are credited