Journal of Chromatography & Separation Techniques
Open Access
ISSN: 2157-7064
ISSN: 2157-7064
Research Article - (2018) Volume 9, Issue 2
This study examined fatty acid (FA) composition of muscle tissue of Longdong black goat and Longdong white Cashmere goat breed under reared systems. Approximately 86.31% of fatty acids were observed. Oleic acid was extensively the most abundant ranged from 22.98% to 26.02% of Longdong black and white Cashmere goat respectively. The mean amount of SFA and MUFA were about 21.46% to 34.82% respectively. PUFA were 30.02% of total FA composition. C20:4 were founded 12.14% in all muscles tissues. Compare to C20:5, C22:6 16.43%, 4.88% respectively. The amount of SFA: MUFA ratio was low in Longdong goat muscles tissues. PUFA and MUFA had higher amount female black muscles tissues. Females and males of both had great amount of C16:0, C18:0, ranged from 0.86% to 29.16%. C18:2 were found in 15.01%. The study found fatty acids composition in both Longdong goat breed (black and white cashmere) has some significant effect (P<0:05) in fatty acids proportions. The greater ratios of unsaturated fatty acids MUFA and PUFA high amount than saturated fatty acids SFA in goat muscle tissue and this indicate that Longdong goats breed are healthier and have the same type of fatty acids composition.
Keywords: Fatty acid; Longdong; Muscle tissues; Cashmere; Breed
The increasing pressure of world population and the need to raise living standards has made the production of meat more and better, and its more effective preservation, an important issue. Thus, progeny testing, based on carcass measurement, is being increasingly recognized as an efficient way of hastening the evolution of animals having those body proportions which are most desirable for the meat consumer [1]. The FA physical property which mostly affects quality is its melting point as it determines the firmness of the tissue at a particular temperature. Melting point increases as the carbon chain lengthens and decreases with the introduction of unsaturated linkages [2]. According to Madruga et al. [3], goat meat has advantages in comparison to other meats available in the market such as low fat, high digestibility, high protein, iron and unsaturated fatty acid levels. Trends for healthier diets could result in increasing demands for value-added products from non-traditional sources such as goat meat, which could lead to diet with decreased fat, less cholesterol, or reduced sodium [4]. The fatty acid composition of fat, usually has little influence on the market value of the carcass, for which the quantity of fat is of greater importance [5]. There are concerns nowadays regarding the negative effects of saturated fatty acids on human health. Generally, meat from ruminant animals such as beef and mutton contain higher levels of saturated fatty acids leading to low polyunsaturated, saturated FA ratios compared to pork, fish, and poultry [6]. Gas Chromatography (GC) is standard of the most common analyses in lipid research. Quantification of Fatty Acid Methyl Ester (FAME) by GC with FID has been effectively performed for some time, where detection with Mass Spectrometry (MS) has been used primarily for qualitative analysis of FAME. Nonetheless, the sensitivity and selectivity of MS methods supporter a quantitative role for GC/MS in FAME analysis, physical and chemical properties of lipids affect eating and keeping qualities of meat [7]. USDA Nutrient Database [8] reported that 100 g of raw goat meat has approximately 100 kcal, 5 g of saturated fat, 6 g of MUFA, 0.5 g of PUFA, and 10 mg of cholesterol less than the same proportion of ground beef and ground pork. About 0.20 mg of goat meat also has more riboflavin than the ground beef or ground pork of the same portion size. The shortage of calorie and fat content coupled with more riboflavin may be incentives to consume goat meat. Opportunities exist for goat meat because of its ecological image, dietetic and health qualities, and associated with religious holidays, along with the tendency of consumers toward natural foods [9]. Devendra reported that the polyunsaturated fatty acid is prevalent in the meat of goats, and a diet rich in unsaturated fatty acid is correlated with a reduced risk of stroke and coronary diseases [10]. There are about 48 Chinese indigenous goat breeds and all of them are a valuable reservoir in the world goat breed resource of 300-400 goat breeds [11]. Goat breeds are named by their places of origin and classified by their uses of a product. Meat is a food preferred by most consumers; however, it is a food classified with high fat, cholesterol, and saturated fatty acids contents and with low unsaturated fatty acids contents [3]. Chinese indigenous goat breeds formed some instinctive merits: extensively adaptability, strong disease resistant and cold resistant ability, and strong coarse fodder enduring ability, abundant breeds, manifold animal product, higher production capacity, and fast growth rate [11]. Several studies have shown that the fatty acid composition of ruminant meats is different from that of non-ruminants. The ratio of polyunsaturated (PUFA) to saturated fatty acids (PUFA: SFA), is lower because the rumen hydrogenates unsaturated fat from the diet [12]. Animal fat is important for human nutrition for its high energy value which is more than twice that of carbohydrates. Fat improves meat palatability as it affects its texture juiciness, and flavor as well as being important for meat preservation. Its degree of solidification affects the color of fat. Fat which is not fully solidified looks relatively grey or yellow [2]. Factors such as genotypes, slaughter age, feeding and mainly production systems influence considerably the chemical composition of goat meat [13]. Various ethnic groups that typically consume goat meat may have religious objections to consuming fat from other species [14]. With decreased fat, less cholesterol, or reduced sodium. The Longdong goat breeds (black and white cashmere) are famous breeds in Gansu area and they used their meat for different purposes and cook with different ways and the population thinks that it’s healthy to eat. Goat meat is an important meat in Huan County, which appreciated as they slaughtered regularly for special social occasions. The purposes of this study were to examine fatty acid (FA) composition of muscle tissue of Longdong goat breed (black and white cashmere) under reared system, and effects of sex and breed on fatty acid composition (SFA, MUFA, and PUFA) type.
Source of goat meat
All research involving animals was carried out in accordance with the Animal Welfare Act 1999 (New Zealand Government) and the guidelines of Gansu Agricultural University Animal Care Committee. Chinese indigenous breed Longdong black goats and White Cashmere goat were used, A total of 120 animals (female, n=60, male, n=60). 6-12 months age, which had an initial live weight of 11~16 kg, animals intact goats obtained from a commercial herd of Huan county located on the east of Gansu province northwest of China, December 2016, average temperature is 8.6°C- 9.9°C.
Sample collection
Samples from the muscle of five parts of muscle tissue were collected (2016) at Huan county in Gansu, China. The left side of the carcass weight without stomachs an intestine averaged 3.5~6.9 kg for females and 3.5~7 kg for males. Approximately 50 g (wet weight) of muscle tissue, (Sirloin, Shoulder, Shank, Flank, and Leg) were collected. All samples were vacuum packed into plastic bags before storage. The total dissected muscle tissue was minced in and stored frozen; in a freezer to prevent oxidation and structural changes in the fatty acids, samples were stored at-65°C.
Methods
Extraction of fatty acids: Approximately 50 g of muscle tissue was thawed, minced and homogenized in a FJ200-Shomogenizer (Shanghai Suoying Instruments, Shanghai, China) and 5 g sample was transferred to a 50 mL round flask. Then 8 mL BF3-methanol (14%) was added to the sample. Methylation of total fatty acids was performed under reflux at 90°C for 90 min, with shaking every 15 min. Following cooling on ice, the sample was removed with a 50 mL screw-cap tube. Saturated NaCl (9 mL) and hexane (5 mL) were added to the tube, which was vortexed and centrifuged (2810 × g) for 5 min at room temperature. The hexane fraction, containing the Fatty Acid methyl ester (FAME), was transferred to a tube containing 500 mg of Na2SO4 to remove moisture from the sample. An additional 5 mL of hexane was added to the original tube and vortexes again. The upper layer was transferred into the tube containing the Na2SO4. The extraction was repeated twice with 5 mL of hexane. The pooled fractions were evaporated to dryness at 35°C in a RE3000A rotary evaporator (Shanghai Yarong Instruments, Shanghai, China), reconstituted in 1 mL of HPLC grade hexane, and directly submitted for analysis by gas chromatographymass spectrometry (GC/MS).
Fatty acid analysis by GC/MS: Fatty Acids methyl ester (FAME) was analyzed by using a gas chromatograph (Agilent 6890 N) coupled to a mass spectrum detector (Agilent 5973 N) (Agilent Technologies Inc, Palo Alto, CA). Separation of FAME was accomplished on a fused silica capillary column DB-23 (30 m × 0.25 mm i.d, J&W Scientific, Agilent) with helium as the carrier gas (flow rate=1.0 mL min-1). Injector temperature is 260°C. The oven temperature program was as follows: 140°C for 4 min and 4°C min-1 to 230°C, held for 15 min. The temperature of the ion source and the quadrupole were 150°C and 230°C, respectively, while the MS transfer line was 230°C. Mass scan range was set from 40 to 550 amu. Fatty acids were identified by comparison of retention times with reference compounds purchased from Supelco, USA. Fatty acid contents had been expressed as percentage of total FAMEs analyzed based on the internal standard technique, using tricosanic acid C23:0 as an internal standard.
Statistical analyses: All data was submitted to analysis of variance (ANOVA) using the F test to compare the mean and to determine the significance of the effect of breed factor in a completely randomized design. Standard Error of Mean (SEM) were computed and tested using the same package.
Fatty acids of muscles tissue
Table 1 shows the MS identification of the main FA in Longdong muscles tissues. The main fatty acid was obtained Palmitic C16:0, Margaric C17:0, Stearic C18:0, Oleic C18:1 and Linoleic C18:2, C20:4 and C20:5 acid C22:6 were detected, covered the largest proportions in the muscle tissue of Longdong goat, approximately 86.31% (Table 2). Oleic acid C18:1 was the most abundant FA composition about 21.75% in males and 25.58% in females compared to other FA (Tables 3 and 4). Rule et al. stated that the greater values of oleic acid (C18:1) may be attributed to the greater animal biosynthesis from stearic acid (C18:0) [15]. Similar results were observed by Banskalieva et al. [5], provided that the major fatty acids compositions in muscle goats were Linoleic C18:2, Oleic C18:1, Stearic C18:0 and Palmitic C16:0 acids. Saturated fatty acids (SFA) were mainly C4:0, C12:0, C16:0, C17:0 and C18:0 with some of Myristic C14:0 acid concentrations about 36.54% in black goat and 24.75% in white cashmere goat FA composition, MUFA were Palmitic C16:1 in lower levels about 0.97% for females and 0.98% for males and a high levels proportion of Oleic C18:1 acid 21.75% in males and 25.58% for females. PUFA consists of Linoleic C18:2, Linolenic C18:3, Arachidonic C20:4, Eicosatetraenoic C20:5 and Docosahexaenoic C22:6 acids approximately about 26.17% of total FA of Longdong black goat and cashmere white goat. Such differences might be explained by the differences, between breeds. The total mean of FA composition was 7.73% for Palmitic C16:0, 11.47% for Stearic C18:0, 23.67% for Oleic C18:1 and 7.50% for Linoleic C18:2 acids regularly (Table 2). Mahgoub et al. approved that the values of stearic acid in goat’s meat under reared system ranging from 15.21% to 18.72% this result was approximately discovered in Longdong goat muscle tissues and the concentrations of these fatty acids have different locations on the carcass (Sirloin, shank, Shoulder, flank and Leg) [6]. Most of the fatty acid FA was distributed in the five locations with different proportions. Noted that SFA Palmitic C16:0 was found in a low value in black goats 0.43% and Stearic C18:0 had high levels about 16.37% at all carcass cut locations (sirloin, shank, shoulder, flank and leg) (Table 3). MUFA C16:1 was found in 0.98%, C16:1n9 7.43% and C16:1n11 1.79%. PUFA Linoleic C18:2 C20:4, C20:5 were found in high levels range from 5.94% to 8.64%, and C18:3, C22:6 acids also were found in the range of 1.78% and 2.86% respectively, in both sex (Table 2). Other fatty acid present in lower concentrations like C4:0, C12:0, C14:0 at 0.51%, 0.68% and 0.25% respectively. La Vega et al. have the same result that the muscle and adipose tissues of kids, coming from organic and conventional livestock production systems [16], are different only in some FA percentages. These less of concentration in fatty acid composition in the muscle tissue of meat may be referring to the kind of feed concentration they feed. The concentration of C18:1 is extremely higher than C18:2, C18:0 and C16:0 in all five cut locations of both goats (Table 2). Rao et al. also has the same result and reported that oleic acid as the major component in the fatty acid profile of goat meat [17]. The concentration of SFA in muscle tissues were ranging from 0.25% to 8.55% of total fatty acid composition. The C18:1 about 23.67% of fatty acids concentration of total MUFA in both Longdong goats. Potchoiba et al. [18] approved that 50.6% of the total mean concentration of Palmitic C16:1(n7, n11) was 1.92% to 1.69% in both goat muscle tissues. Other fatty acids were found C4:0, C12:0, C14:0. Margaric acid C17:0 was noticed in low level 0.66% in black goats compared to 1.4% in white Cashmere goat (Table 3). The concentration of SFA, MUFA, and PUFA were difference may depend on muscles tissues locations. SFA: MUFA ratio was low in Longdong white Cashmere goat muscle tissues. PUFA was being much higher in the muscle tissues. Oleic C18:1 acid was the main fatty acid in both goat muscle tissues. This the same result stated by Madruga et al. that the lipid deposition on the goat carcass only occurs when the animal reaches maturity or a body weight of 40.0 kg. Palmitic C16:0 and Stearic C18:0 were found in both goat muscle tissues with average proportion about 22.98%, 21.78% respectively. Wood reported that ruminants have higher saturated: unsaturated ratios compared to mono-gastric animals, but in Longdong goat breeds outcome that MUFA and PUFA were higher than SFA [2]. This may be due to the feeding type and the reared system. Fatty acid content of body tissues is affected by nutrition.
| Peak | R.T. | Area (Abund/min) | Fatty acid | Structure |
|---|---|---|---|---|
| 2 | 5.274 | 19130 | Butyric acid | C4:0 |
| 3 | 5.628 | 28236 | Lauric acid | C12:0 |
| 4 | 7.989 | 53113 | Myristic acid | C14:0 |
| 6 | 10.978 | 18506 | Palmitic acid | C16:0 |
| 7 | 13.367 | 22399 | Hexadecenoic acid | C16: 1n9 |
| 8 | 14.127 | 63578 | Palmitoleic acid | C16:1 |
| 9 | 14.733 | 81776 | Hexadecenoic acid | C16:1n11 |
| 11 | 14.933 | 11360 | Margaric acid | C17:0 |
| 12 | 15.647 | 14943 | Stearic acid | C18:0 |
| 14 | 16.156 | 39045 | Oleic acid | C18:1 |
| 16 | 17.899 | 19055 | Linoleic acid | C18:2 |
| 17 | 19.402 | 40477 | Linolenic acid | C18:3n3 |
| 21 | 19.928 | 13596 | Arachidonic acid | C20:4 |
| 22 | 20.551 | 47653 | Eicosatetraenoic acid | C20:5 |
| 25 | 21.957 | 82754 | Docosahexaenoic acid | C22:6 |
Table 1: MS identification of compounds names.
| Female | Male | |
|---|---|---|
| SFA | ||
| C4:0 | 0.51a ± 0.28 | 0.51a ± 0.39 |
| C12:0 | 0.20a ± 0.03 | 0.68a ± 0.41 |
| C14:0 | 1.03a ± 0.90 | 0.25a ± 0.03 |
| C16:0 | 8.21a ± 7.86 | 7.25ab ± 6.74 |
| C17:0 | 0.84a ± 0.23 | 1.26b ± 0.55 |
| C18:0 | 14.39a ± 1.81 | 8.55ab ± 7.97 |
| MUFA | ||
| C16:1 | 0.97a ± 0.32 | 0.98a ± 0.34 |
| C16:1n11 | 0.40a ± 0.14 | 3.19a ± 1.31 |
| C16:1n9 | 5.82ab ± 5.48 | 9.04a ± 1.22 |
| C18:1 | 25.58a ± 2.58 | 21.75a ± 2.11 |
| PUFA | ||
| C18:2 | 6.37ab ± 6.11 | 8.64a ± 7.62 |
| C18:3 | 2.09a ± 0.57 | 1.78a ± 0.85 |
| C20:4 | 5.94ab ± 3.22 | 6.19a ± 3.76 |
| C20:5 | 8.85ab ± 5.49 | 7.58ab ± 4.57 |
| C22:6 | 2.02a ± 0.62 | 2.86a± 0.03 |
| Total | ||
| Ʃ SFAa | 42.77a ± 11.15 | 18.51a ± 0.63 |
| Ʃ MUFAb | 32.65a ± 2.95 | 33.01b ± 3.82 |
| Ʃ PUFAc | 25.29ab ± 3.79 | 27.06ab ± 7.70 |
| MUFA: SFA | 0.80a ± 0.14 | 1.80a ± 0.27 |
| PUFA: SFA | 0.66a ± 0.26 | 1.49a ± 0.45 |
Table 2: Fatty acid composition mean and standard error of mean (SEM) of Longdong goat (black and white Cashmere) muscle tissue of males and females.
| Male | Female | Mean | SEM* | |
|---|---|---|---|---|
| SFA | ||||
| C4:0 | 0.12 | 0.23 | 0.17 | 0.05 |
| C12:0 | 1.09 | 0.17 | 0.63 | 0.46 |
| C14:0 | 0.28 | 1.94 | 1.11 | 0.83 |
| C16:0 | 14.00 | 16.07 | 15.03 | 1.03 |
| C17:0 | 1.82 | 1.07 | 1.44 | 0.37 |
| C18:0 | 0.58 | 12.58 | 6.58 | 6.00 |
| MUFA | ||||
| C16:1 | 0.64 | 0.65 | 0.64 | 0.00 |
| C16:1n11 | 4.5 | 0.54 | 2.52 | 1.98 |
| C16:1n9 | 7.82 | 0.34 | 4.08 | 3.74 |
| C18:1 | 23.87 | 28.17 | 26.02 | 2.15 |
| PUFA | ||||
| C18:2 | 16.26 | 12.49 | 14.37 | 1.88 |
| C18:3 | 2.63 | 2.66 | 2.64 | 0.01 |
| C20:4 | 9.96 | 9.17 | 9.56 | 0.39 |
| C20:5 | 3.01 | 3.36 | 3.18 | 0.17 |
| C22:6 | 2.89 | 1.4 | 2.14 | 0.74 |
| Total | ||||
| Ʃ SFAa | 17.89 | 32.06 | 24.97 | 7.08 |
| Ʃ MUFAb | 36.83 | 29.7 | 33.26 | 3.56 |
| Ʃ PUFAc | 34.75 | 29.08 | 31.91 | 2.83 |
| MUFA: SFA | 2.06 | 0.93 | 1.49 | 0.57 |
| PUFA: SFA | 1.94 | 0.91 | 1.42 | 0.52 |
Table 3: Fatty acid compositions and standard error mean (SEM) of muscles tissues of Longdong white cashmere.
| Male | Female | Mean | SEM* | |
|---|---|---|---|---|
| SFA | ||||
| C4:0 | 0.91 | 0.79 | 0.85 | 0.06 |
| C12:0 | 0.27 | 0.24 | 0.255 | 0.015 |
| C14:0 | 0.22 | 0.13 | 0.175 | 0.04 |
| C16:0 | 0.51 | 0.35 | 0.43 | 0.08 |
| C17:0 | 0.71 | 0.61 | 0.66 | 0.05 |
| C18:0 | 16.53 | 16.21 | 16.37 | 0.16 |
| MUFA | ||||
| C16:1 | 1.33 | 1.3 | 1.315 | 0.015 |
| C16:1n11 | 1.88 | 0.26 | 1.07 | 0.81 |
| C16:1n9 | 10.27 | 11.31 | 10.79 | 0.52 |
| C18:1 | 19.64 | 23 | 21.32 | 1.68 |
| PUFA | ||||
| C18:2 | 1.02 | 0.26 | 0.64 | 0.38 |
| C18:3 | 0.93 | 1.52 | 1.22 | 0.29 |
| C20:4 | 2.43 | 2.72 | 2.57 | 0.14 |
| C20:5 | 12.15 | 14.35 | 13.25 | 1.1 |
| C22:6 | 2.83 | 2.65 | 2.74 | 0.09 |
| Total | ||||
| Ʃ SFAa | 19.15 | 18.33 | 18.74 | 0.41 |
| Ʃ MUFAb | 33.12 | 35.87 | 34.49 | 1.37 |
| Ʃ PUFAc | 19.36 | 21.5 | 20.43 | 1.07 |
| MUFA: SFA | 1.73 | 1.96 | 1.84 | 0.11 |
| PUFA: SFA | 1.01 | 1.17 | 1.09 | 0.08 |
Table 4: Fatty acid compositions of muscles tissues of Longdong goats breeds (Longdong black).
Effect of sex
Female goats in both (Longdong black and white Cashmere) had high levels of mean percentage of C16:0, C18:0, C18:1, C18:2 ranging from 6.37% to 25.58% and lower levels of C4:0, C12:0, and C14:0 acids ranging from 0.13% to 1.03%. Black goat males had higher levels of C16:0, C18:0, C18:1, C16:1n9, C18:2, C20:4, acids (7.25%, 8.55%, 21.75%, 9.04%, 8.64% 6.19%, and 7.58%) respectively (Table 3).
However, Dhanda et al. [19] approved similar result, that Oleic and Linoleic acids increased in the intramuscular adipose tissue of male goats at 254 days of age compared with younger, counter parts at 93 days of age. Muscle tissue of the Longdong goat breeds contained an average 30.64% and 32.83% of SFA: MUFA respectively (Table 2). The effects of sex on FA composition in cattle are small and may be explained in terms of differences in overall fat contents [2]. There were some significant (P< 0:05) in the amount of fatty acid composition between breeds (Longdong black goat and white Cashmere goat) in C4:0, C12:0, C14:0, C18:3, acids proportion. There no differences were observed between Fatty acids composition muscle tissues types. Concentrations of C14:0, C12:0, C4:0 acids had lower levels of FA of Longdong goat muscle tissues, white Cashmere goat females have lower levels of SFA C12:0 0.17% and higher levels of C16:0 acids percentages 16.07% compared to Longdong black goat females which had higher levels of C18:0 acids (Table 2). Myristic C14:0, Palmitic C16:0 and Stearic C18:0 acids, contributing more to the SFA profile. The Oleic acid C18:1, Linoleic C18:2 and Archidonic C20:4, C20:5 acids values were found in the male of both black and white Cashmere goat with a high percentage compare to the female. Eicosatetraenoic acid C20:5 were found in higher levels 14.35% in black females and low in white female Cashmere goat 3.36% (Table 4). Also achieved that the saturated fatty acids Palmitic C16:0 had higher values in white Cashmere goat muscle tissues male and female, and Stearic C18:0 acids had higher values in Longdong black goat males and females (Table 4). Also observed that Longdong black and Longdong white Cashmere goat has a high concentration of MUFA in both 32.4% to 33.26% respectively, compared with SFA 36.54% to 24.75% (Table 3). Fatty acids composition of muscles tissue of Longdong goat had higher concentrations of total MUFA and PUFA compared to the concentration of SFA. However, observed that the effect of essential FA depends on the PUFA: MUFA and PUFA: SFA ratios. That the high C18:1 content and the consequent increase of the PUFA: SFA ratio is important to reduce the risk of cardiovascular diseases. Hence, this index is used to calculate the risk factor of foods, and it is strongly recommended that this ratio should be at least 0.4 [20] or 0.12 as the upper limit [21]. Longdong goat muscle tissues have the same result which PUFA: SAF was in high ratio.
Effects of breed
White Cashmere goat muscles tissues had low amount of saturated fatty acids 24.75% (SFA) than in Longdong black goat muscles tissues 36.54% (Table 4). Obtained low amount of lauric acid (C12:0) 0.63% Myristic acid (C14:0) 1.11% and Buttyric acid (C4:0) 0.17% compared to high amount of Palmitic acid (C16:0) 15.03% Stearic acid (C18:0) 6.58%. Monounsaturated fatty acids (MUFA) were obtained high amount Hexadecenoic acid C16:1n9 4.08%, Oleic acid (C18:1) 26.02% in the Longdong white Cashmere goat. However, observed high amount of Hexadecenoic acid C16:1n9, 10.79% in Longdong black goat with high amount of Oleic acid (C18:1) 21.32%. The most polyunsaturated fatty acids (PUFA) observed with high amount of white Cashmere goat were Linoleic acid C18:2 constituted 14.37%, Arachidonic acid C20:4 9.56% Linolenic acid C18:3 2.64%, and Eicosatetraenoic acid C20:5 3.18%. Longdong black goat had high amount of Eicosatetraenoic acid C20:5 13.25% than white Cashmere goat. Oleic acid (C18:1) obtainable the major contribution to the FA composition in the muscles tissue of goats from the two breed (Table 2). Similar to those detected by Tshabalala et al. [22] in goat meat. Palmitic C16:0 and linoleic acids C18:2 had no differences between two breeds; however, the amount of stearic acid (C18:0), contributing more strongly to the saturated fatty acids composition of the slaughtered animals. This put forward that a significant increase in FA composition of Longdong goat muscle tissues may occur after one-year or 16 kg body weight. In this study, the values of PUFA: SFA ratios were found from 0.97 to 1.06, above those suggested by Wood et al. who recommended values above 0.4 to prevent illnesses associated with the consumption of fats.
The separating and knowing the chemical structure of FA composition from goat meat is important and being the essential step in explaining meat compounds. Figure 1 shows the mass spectrum of oleic C18:1, linoleic C18:2, and stearic C18:0. It can be observed that after the ionization, a fragmentation of the molecule occurred, which resulting in 12, 11 and 19 signals. For all the compound series the peak intensity decreases with the increase of the distance between the methylene group and the position of the double bond in the ester chain. Observed the relative intensity of the peaks rise methylene group away from the carbonyl group. The abundance of the ions, corresponding to the hydrogen transposition, is higher than the abundance of the ions generated after the double transposition.
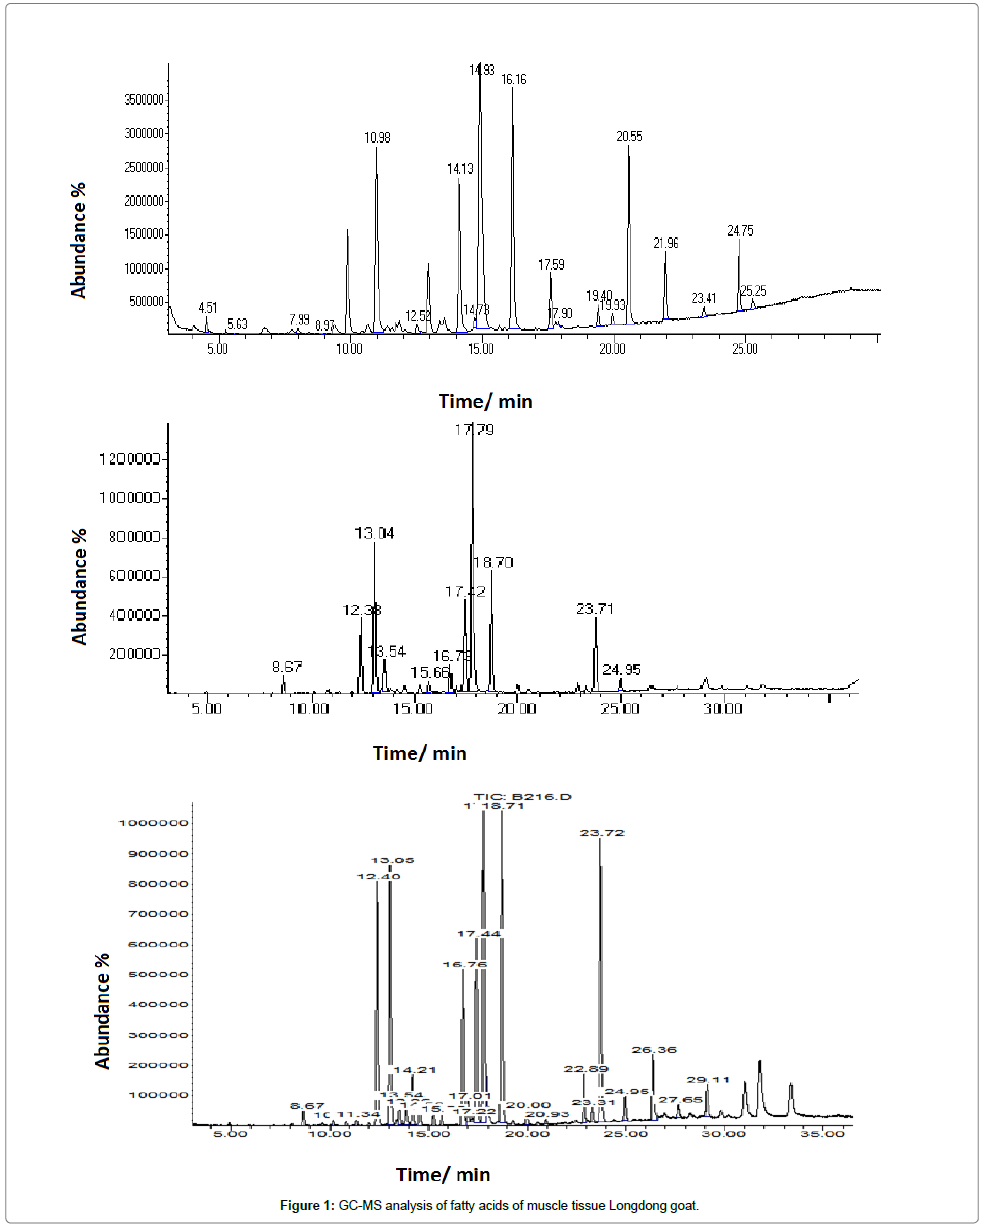
Figure 1: GC-MS analysis of fatty acids of muscle tissue Longdong goat.
However, it was investigated that the cumulative effects of the chain length and their position of the double bond on the intensity of the transposition of ion detecting the peaks of the spectra of the methyl ester are lower than others compound with saturated chain, sometimes the group cannot reach the minimum distance. In addition to, the FAs Unsaturated and polyunsaturated, which are very essential in the component of triglycerides, are identified by characteristics of fragmentation patterns. The acyl ions of oleic acid C18:1 are characterized by loss of a hydrogen leading to pairs of M+ ions at the expected mass and 1 Da less, with the pair at m/z 296 Da and the ions is low. Polyunsaturated are even more canted to hydrogen loss large at linoleic acid C18:2 with the pair at m/ z 294 Da. In stearic C18: 0, the ion at m/z 298 is actually larger. The result demonstrated that Oleic C18:1, Palmitic C16:0, Stearic C18:0, Linoleic C18:2, and Arachidonic C20:4 acids, were the main dominant fatty acid composition in all muscle tissues of both Longdong goat breeds. However, greater concentrations for MUFA in all Cashmere goat and Longdong black goat were observed. Lee cited that USDA, reports that 100 g of raw goat meat has approximately 100 kcal, 5 g of saturated fat, 6 g of MUFA, 0.5 g of PUFA, and 10 mg of cholesterol less than the same portion of ground beef and ground pork [23]. A high concentration of oleic acid in the muscle tissues of goats has been obtained stearic and oleic acids. Banskalieva et al. mentioned Palmitoleic acid in its cis form is Hexadecenoic acid (C16:1n9-C16:1n11) represents approximately 5.85% of the mono-unsaturated fatty acids (MUFA) [24]. Separation and compound identification methods represent steps in the analysis of the chemical composition [25]. The total mean of MUFA and PUFA were higher than SFA (Table 2). The n-3 FAs are considered the most important dietary FA for human health. Current human health recommendations include a dietary n-6: n-3 FA optimum of 2.0-2.5, but most human foodstuffs have a ratio nearer to 5.0-10.0. Previous researchers reported the same result that levels of branched chain and odd-numbered fatty acids in subcutaneous fat were higher in goats than lambs [21]. In addition, to increase in the concentration of myristic (14:0) 0.8% and palmitic (16:0) 22.98% for both goats. Mahgoub et al. and Santos et al. [26] reported that meat from males had higher amount of C15, C18:2 and C18:3 but lower levels of total C10, C14, C16, C18 and C18:1 than meat from females. Generally, according to Potchoiba et al. [18]. Wood et al. stated that the overall fat content of the animal and muscle have an important impact on the proportionate fatty acid composition because of the different fatty acid compositions of neutral lipid and phospholipid. Genetic effects play an important role in fatty acid profiles of ruminant tissues and products [4]. The formed fragments can keep enough energy to separate through a similar process; also, can be subjected to transposition reactions [27,28]. In the mass spectra of Unsaturated, and Long chain compounds there was also observed strong peak corresponding to a double hydrogen transposition. The majority of hydrogen reversals occur by losing or effective gaining of one or more hydrogen atoms from the electrically charged fragment. These intra-molecular migrations of 2 hydrogen atoms, and double hydrogen transpositions, occur either before or after the break of weak bonds in the molecule [29,30]. The fragmentation results both in positive ions as well as radicals with odd number of electrons and with positive charge. Due to the fact that both the radical the molecular ion peak of straight (long) chain esters is sometimes noticeable. The prevalence of the fragments described earlier is dependent on the size of each part of the ester.
This study shows that GC/MS technique can be consider being valuable tools, for characterizing and separating FAs composition or volatile compounds of meat. Longdong goats were highlighted by the high amount of fatty acid composition (MUFA, PUFA and SFA) in the muscles tissues. These differences may be referring to genetic factors.
The authors are grateful to the Department of Gansu Key Lab of Herbivorous Animal Biotech, College of Animal Science for their financial support and Gansu provincial key lab of arid land crop science. Gansu University of Agriculture, Lanzhou, Gansu, China College of Animal Science and the staff for assistance in animal management and technical work.