Journal of Geography & Natural Disasters
Open Access
ISSN: 2167-0587
![]() +44-77-2385-9429
+44-77-2385-9429
ISSN: 2167-0587
![]() +44-77-2385-9429
+44-77-2385-9429
Research Article - (2023)Volume 10, Issue 3
This paper is an attempt to delineate the flood area of Sagar Island after the event of cyclone ‘YAAS’. Delineation of such hazard is very difficult due to lack of geospatial data and technology. This paper tries to Use Open Source Data (USGS) and software packages (QGIS) which can be used to implement most recent technology available for the assessment of flood area in Sagar Island after the event of cyclone ‘YAAS’. For this study Landsat 8 OLI and TIRS (Free data source-USGS Earth Explorer) data have been used. An earnest attempt has been made to implement a complete process of hazard mapping of flood using remotely sensed data for both pre and post event of cyclone ‘YAAS’ in Sagar Island. This study tries to map both flood hazard and land use land cover of study area systematically for risk assessment. Built up area has been extracted by using NDWI, NDVI and NDBI images. For flood hazard mapping, thresholding of NIR is being deployed. After mapping both flood hazard and exposure, accuracy assessment has been carried out. Final map has been obtained by overlay analysis of hazard and exposure.
Cyclone ‘YAAS’; Sagar island; Flood hazard; Exposure mapping; Risk mapping; Land Use Land Cover (LULC)
Flood is relatively high flow of water that overflows banks and spreads over flood plains. Flood causes problem for inhabitants, crops and vegetation. Flood mapping is extremely important for relief effort immediately after flooding. Risk due to flood is a function of hazard, exposure and vulnerability [1]. Sagar Island flood event triggered due to heavy rain and storm surges caused by the tropical cyclone YAAS which started as a low-pressure area formed over the North Andaman sea and adjoining East-central Bay of Bengal On May 22, 2021. On the next day, at 09:30 UTC, the disturbance intensified into a depression. The system subsequently intensified into a deep depression at 15:00 UTC on May 23. On the following day, at 02:30 UTC, the system further intensified into a cyclonic storm and was given the name YAAS. YAAS crossed the northern Odisha coast around 20 km South of Balasore at its peak intensity as a very severe cyclonic storm on May 26. YAAS made landfall North of Dhamra port and South of Bahanaga around 09:00 IST (03:30 UTC) on May 26, 2021. Extremely heavy rainfall at isolated places over Jhargram, Medinipur, South 24 Parganas specially in Sagar Island on 27th May leading to extreme flooding, destruction of thatched houses/extensive damage to kutcha houses, damage to standing crops, plantations and vegetation. Earthen embankments were also severely damaged (Figure 1).

Figure 1: Maps of West Bengal, India, Sagar Island.
Study area
Sagar is the biggest Island of the Sundarban delta [1]. It is situated in the estuarine of river Hugli. It is surrounded by Hugli River in the North, Muriganga river in the East and Bay of Bengal in the South. The landmass of the Island extends from 21°37’21’’ N to 21°52’28’’ N latitude and 88°01’46’’ E to 88°09’25’’ E longtitude. Sagar Island covers an approximate area of 235 km2. The length of the island from North to South is 26 km and has a maximum width of 12 km. The island is only 6.5 m above sea level [2]. The island is frequently ravaged by tropical cyclone and influenced daily by tidal fluctuations. That’s why Sagar island is geomorphically very active and environmentally very sensitive [3].
Data
For this study Landsat 8 OLI and TIRS (free data source-USGS earth explorer) data have been used for flood mapping. For carrying out the change analysis, both pre and post flood event images have been utilized (Figure 2).

Figure 2: Map of Sagar Island.
Flood hazard mapping
Water is characterised by low reflectance in Near-Infrared (NIR) region of the spectrum and high reflectance in lower wavelengths. So water bodies can be delineated using Normalized Difference Water Index (NDWI) and thresholding on NIR (band 5 for Landsat 8) [4]. In the final step, pixel to pixel comparison is carried out for both pre and post event of cyclone YAAS to derive the extension of flooding. The rules for deciding flooded and non-flooded pixels can be summarised as following (Figures 3 and 4).

Figure 3: The rules for deciding flooded and non-flooded pixels.
Figure 4: The rules for non-flooded pixels.
Water-water: If a pixel is classified as water on the pre-flood image and post flood image, the pixel will not be considered as flooded. Those pixels would help to identify the regular water bodies.
Non-water-water: If a pixel is classified as non-water in pre flood image and water in the post flood image, the pixel should be considered as flooded.
Non-water-non-water: If a pixel is classified as non-water on both pre and post flood images, the pixel will be considered as non-flooded [5].
Water-non-water: If a pixel found is classified as water on the pre-flood image but non-water in post flood image, the pixel will be considered as changes in land use or due to the presence of cloud cover (Figures 5 and 6).

Figure 5: Pre-flood image.

Figure 6: Post flood image.
Exposure mapping
This study utilises approach proposed by Xu. This approach involves transformation of landsat data to a 3 band index using Soil Adjusted Vegetation Index (SAVI) (equation 1), NDBI (equation 2) and Modified Normalized Difference Water Index (MNDWI) (equation 3). These transformation would help to identify major urban land cover type generally present in the study area i.e. vegetation, built-up area and open water. The three images produced from these indexes are then combined to form a new image (Figures 7 to 9) [6].
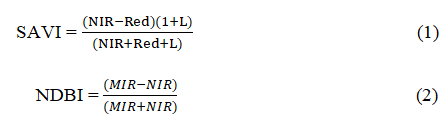
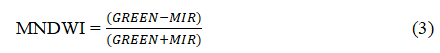

Figure 7: Sagar Island (SAVI, Landsat 8).

Figure 8: Sagar Island (MNDWI, Landsat 8).

Figure 9: Sagar Island (NDBI, Landsat 8).
SAVI, MNDWI and NDBI images highlight vegetation, water and built-up area in bright tones. These images make classes more separable and help to facilitates classification procedure.
Risk mapping
The overlay analysis of the flood hazard map and the exposure map has been carried out to delineate the build-up area under flood hazard. The overlay analysis of flood hazard map and exposure map helps to delineate the built-up area under flood hazard. This map marks up the areas which are flooded post YAAS event [7]. It is also important to keep in mind that actually risk due to hazard varies depending upon the type of exposure present within the hazard extent. Life risk would be higher if the hazard covers a residential region and economic risk would be higher if the hazard covers an industrial region (Figures 10 and 11).

Figure 10: Sagar Island (FCC MAP, 2021).

Figure 11: Sagar Island (Flood hazard map).
Land use/land cover classification
Unsupervised classification technique was performed using all spectral bands in each satellite image. This is widely adopted classification algorithm. The satellite images of both pre and post cyclone event were subjected to produce land use land cover classes. These include feature extraction, identification and mapping of following six land cover and land use classes: Vegetation, water body/flood, agricultural land, settlement, sand bar and bare soil. The results are shown in Figs for pre and post cyclone YAAS event respectively [8].
LULC map of landsat 8 imagery for Sagar Island before the event of cyclone YAAS
The unsupervised classification of the landsat image before the event cyclone YAAS yielded the LULC classes shown in Figure 12. The classification of land area of vegetation is 69.35 sq km, representing 28.76% of the total area. This is basically found in the South Eastern part (Chemaguri and Bamkimnagar Mangrove forest area) with the highest concentration. Likewise, regular water bodies and agricultural land covers 31.10 sq km (12.90%) and 76.73 sq km (31.82%) respectively, and are mostly scattered throughout the island. The settlement covers an area 26.22 sq km (10.87%) and is located mainly within patches around the tidal creeks [9]. Sand bar and bare soil cover an area 18.34 sq km (7.61%) and 19.41 sq km (8.05%) respectively (Table 1).
| Classes | Area (sq km) | Percentage |
|---|---|---|
| Vegetation | 69.35 | 28.76 |
| Water body | 31.1 | 12.9 |
| Agricultural land | 76.73 | 31.82 |
| Settlement | 26.22 | 10.87 |
| Sand bar | 18.34 | 7.61 |
| Bare soil | 19.41 | 8.05 |
| Total | 241.14 | 100 |
Table 1: Classification of the lands at image for sagar Island before the event of cyclone YAAS.
LULC Map of landsat 8 imagery for sagar Island after the event of cyclone YAAS
The unsupervised classification of the Landsat image after the event cyclone YAAS yielded the LULC classes shown in Figure 13. The classification of land area of vegetation is 55.65 sq km, representing 23.08% of the total area. Likewise, water bodies/flood water and agricultural land covers 69.09 sq km (28.65%) and 63.57 sq km (26.36%) respectively. The settlement covers an area 21.82 sq km (9.05%). Sand bar and bare soil cover an area 14.41 sq km (5.97%) and 16.59 sq km (6.88%) respectively (Table 2) [10].
| Classes | Area (sq km) | Percentage |
|---|---|---|
| Vegetation | 55.65 | 23.08 |
| Water body | 69.09 | 28.65 |
| Agricultural land | 63.57 | 26.36 |
| Settlement | 21.82 | 9.05 |
| Sand bar | 14.41 | 5.97 |
| Bare soil | 16.59 | 6.88 |
| Total | 241.14 | 100 |
Table 2: Classification of the lands at image for sagar Island after the event of cyclone YAAS.
Accuracy assessment of LULC classes
Accuracy assessment is a significant component of image classification to determine the precision of the LULC map. The higher level of accurateness defines the prominence of the thematic mapping. An accuracy appraisal was executed on the landsat 8 (OLI classified image which generated an assessment statement containing an error matrix, overall accuracy and kappa statistics.
An overall classification accuracy of 71.35% and a kappa coefficient (overall kappa statistics) of 0.6692 was achieved [10]. None of the LULC classes recorded accuracy below 50% (Figures 12 and 13).

Figure 12: Sagar Island.

Figure 13: Sagar Island after the event cyclone YAAS.
LULC change before and after the event of cyclone YAAS
Vegetation, agricultural land and settlement are severely affected by the cyclone YAAS. 13.69 sq km of vegetation area gets inundated due to the flood occurred during the cyclone. Similarly 13.16 sq km of agricultural land and 4.40 sq km area of settlement get flooded after the event of cyclone YAAS. The mouzas which are severely affected by flood occurred during the cyclone are as following; Dhablat, Shibpur at South; Chemaguri, Sumatinagar at South-East; Mritunjaynagar, Shikarpur at East; Muriganga, Companirchar, Kachuberia at North; Sapkhali, Krishnanagar, Chakfuldubi at West and Kamalpur at central part of sagar Island. Areas are shown with red circles in the (Figure 14 and Table 3).

Figure 14: Sagar Island after the event of cyclone YAAS.
| Classes | Area (sq km) before YAAS | Area (sq km) after YAAS | Area (sq km) under flood |
|---|---|---|---|
| Vegetation | 69.35 | 55.65 | 13.69 |
| Agricultural land | 76.73 | 63.57 | 13.16 |
| Settlement | 26.22 | 21.82 | 4.4 |
| Sand bar | 18.34 | 14.41 | 3.93 |
| Bare soil | 19.41 | 16.59 | 2.81 |
Table 3: LULC change before and after the event of cyclone YAAS.
The quick assessment of risk caused by flooding is very critical. This study attempts mapping both flood hazard and LULC for risk assessment caused by flood due to the cyclone YAAS. This study of sagar Island using geospatial technology can provide accurate, cost effective and instant information. Land use appears as one of the significant layer determining the regional risk. From 1975 to 2015 in the context of sagar Island, continual deforestation of mangrove forest has been done. Mangrove and estuary vegetation were eroded at Gobindpur, Sumatinagar and Dhublat. Most of the embankments are made of earthen materials. Breach of these embankments especially along the eastern coast line of sagar Island further enhances vulnerability and flood risk for the people living in this area. The eastern part of the island is eroding at faster rate as it is exposed to the Muriganga estuary which is shifting towards the island.
Coastline of Gangasagar in the south and Bankimnagar on the West is accreting. But the status of mangroves in the vicinity of Beguakhali and Ganga Sagar on the Southwest coast is critical due to anthropogenic pressure and wave action. Places where erosion is severe, the condition of the coastal vegetation, especially mangroves, is critical. Collapse of sea walls and earthen embankments reveal that control of encroachment of fragile coastal zones, over exploitation of biotic and aquatic resources, and afforestation of mangroves at suitable locations could help in control coastal erosion to a certain extent.
Citation: Das KK (2023) Flood Hazard Mapping of Sagar Island during Cyclone ‘YAAS’ Using Remote Sensing and GIS. Geogr Nat Disasters. 13:272.
Received: 25-Feb-2023, Manuscript No. JGND-23-21943; Editor assigned: 27-Feb-2023, Pre QC No. JGND-23-21943 (PQ); Reviewed: 13-Mar-2023, QC No. JGND-23-21943; Revised: 05-May-2023, Manuscript No. JGND-23-21943 (R); Published: 12-May-2023 , DOI: 10.35841/2167-0587.23.13.272
Copyright: © 2023 Das KK. This is an open-access article distributed under the terms of the Creative Commons Attribution License, which permits unrestricted use, distribution, and reproduction in any medium, provided the original author and source are credited.