Journal of Geology & Geophysics
Open Access
ISSN: 2381-8719
ISSN: 2381-8719
Research - (2022)Volume 11, Issue 1
The present study aims to recognize, characterize and establish the criteria of the Oligo-Miocene unconventional igneous intrusion fractured reservoir in Rudeis-Sidri Field, Gulf of Suez, Egypt. Recently the Brown field in the Gulf of Suez province started to produce oil from their unconventional igneous intrusions fractured reservoir that located along the eastern marginal of the field. Fractured unconventional igneous intrusion reservoirs are much more difficult and expensive to evaluate and to build modelling as compared to the conventional reservoirs. The key of exploration within the heterogens unconventional igneous intrusion reservoirs is to recognize and predict the fracture network and pattern. This work identified the fractured network, using integrated Imaging, anisotropy and core data analysis in Rudeis-Sidri Field, Egypt. Fractures were detected, which created enhanced porosity and permeability, allowing for hydrocarbon accumulated and trapped. Imaging (OMRI) data interpretation have characterize of the intensity, orientation and fracture types, which indicated that, the fracture acted as a reservoir, that is potentially charged by the nearest source rock.
As a result, the combination and integration of the available well data (OMRI, Anisotropy and Core Data) have successfully recognized the characterization of unconventional igneous intrusions fracture reservoir in Rudeis-Sidri field. This can be a good reservoir, in combination with fracing, which are confirmed by production data.
Unconventional igneous intrusion; Fractured reservoir characterization; Imaging data
The Gulf of Suez is one of the most important hydrocarbon provinces in Egypt. Rudeis-Sidri oil field lies on the eastern side of the Gulf of Suez, as shown in Figure 1. Basement reservoirs are documented in several countries, such as Algeria, China, Vietnam, Canada, India, Yemen and Egypt. The fractured lithology could be sandstone, carbonates or basement. It has been subjected to intensive exploration activities, since the early last Century [1]. The most difficult problem associated with the fractured basement reservoir is to evaluate their capacity and reserve [2]. In this concern, several contributions were introduced to evaluate the fractured basement reservoirs, the definition of basement is adopted, in which the basement rocks are considered as any metamorphic or igneous rocks, in spite of the age unconformably overlain by the sedimentary sequence [3].
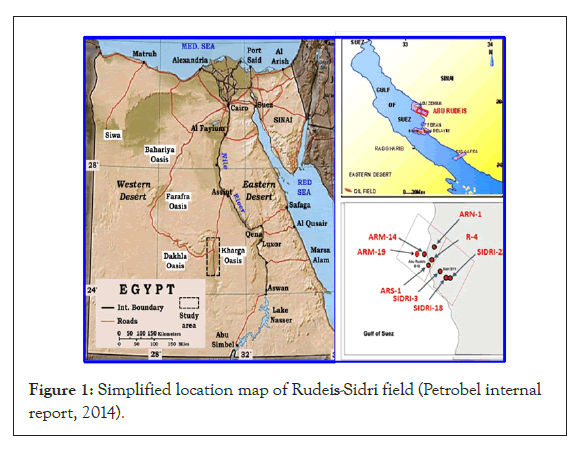
Figure 1: Simplified location map of Rudeis-Sidri field (Petrobel internal report, 2014).
The study started with ARM-14 well, as an exploratory well shown in Figure 1, after achieving unexpected igneous intrusion reservoir target, that was confirmed by production test. Challenge was to recognize the characterization and prediction criteria of the unconventional igneous intrusion fracture reservoir in Rudeis- Sidri Field. Review of eight bore holes distributed throughout Rudeis-Sidri field was done. These wells are ARM-14, ARM-19ST, Rudeis-4, Sidri-3, Sidri-18, Sidri-22, ARN-1 and ARS-1. The available data are Compensated Spectral Natural Gamma Ray (CSNG), Array Compensated True Resistivity (Array from RT-10 as shallow resistivity, RT-30 as medium resistivity and RT-90 as deep resistivity), Wave-Sonic Transit Time-TM, Cross Dipole. Acoustic Tool-LOGIQ (WSTT-1), Spectral Density Logging Tool (SDLT), Dual-Spaced Neutron Tool (DSNT), Photo Electric Absorption (PE) curve, Oil Mud Reservoir Imager (OMRI), Reservoir Description Tool Pressure and Sampling (RDT) and open-hole production test results. Beside such geophysical logs, some 2-D seismic lines are available. Thin sections for ditch samples analysis were available. These thin sections analyses include Petrographic description for the rocks.
Geologic setting
The main targets in Abu Rudeis/Sidri field are the conventional play Miocene (Nukhul Fm), Late Cretaceous Lower Senonian (Matulla Fm.) and Paleozoic-Early Cretaceous (Nubia Sandstone). In additional to unconventional play Oligo-Miocene intrusions/ meta-sediments. The pre-rift stratigraphy (above the Precambrian crystalline basement till the Eocene) is about 1.7 km thick on the eastern margin of the Gulf of Suez. Syn-rift strata (Late Oligocene through Miocene and Pliocene) vary in thickness, from a few hundred meters in places along the rift flanks, to as much 120 as 6 km in the basin depocenters at area of the rift. Detailed description of the pre-rift and syn-rift stratigraphy can be found in [4-8], and only a brief summary is presented here. Stratigraphic sequence of the area under investigation represents an ideal succession of the central part of the Gulf of Suez (Figure 2). Such a succession is observed, not only on the surface outcrops at the different locations in the eastern side of the Gulf of Suez, but also in the drilled wells scattered in the area. A sedimentary sequence ranging in age from Paleozoic to Recent, with non-depositional and erosional hiatuses, was penetrated in the area of consideration. Pre- Cambrian basement in Rudies-Sidri area is penetrated in some wells, as well as in Abu Zenima area, at shallow depths (Sidri-6, Sidri-6R, Wadi El-Naqa, South Markha and South Zenima areas) along the main bounding fault. Sidri-8 and Sidri-4 wells hit the basement at deep depths (3800 m and 3570 m, respectively) as fault scarp relationships.
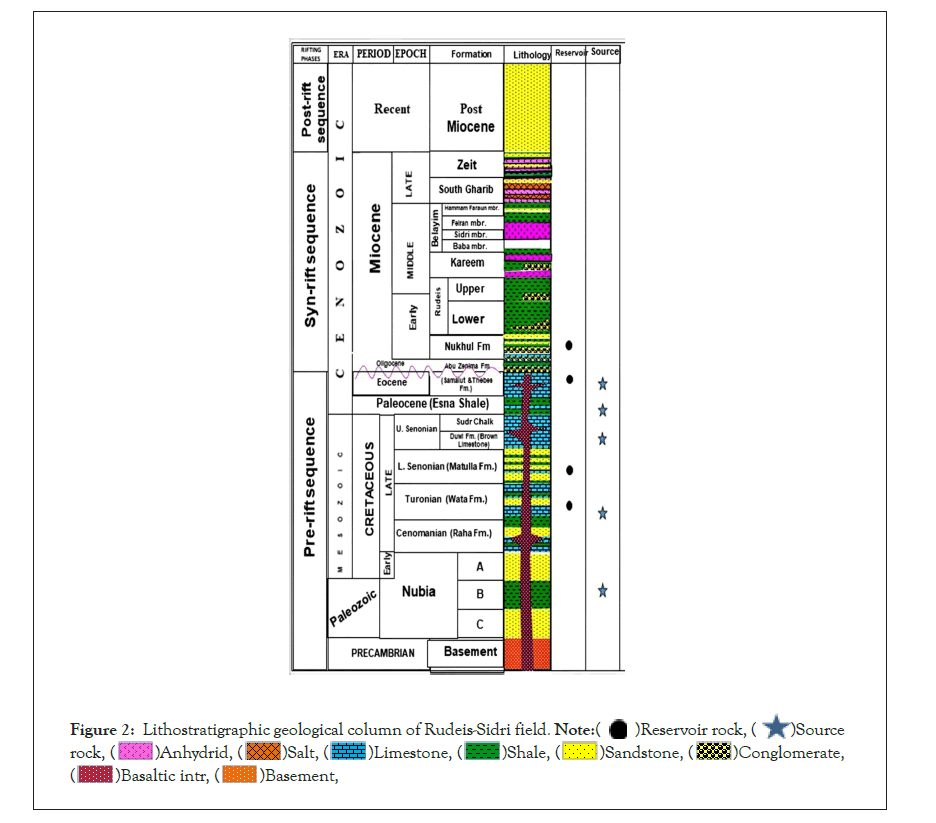
Figure 2: Lithostratigraphic geological column of Rudeis-Sidri field. 


Structure contour map
The structure contour map of Rudeis Formation in the study area Figure 3 shows that, the area was affected by fault trends (NW-SE, and NE-SW). This trend matched with the seismic sections (Figure 4). A set of normal faults forming horsts, grabens and step-fault blocks that is very convenient for oil accumulations with block categories.
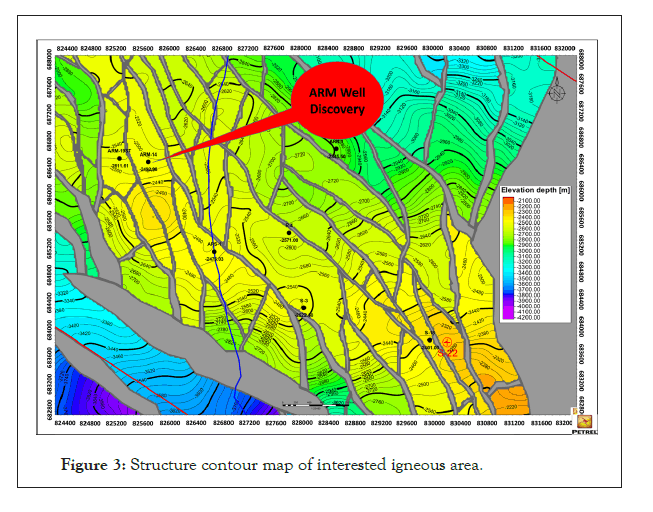
Figure 3: Structure contour map of interested igneous area.
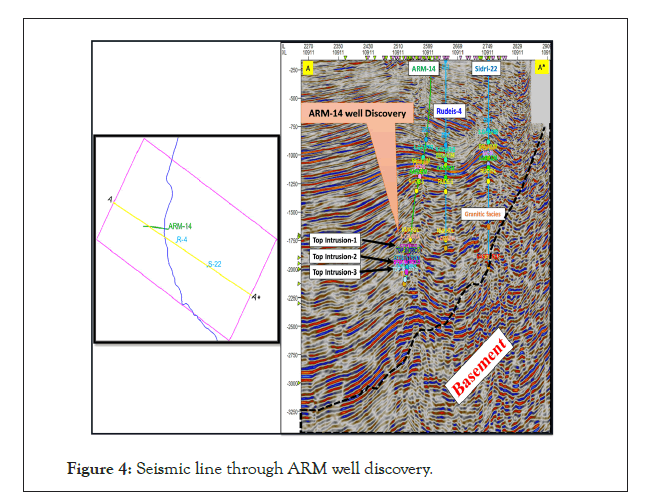
Figure 4: Seismic line through ARM well discovery.
A seismic line through the path of ARM Well Discovery seismic data itself cannot differentiate between the underlying basement and the overlying sediments. Geological cross section showed that, through the trajectory path of the studied wells path and through the intercalations between the igneous intrusion sills and sedimentary bided as in Figure 5.
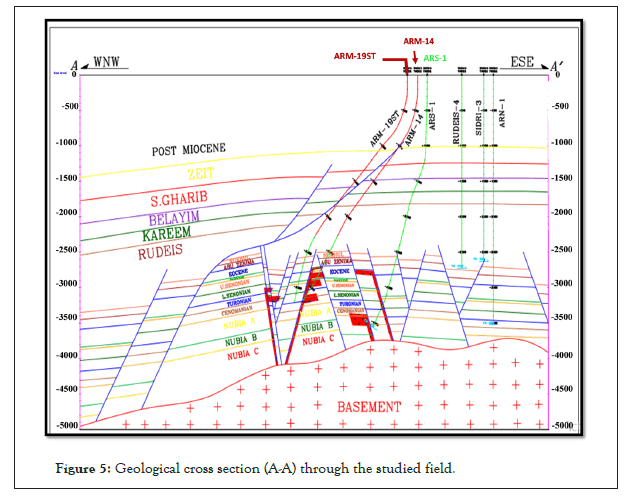
Figure 5: Geological cross section (A-A¯) through the studied field.
Petrography
Drill cutting thin section, integrated with the X-Ray Diffraction, show a mix between sediment and basement rock in Rudeis-Sidri field. The change of percentage from a sample to another is based on the sample location in the main basement dyke or in the edge of sill, or as mix between the basaltic materials and host rock. This is shown in Figure 6a, while in Figure 6b it shows features of CT Scanning and confirmed by XRD in Table 1.
| Depth (m) | Composition (wt%) | Total (wt%) | ||||||
|---|---|---|---|---|---|---|---|---|
| Illite | Chlorite | Kaolinite | Quartz | Plagioclase feldspars | Calcite | Dolomite | ||
| Igneous sample no (1) 3342-3345 | - | 8 | 2 | 7.35 | 41.26 | 41.39 | - | 100 |
| Igneous sample no (2) 3390-3393 | - | 6 | 2 | 3.58 | 26.72 | 41.39 | - | 100 |
| Igneous sample no (3) 3411-3414 | - | 1.6 | 1.4 | 12.12 | 33.61 | 61.7 | 13.83 | 100 |
| Igneous sample no (4) 3515 | - | - | 2 | 5.88 | 26.3 | 37.44 | - | 100 |
| Igneous sample no (5) 3527 | - | - | 2 | 5.3 | 22.94 | 62.54 | 7.22 | 100 |
| Igneous sample no (6) 3542 | - | - | 1 | 5.67 | 7.94 | 77.26 | 8.13 | 100 |
Table 1: XRD result of drill cutting sampling compositions.
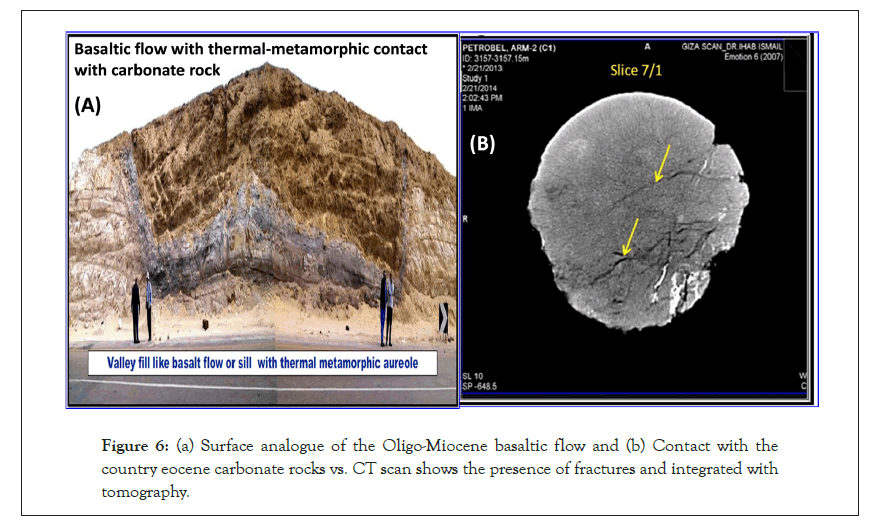
Figure 6:(a) Surface analogue of the Oligo-Miocene basaltic flow and (b) Contact with the country eocene carbonate rocks vs. CT scan shows the presence of fractures and integrated with tomography.
The surface analogue shows the lower imaged interval (Meta- Sediment) in ARM-14 well of the Oligo Miocene igneous intrusion and the contact with the country Eocene carbonate rocks, the mix between basaltic materials and host rock, like in the study wells. The CT analysis was carried out through a request to study and investigate the fractures in the analysed samples. The X-ray computed tomography (CT) is a technique allows the visualization of the internal structure of objects, as determined mainly by the variations in density and atomic composition. It requires the acquisition of two-dimensional radiographs for different positions during step-wise rotation around a central axis, whereas either the source and detector or the samples are moved. The Xray CT is used for qualitative and quantitative analysis of the internal features of geological materials, if those features are marked by sufficiently great differences in the atomic composition and/or density. A strong contrast mainly exists between the solid phases and the atmosphere, and integration between the computed tomography.
Fracture characterization
Fracture planes type is completely or partially open or and closed. It is an indication and possibility of fluid contribution will be share in production and frac will enhanced of pores through size distribution or permeability, as in Figure 7a.
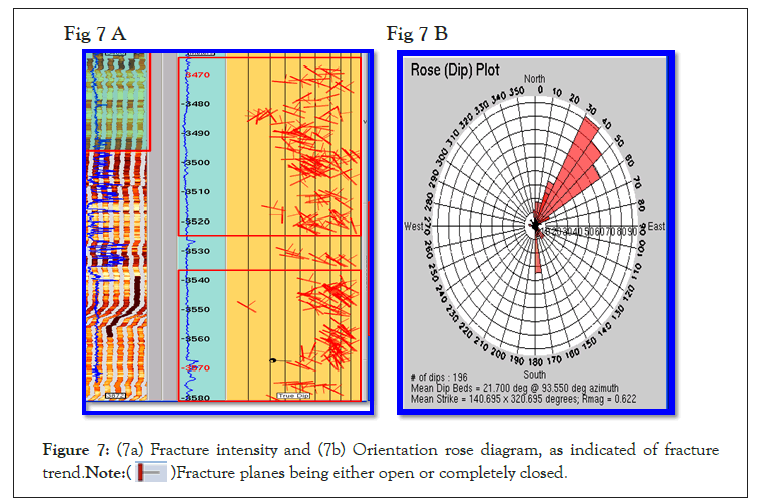
Figure 7: (7a) Fracture intensity and (7b) Orientation rose diagram, as indicated of fracture trend. 
Fracture orientation
Fracture orientation in rose diagram, as in Figure 7b, shows the frequency distribution of the strike and dip azimuths of fractures, fracture orientation of ARM wells was the identical fracture trends on Abu Rudeis/Sidri field, striking NW-SE (clysmic trend), orthogonally normal to the direction of the main extension.
Fracture type
From the image interpretation, as fractures recorded in arm wells are assigned, as resistive fractures, so the differentiation between open, partially-open and closed fractures are very difficult. This is because all boreholes are drilled by oil base mud as a drilling fluid, while can establish from fracture identification.
Fracture identification
Integrated high image and Dipole sonic tools support to recognition and prediction of fractures by fracture density, intensity, distribution (determined from images) and percentage distribution of anisotropy (determined from sonic data), as in Figure 8. Resistivity separation, as well as permeability, reflecting mud cake intervals, are recommended to test the interested intervals with high fracture 125 intensity in some zones, after confirming the natural fracture and build criteria for the igneous intrusion in that field.
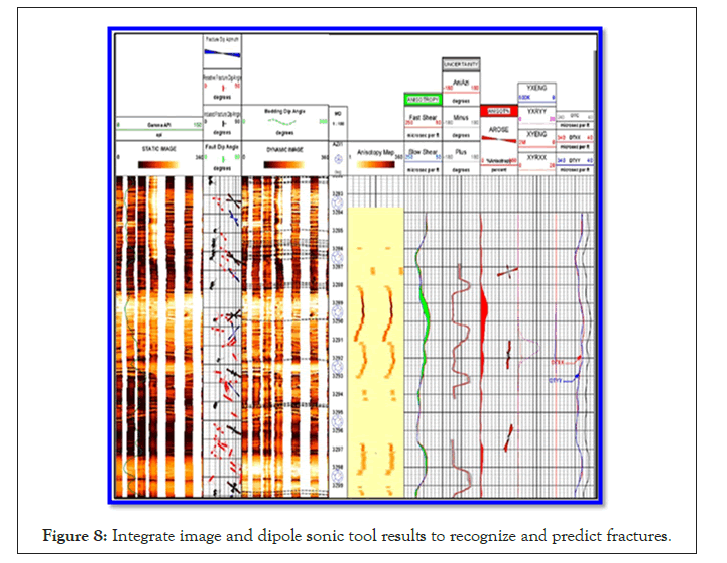
Figure 8: Integrate image and dipole sonic tool results to recognize and predict fractures.
Qualitative interpretation
The qualitative lithology interpretation, as integrated from the petrographic description and XRD results for basalt intrusion, shows mixing between igneous intrusion and host rock, as in Table 1 and Figure 9, it reflects conventional suite log response. Integration between uniaxial compressive strength and XRD percentage help to identify the week points of igneous intrusion.
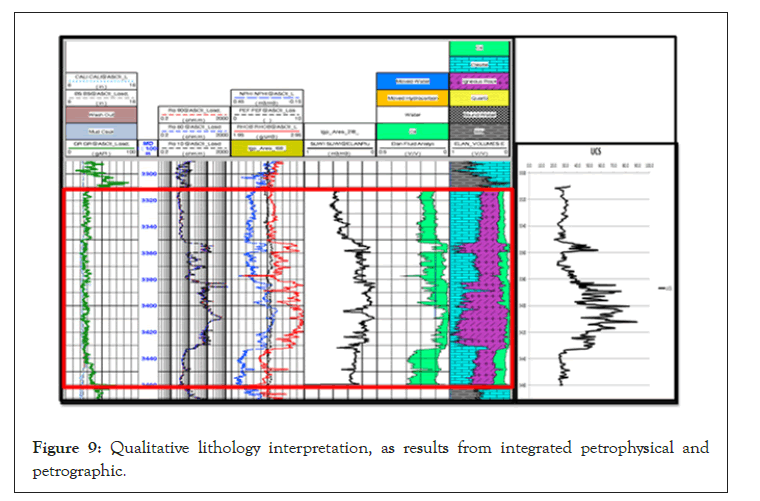
Figure 9: Integrate image and dipole sonic tool results to recognize and predict fractures.
Production data
Production profile supports the success criteria to follow the igneous intrusion, as dyke or and sill confirmed by production, as Figure 10. Finally, the map shows the promising block selected for testing in Figure 11.
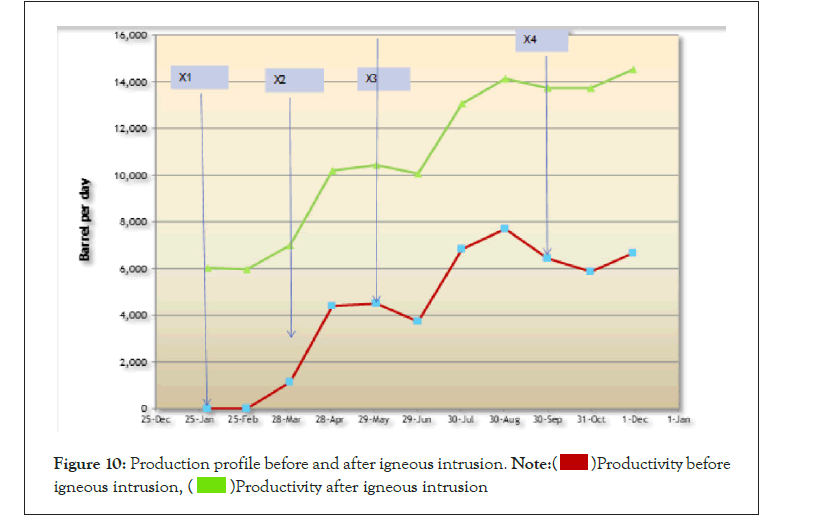
Figure 10: Production profile before and after igneous intrusion. 

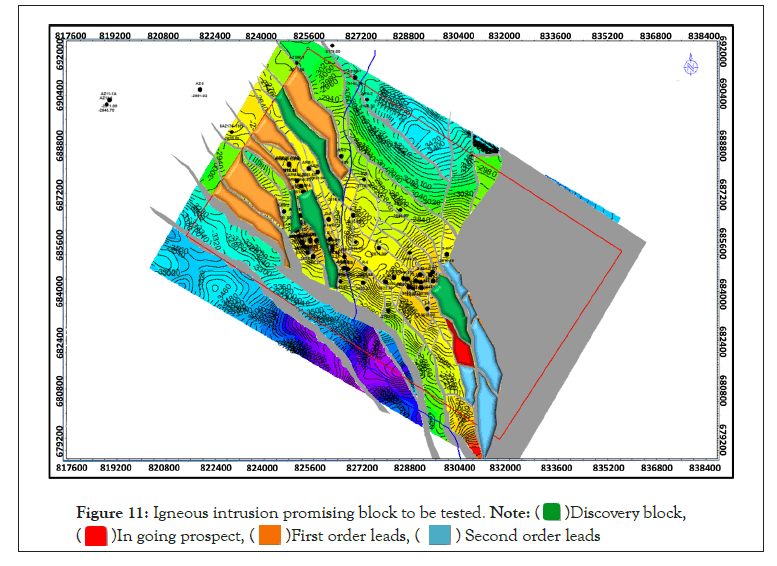
Figure 11: Igneous intrusion promising block to be tested. 

Unconventional oil production from Igneous Intrusion, both dyke or and sill, in Abu Rudeis/Sidri field was one of the big challenges, enhanced productivity and have an impact for future plan. Dyke and sill surface geologic outcrop is the key for the subsurface geologic setting. Uniaxial compressive strength helps to identify the weak points of igneous intrusion. Building qualitative and quantitative lithology model by integrating petrographic, XRD analysis and petrophysical log response. Integration between high image log and full wave sonic results to predict fracture orientation, intensity and type. Seismic data are very poor and not clear to differentiate between dyke and or sill, and weathered basement with sufficient well data. Establishing success criteria of igneous intrusion to predict geometry and igneous distribution in other concessions. The success criteria of igneous intrusion are achieved with production data. One of the study results recommends to continue drilling for some stop wells before encounter igneous intrusions from the past. Finally, selected discovery block is inferred to continue drilling and encountering unconventional igneous intrusion.
Citation: Metwally A, Refaat A, El-Gawad EA, Fathy M, Mosad M (2022) Fracture Recognition and Characterization of the Unconventional Igneous Intrusion Reservoir in Rudeis-Sidri Field, Gulf of Suez, Egypt. J Geol Geophys. 11:017.
Received: 03-Jan-2022, Manuscript No. JGG-22-15377; Editor assigned: 05-Jan-2022, Pre QC No. JGG-22-15377 (PQ); Reviewed: 19-Jan-2022, QC No. JGG-22-15377; Revised: 19-Jan-2022, Manuscript No. JGG-22-15377 (R); Published: 26-Apr-2022 , DOI: 10.35248/2381-8719-22.11.1012
Copyright: © 2022 Metwally A, et al. This is an open-access article distributed under the terms of the Creative Commons Attribution License, which permits unrestricted use, distribution, and reproduction in any medium, provided the original author and source are credited.