Journal of Sleep Disorders & Therapy
Open Access
ISSN: 2167-0277
ISSN: 2167-0277
Research Article - (2013) Volume 2, Issue 5
Background: The aim of this study was to investigate relationships between the genotypic frequencies of genes F5-coagulation factor V (proaccelerin, labile factor), F2-coagulation factor II (thrombin), MTHFRmethylenetetrahydrofolate reductase (NADPH), PAI-1 - plasminogen activator inhibitor-1, the frequencies of HLA haplotypes DQ2/DR3, DQ2/DR7, DQ8/DR4, 5, DQ7/DR5 and clinical features and severity of OSAS in comparison to a control population of 163 patients without OSAS.
Methods and results: Eighty-two consecutive outpatients with OSAS were enrolled in the respiratory, cardio, and genetic study. By means of cluster analysis it was shown that 40% of patients with PAI-1 5G/5G polymorphism had pulmonary artery hypertension, with a mean value of 46 mm Hg, and also 40% of OSAS patients with pulmonary artery hypertension had PAI-1 5G/5G polymorphism, 50% had 4G/5G and 10% had 4G/4G; as regards OSAS patients without PH, 8.95% only had PAI-1 5G/5G polymorphism, 22.38% had PAI-1 4G/4G and 67.16% had PAI- 1 4G/5G. PAI-1 polimorphisms were detected by RDB techniques. Moreover, these patients with OSAS showed HLA haplotypes polymorphism: DQ7 (40%), DQ2.5 (20%) and DQ2.2 (10%). Nevertheless, OSAS patients without PAH showed HLA polymorphism as follows: DQ7 (47, 76%); DQ2.5 (8.95%); DQ2.2 (16.41%). OSAS patients with pulmonary hypertension were 12.99 % of all OSAS patients. HLA polymorphism was analyzed by PCR amplification and gel electrophoresis.
Conclusions: Our results suggested a genotypic heterogeneity among OSAS patients PAI-1 5G/5G polymorphism with PAH possibly in relation with severity of the disease.
Keywords: PAI-1: Plasminogen activator inhibitor-1; HLA: Human leukocyte antigen; OSAS: Obstructive sleep apnoea syndrome; PAH: Pulmonary artery hypertension
Obstructive Sleep Apnea Syndrome (OSAS) is affects 2-4% of the middle-aged population [1]. According to the American Sleep Disorder Association, OSAS is defined as an intrinsic sleep disturbance characterized by the appearance of repeated episodes of upper airways obstruction (apneas) occurring during sleep, usually associated with a reduction in oxygen blood saturation [2]. Several genetic factors, environmental influences as well as developmental factors are closely tied to OSAS. Redline and Tishler underline the genetic basis of several risk factors for obstructive sleep apnoea [3]. Earlier studies have examined the expression of various inflammatory factors in OSAS patients [4].
There is increasing evidence that OSAS is present with hypertension, myocardial ischemia, metabolic syndrome, including impaired glucose tolerance which increase the risk of stroke [5]. Existing research on the general population clearly indicate that an impaired fibrinolytic function is an important marker of cardiovascular risk [6,7].
For example, over-expression of the type 1 Plasminogen Activator Inhibitor (PAI-1), which is one of the primary regulators of the fibrinolytic system, enhances the pathological deposition of fibrin and facilitates the occurrence of thrombotic events [8]. An insertion/ deletion polymorphism in the promoter region of this gene, where one allele sequence has four guanosines (4G) instead of five (5G), is collocated with a higher promoter activity [9] and increased PAI- 1 levels in plasma [10]. A meta-analysis shows that this 4G allele is associated with an increased risk of myocardial infarct, particularly in high-risk populations [11]. In patients with OSAS, Range Mark et al. found increased PAI-1 levels and decreased fibrinolytic activity [12].
Moreover, several studies suggest that OSAS is strongly genetic, often found within families with progressively increasing risk which rises with the numbers of affected relatives [13,14]. The family pattern of OSAS is not only dependent on familial factors in increasing risk of the disorder but also by obesity, craniofacial malformations and ventilatory abnormalities [15,16]. The Human Leukocyte Antigen (HLA) is an objective genetic marker that may be implicated in the development of a disease through a genetic factor within the major histocompatibility complex [17].
Several studies have demonstrated an HLA DR2 and DQ1 gene polymorphism association with narcolepsy, suggesting a possible autoimmune connection [18-20]. Early research failed to demonstrate this hypothesis, finding that HLA-DR2 was only a linkage marker for another, unknown gene which causes narcolepsy. However, a Japanese study has shown an increased prevalence of HLA A2 in patients with OSAS as compared with the non OSAS population [21,22]. The frequency of HLA-A2 antigen was markedly increased in the patients with OSAS compared with control patients (81.3% vs. 40.6%) and compared with the general Japanese population. (40.7%)
The aim of this study was to investigate relationships between the genotypic frequencies of genes F5-coagulation factor V (proaccelerin, labile factor), F2-coagulation factor II (thrombin), MTHFRmethylenetetrahydrofolate reductase (NADPH), PAI-1 (plasminogen activator inhibitor-1), the frequencies of HLA haplotypes DQ2/DR3, DQ2/DR7, DQ8/DR4, 5, 10- DQ7/DR5 and clinical features and severity of OSAS in comparison to a control population of 163 patients without OSAS.
Patients and phenotypic parameters
Eighty-two consecutive outpatients with OSAS at the “A. Galateo” Department Rehabilitation, Respiratory Care Unit, San Cesario, Lecce, Italy, were enrolled in the respiratory study between June 2011 and January 2012. After enrolment in the study, all the patients were genetically evaluated at the laboratory of genetics of “Vito Fazzi” Hospital, ASL, Lecce, as well as at the Department of Cardiology at “City of Lecce Hospital” Lecce, Italy.
OSAS was diagnosed according to the American Academy of Sleep Medicine (AASM,) classification [23]. The following cardio-respiratory and morph metric parameters were also studied: BMI, Mallampati score as an independent predictor of obstructive sleep apnea [24], co morbidities, AHI (h/s), Mean SatO2 (%), Nadir SaO2 (%), T90 (%), PaO2 (mmHg), PaCO2 (mmHg); abdominal circumference and circumference of the neck (cm), Pulmonary Systolic Arterial Pressure (PAPs) (mmHg), Blood Pressure (mmHg), Epworth Sleepiness Scale (0-10), FEV1 (%) , FEV1/FVC (%), FCV (%). We studied the genotypic frequencies of genes haplotypes F5, F2, MTHFR, PAI-1 and the frequencies of HLA genes haplotype DQ2/DR3, DQ2/DR7, DQ8/DR4, and DQ7/DR5 in comparison to a control population of 163 patients without OSAS.
HLA genotyping of HLA DQ2-DQ8 genes
All patients included in the study were negative for tissue transglutaminase antibody typical of Celiac Disease. Blood was obtained with informed consent by vena puncture from patients.
Standard techniques for DNA extraction, PCR amplification and product detection have been used in the present work. A commercial reagent “DNA extraction from whole blood” ref AA1001 (Nuclear Laser Medicine, Settala, Mi, Italy) was used to purify genomic DNA from whole blood. HLA–DQ2 (DQA1*0501 and DQB1*02 alleles) and DQ8 (DQA1*0301 and DQB1*0302 alleles) genotyping was performed by PCR amplification using sequence specific primers (PCR-SSP) on a Gene Amp PCR 9700 System (Applied Bio system, Foster City, CA, USA). CELIAC DISEASE KIT 1 (Experteam, Venezia-Marghera, Italy), was used to determine HLA DQ2/DQ8 status in all patients. PCR products were detected by electrophoresis on 3% agarose gel and were visualized under UV light.
Coagulation factors and MTHFR genotyping
Assay for the identification of mutations associated with Cardiovascular Disease (CVD) based on Polymerase Chain Reaction (PCR) and reverse-hybridation was performed. Genomic DNA was extracted from whole blood samples using the “DNA extraction from whole blood” kit REF AA1001 (Nuclear Laser Medicine, Mi, Italy). The procedure includes three steps: 1) DNA isolation, 2) PCR amplification using biotinylated primers, 3) hybridization of amplification products to a test strip containing allele specific oligonucleotide probes (ASO) immobilized as an array of parallel lines. Bound biotinylated sequences are detected using streptavidin-alkaline phosphatase and colour substrates. “CVD Strip Assay”(Vienna Lab Diagnostics GmbH) contain all required material for the multiplex amplification on a Gene Amp PCR 9700 System (Applied Bio system, Foster City, CA, USA) of 12 mutations: Factor II G20210A; Factor V (Leiden) G1691A; Factor V H1299R; MTHFR A1298C and MTHFR C677T; Factor XIII V34L; β-Fibrinogen-455 G-A; PAI-1 4G/5G; GPIIIa L33P (HPA-1); ACE I/D; Apo B R3500Q; Apo E2/E3/E4.
Lung and heart function measurements
Static lung volumes were measured by body plethysmographs (6200 Auto box DL; Sensor Medics; Yorba Linda, CA) and dynamic lung volumes by mass flow sensors (Vmax229; Sensor Medics) with the patients seated according to standard procedures [25].
Arterial blood gases were measured at the radial artery using microelectrodes (ABL 520; Radiometer; Copenhagen, Denmark), with the patient seated and spontaneously breathing air. Resting daytime PAPs was measured with a colour Doppler Echocardiograph (DE). Nocturnal desaturation was evaluated with polygraphic recording (Embletta pds, Recording System, Broomfield, CO, USA) of oxygen saturation, snoring, air flow, thoracic and abdominal respiratory movements, heart rate, including ECG in real-time mode, and body position. Polygraphic recordings were performed between 11:00 pm and 6:00 am. The signals, which were saved in a digital recorder, were computer-analyzed, and validated by a physician on the morning after the recording. Body mass index was calculated as the body weight/body weight ratio (in kilograms per square meter). Obesity was diagnosed when BMI > 29.9 kg/m2.
Echocardiography analysis
Indirect noninvasive measurement of resting daytime PAPs was performed with a color Doppler Echocardiography (Acuson- Cypress-Siemens, Company by Business First of Louisville, 2005). Two-dimensional echocardiography was performed in apical views: four-chambers and two-chambers and parasternal views: long axis and short-axis. In all patients we excluded cardiac diseases that might determine arterial pulmonary hypertension. Tricuspid regurgitation was found in 86% of patients. The estimation of PAPs is based on simplified Bernoulli equation which describes the relationship of tricuspid regurgitation velocity and the peak pressure gradient of tricuspid regurgitation. This equation allows for estimation of PA systolic pressure taking into account right atrial pressure: PA systolic pressure=tricuspid regurgitation pressure gradient+estimated right atrial pressure. Right atrial pressure can be estimated based on the diameter and respiratory variation of the inferior vena cava although often a fixed value of 5 or 10 mmHg is assumed. Moreover Doppler derived systolic PAP values are strongly correlated with pressure measured with catheterization [26].
Definition cardiac and respiratory parameters
The definition of apnoea and hypopnoea was based on standard criteria [27]. Nocturnal hypoxemia was defined as a SatO2 of <90% for at least 5 min with an NSatO2 of ≤ 85%. Time in bed was defined as the time from the start to the end of the recording. The percentage of Total Recording Time (TRT) spent in bed with a SatO2 of 90% was defined as the T90. The minimal TRT required for a satisfactory analysis of nocturnal recordings was 2 h [28]. Moreover, the subjective assessment of daytime sleepiness was carried out using the Epworth Sleepiness Scale (ESS) score of 10 [29]. According to ESC/ERS guidelines for echocardiographic diagnosis of pulmonary hypertension, pulmonary hypertension possible is defined as a systolic pulmonary artery pressure in the range of 37-50 mmHg with/without additional echocardiographic variables suggestive of pulmonary hypertension and with tricuspid regurgitation peak velocity of 2.9-3.4 m/s [30].
Statistical analysis
All variables first underwent descriptive statistical analysis to obtain the distribution fitting and to calculate average, variance, SD, range, standard skew ness and standard kurtosis. To evaluate whether the data variables were normally distributed, we calculated the _2 goodness-offit, the Shapiro-Wilk W test, the z-score for skewness, and the z-score for kurtosis. We also obtained a table of 95.0% Confidence Intervals (CI) with the mean of each variable to bind the sampling error in the estimates of these means. Patients were subdivided by gender and the variables of men and women in the N and ND groups were analyzed by t - test for unpaired data with comparison of means. The probability of type I error was minimized by the F-test of the Fisher-Snedecor test for comparison of variance, by the Mann-Whitney W test for comparison of medians, and with the Kolmogorov-Smirnov test, all of which were performed at a minimum 95% confidence level. The latter were carried out with the least-squares method so as to obtain linear prediction equations. Prediction accuracy referred to bias and precision, bias being the mean difference between predicted and measured values, and precision the 95% CI for the difference. Cluster analysis is used in such diverse fields as artificial intelligence, biology, medicine, psychology and business. It entails grouping similar objects into distinct, mutually exclusive subsets referred to as clusters. Elements within a cluster share a high degree of “natural association”, whereas the clusters are relatively distinct from one another. We used the Fisher least significant differences method or the Bonferroni method, at 95% CI, to evaluate significant differences among the means with minimal probability of type I error, so as to assess significant differences between clusters.
By means of cluster analysis it was shown that 40% of patients with PAI-1 5G/5G polymorphism had pulmonary artery hypertension, with a mean value of about 46 mm Hg, and also 40% of OSAS patients with pulmonary artery hypertension had PAI-1 5G/5G polymorphism, 50% are 4G/5G and 10% are 4G/4G; as regards OSAS patients without PH, 8.95% only had PAI-1 5G/5G polymorphism, 22.38% PAI-1 4G/4G and 67.16% PAI-1 4G/5G. Moreover, these OSAS patients showed HLA haplotypes polymorphism: DQ7 (40%), DQ2.5 (20%) and DQ2.2 (10%). Nevertheless, OSAS patients without PH showed HLA polymorphism as follows: DQ7 (47,76%); DQ2.5 (8.95%); DQ2.2 (16.41%). OSAS patients with pulmonary hypertension were 12.99 % of all OSAS patients (Table 1).
| General (n=77) Mean ± SE | PAH (n=10) Mean ± SE | NoPAH (n=67) Mean ± SE | P | |
| AHI/hs | 41.39 ± 2.65 | 54.61 ± 6.52 | 39.45 ± 2.82 | 0.07NS |
| BMI(kg/m2) | 34.93 ± 0.89 | 36.29 ± 3.07 | 34.74 ± 0.92 | 0.56NS |
| Abdomen circumference/cm | 116.03 ± 1.43 | 122.00 ± 5.21 | 115.18 ± 1.44 | 0.11NS |
| Neck circumference/cm | 43.43 ± 0.37 | 44.10 ± 1.33 | 43.33 ± 0.40 | 0.56NS |
| Age/years | 56.24 ± 1.24 | 59.30 ± 4.36 | 55.80 ± 1.28 | 0.34NS |
| Ep worth Sleepiness Scale(0-10) | 15.06 ± 0.49 | 14.3 ± 0.92 | 15.25 ± 0.54 | 0.52NS |
| FEV1 (%) | 89.79 ± 1.57 | 80.80 ± 4.31 | 91.11 ± 1.63 | 0.025 |
| FEV1/FVC (%) | 93.74 ± 1.42 | 83.20 ± 3.89 | 95.29 ± 1.44 | 0.004 |
| FVC (%) | 94.45 ± 1.21 | 89.90 ± 3.22 | 95.12 ± 1.30 | 0.15NS |
| Mean SaO2 (%) | 90.57 ± 0.52 | 89.05 ± 1.22 | 90.80 ± 0.57 | 0.29NS |
| Nadir SaO2 (%) | 76.18 ± 1.10 | 73.20 ± 3.42 | 76.62 ± 1.16 | 0.34NS |
| Systolic Blood Pressure (mmHg) | 141.60 ± 1.64 | 141.00 ± 4.58 | 141.69 ± 1.77 | 0.87NS |
| Diastolic Blood Pressure (mmHg) | 86.35 ± 0.96 | 86.00 ± 1.63 | 86.40 ± 1.07 | 0.86NS |
| Pulmonary Artery Hypertension (systolic)(mmHg) | 30.13 ± 0.79 | 44.70 ± 0.72 | 27.99 ± 0.52 | 0.00001 |
| PaCO2 (mmHg) | 44.74 ± 1.22 | 46.50 ± 2.02 | 44.49 ± 1.37 | 0.58NS |
| PaO2 (mmHg) | 72.11 ± 1.48 | 66.95 ± 2.17 | 72.87 ± 1.65 | 0.18NS |
| T90 (%) | 26.18 ± 2.49 | 38.40 ± 8.22 | 24.38 ± 2.54 | 0.08NS |
| pH | 7.44 ± 0.025 | 7.40 ± 0.01 | 7.44 ± 0.03 | 0.57NS |
Table 1: Clinical features of as patients with pulmonary artery systolic hypertension vs. as patients without pulmonary artery systolic hypertension.
In the whole group of patients a relationship between FEV1 (%) and age was detected as follows: FEV1 (%)= 117,369 - 0,489893 Age (p-value=0,0004; R-squared=15,0023 %), outlining a worsening of pulmonary functions by age (Figures 1 and 2). Moreover, AHI (hs) was in relationship with neck circumference and FEV1 (%) values, the model explaining 82,13% of AHI variability, as reported in the following equation: AHI=2,21 neck circumference-0,60 FEV1 (%) (p-value=0,00001; R-squared (adj)=82,13 %). Nevertheless, FVC (%) alone was also in relation with AHI (hs) but only a 13,96 % of AHI (hs) variability was explained by this model: AHI=123,65 - 0,87 FVC (%) (p-value=0,0004; R-squared=15,06 %). PAPS values correlates with AHI (%), neck and abdomen circumferences, FEV1 (%) and Nadir SatO2 (%) alone but not in a multiple regression model. Lastly, T90 (%) correlates with AHI (hs) as in the whole group of patients, as in OSAS not-PAH: T90=-4,79804 + 0,747512 AHI (p-value=0,0000; R-squared (adjusted for d.f.)=65,736 %). As regards OSAS patients no- PAH only, we detected a relation between AHI values and both neck circumference and FEV1 (%) predicted, the model explaining a 81,91% of AHI variability: AHI=2,37 neck circumference-0,69472 FEV1 (%) (p-value=0,00001; R-squared (adjusted for d.f.)=81,91 %); PAPS is in relation only with neck circumference: PAPS=0,64 neck circumference (p-value=0,00001; R-squared (adjusted for d.f.)=97,68 %).
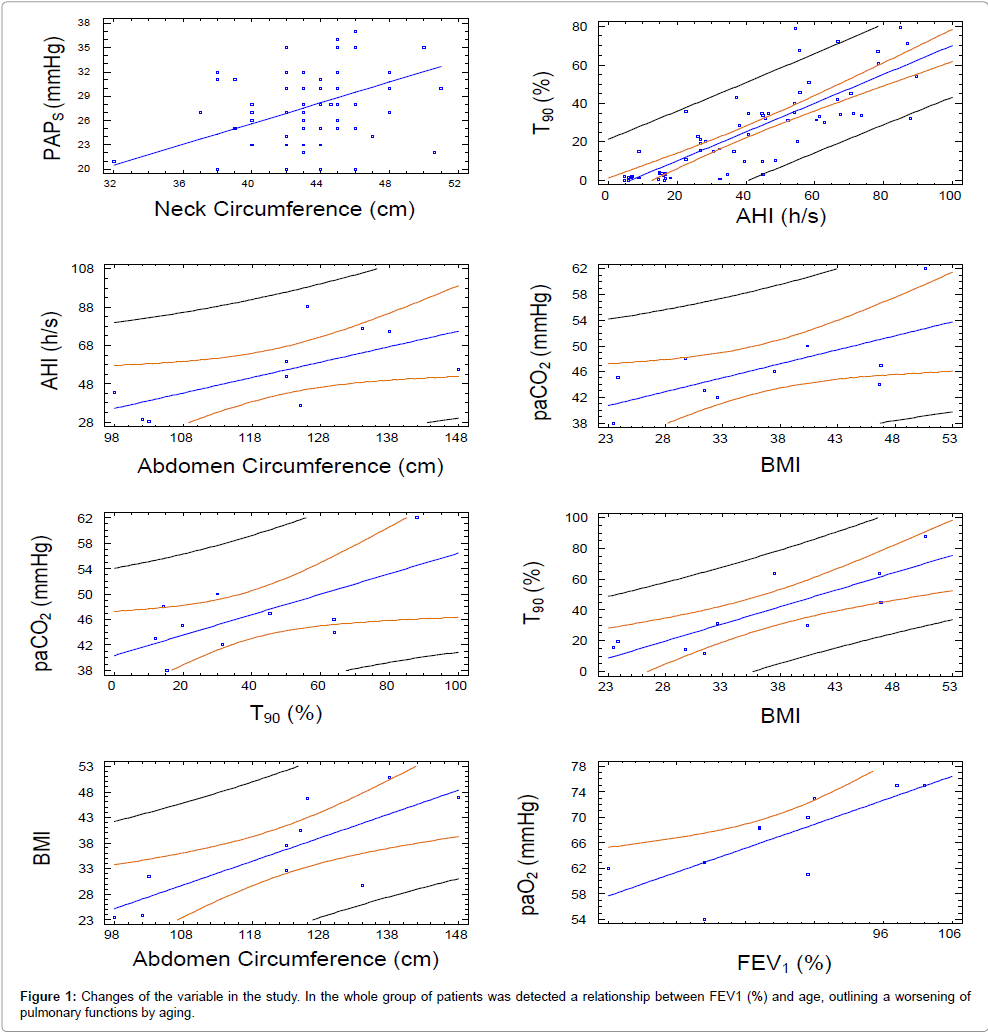
Figure 1: Changes of the variable in the study. In the whole group of patients was detected a relationship between FEV1 (%) and age, outlining a worsening of pulmonary functions by aging.
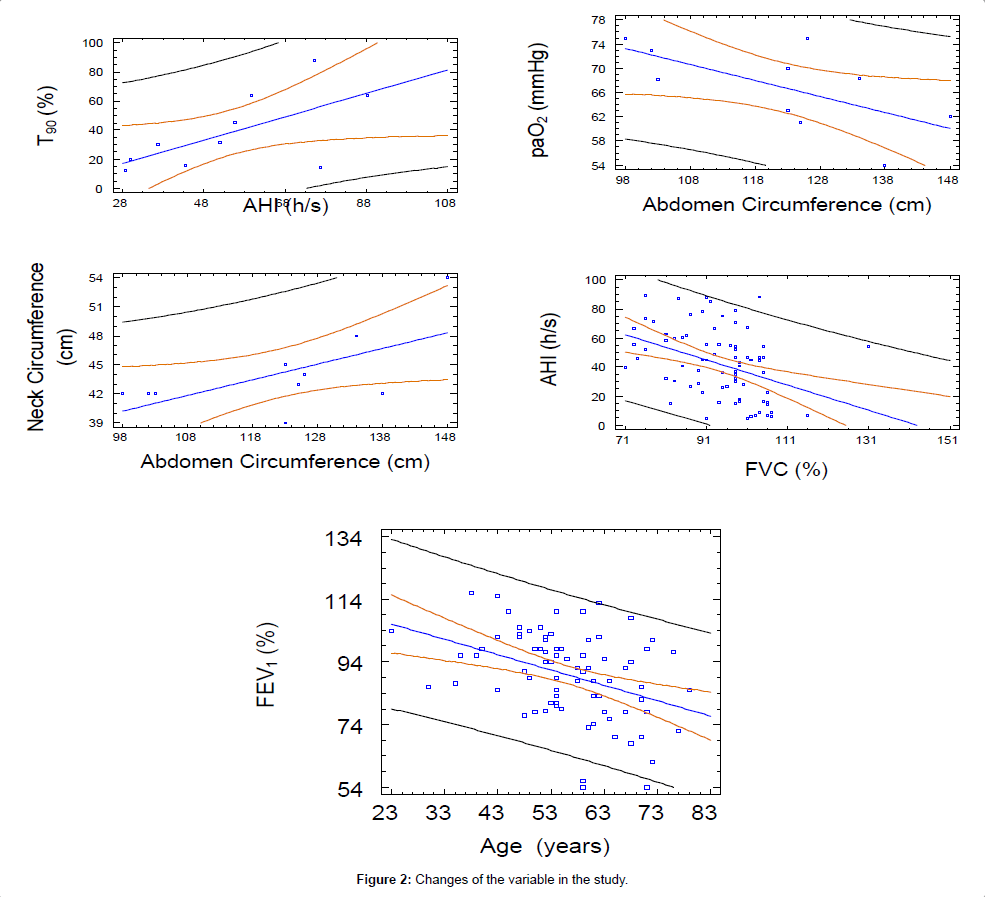
Figure 2: Changes of the variable in the study.
As regarding the OSAS patients with pulmonary artery systolic hypertension, we detected the following relationship (Table 2):
| PAH (Mean ± SD) | NoPAH (Mean ± SD) | P | genpop | |
| FEV1(%) | 80,80 | 91.15 | 0.025 | 97.54 |
| PAI15G/5G | 40% | 8.96% | 0.006 | 14.12% |
| PAI14G/4G | 10.0% | 22.39 | 21.18% | |
| PAI14G/5G | 50% | 67.16 | 63.53% | |
| DQ2_2 | 10.0% | 16.42% | 16.47% | |
| DQ2_5 | 20.0% | 8.95% | 9.41% | |
| DQ7 | 40.0% | 47.76% | 47.06% | |
| DQ8 | 0.0% | 8.95% | 7.06% | |
| Et_F2 | 0.0% | 1.49% | 2.35% | |
| Et_F5 | 0.0% | 1.49% | 1.18% | |
| MTHFR_DEM | 20.0% | 28.36% | 30.59% | |
| MTHFR_EtAC | 0.0% | 13.43% | 11.76% | |
| MTHFR_EtCT | 50% | 19.40% | 0.033 | 22.35% |
| MTHFR_OmAC | 0.0% | 10.45% | 8.24% | |
| MTHFR_OmCT | 30% | 25.37% | 24.71% | |
| MTHFR_wt | 0.0% | 4.48% | 3.53% |
Table 2: OSAS patients with pulmonary artery systolic hypertension vs. OSAS patients without pulmonary artery systolic hypertension. In the whole group of patients was detected a relationship between FEV1(%) and age as follows: FEV1(%)=117.369-0.489893, Age(P-value=0.0004); R-squared=15.0023%, suggesting a worsening of pulmonary functions by aging.
1) Between AHI (hs) and abdominal circumference: AHI=- 43,48+0,80 abdominal circumference (p-value=0,0453; R-squared (adjusted for d.f.)=33,90 %);
2) Between BMI and abdominal circumference: BMI=-20,12+0,46 abdominal circumference (p-value=0,0073; R-squared (adjusted for d.f.)=56,67 %);
3) Between neck and abdominal circumference: neck circumference=24,35+0,16 abdominal circumference (p-value=0,0488; R-squared (adjusted for d.f.) =32,77 %).
4) Between PaCO2 and BMI: PaCO2=30,72+0,43 BMI (p-value=0,0380; R-squared (adjusted for d.f.) =36,444 %).
5) Between PaO2 (mmHg) and abdominal circumference: PaO2 (mmHg) =99,16-0,26 abdominal circumference (p-value=0,0487; R-squared (adjusted for d.f.) =32,83 %).
6) Between T90 and BMI: T90=-42,50 + 2,23 BMI (p-value=0,0028; R-squared (adjusted for d.f.)=65,58 %).
7) Between T90 and AHI:T90 (%)=-5,48 + 0,80 AHI (hs) (p-value=0,0474; R-squared (adjusted for d.f.)=32,22 %).
8) Between PaO2 mmHg and FEV1 (%): PaO2 mmHg=36,67 + 0,37 FEV1 (%) (p-value=0,0133; R-squared (adjusted for d.f.)=50,0609 %).
9) Between PaCO2 (mmHg) and T90 (%): PaCO2 (mmHg)=40,32 + 0,16 T90 (%) (p-value=0,0405; R-squared (adjusted for d.f.)=35,5127 %)
In our study, OSAS patients with pulmonary arterial hypertension were 12,99% of all OSAS patients. The reported prevalence of PAH in OSAS varies from 20% to 41% [31,32].
In this study, severity of OSAS did not always correlate with severity of pulmonary hypertension, but factors such as BMI and low daytime PaO2 were more closely associated with mild degrees of pulmonary hypertension. Patients with OSAS and pulmonary hypertension have been shown to have increased pulmonary vascular press or responses to hypoxemia [33].
Two other studies showed a reduction in pulmonary artery pressure in patients treated with CPAP [34,35]. The research of Sajkov et al. showed a decrease in PAH as a response to hypoxemia with CPAP treatment [35]; in this study patients with baseline pulmonary hypertension showed the largest response; with CPAP treatment being key to this response. However, daytime pulmonary hypertension that occurs in patients with OSAS improves with CPAP and is more closely associated with BMI and daytime PaO2 than with severity of OSAS. Nevertheless, there is no clear evidence linking OSAS to the aetiology of pulmonary hypertension [36]. Earlier data on pulmonary hypertension in patients with OSAS has been found to correlate more with a lower daytime PaO2 and higher PaCO2 than with severity of OSAS [37]. Our study has shown that the OSAS patients with PAH in comparison to the OSAS patients without PAH have an AHI and BMI greater and a lower mean SaO2 and were more hypoxemic and mildly hypercapnic. It has been shown that intermittent hypoxia creates a chain of events involving oxidative stress and inflammatory response favourable to atherogenesis, which provides at least one pathway through which sleep apnoea affects the cardiovascular and metabolic systems [38]. However, most studies in this area were limited by the presence of co-morbidities which could have affected their pulmonary pressures [35,39].
Hypoxemia-induced endothelial cell dysfunction is a critical factor in pulmonary vascular remodelling [40]. Hypoxia induces upregulation of vascular endothelial growth factor, which is a mediator of angiogenesis, resulting in vascular remodelling [41,42].
Our results outlined no differences between OSAS patients with and without PAH, as regards HLA polymorphism; on the contrary a significant occurrence of PAI-1 5G/5G polymorphism in OSAS patients with PAH seems to be a relevant feature of these patients suggesting a role in the pathogenesis. According to these results, the occurrence of pulmonary artery hypertension in OSAS patients may be an associated pathology rather than a worsening of OSAS. Our results suggest a genotypic heterogeneity among OSAS patients with PAI-1 5G/5G polymorphism and with PAH, possibly in relation with the severity of illness.
We are grateful to Dr. Alexandru Cozma M.D., Internal Medicine Specialist, PhD, University PISA Italy, as to coordinate some study.
The authors has declared that non conflict of interest exists
The local ethics committees approved the study. All patients gave their informed consent for participating in the study.