Virology & Mycology
Open Access
ISSN: 2161-0517
ISSN: 2161-0517
Research Article - (2023)Volume 12, Issue 1
Background: As some previous studies suggested, regulatory elements in both promoter and gene body regions, Transcription Start Sites (TSSs) in the actinomycetes gene should be identified to understand gene regulatory mechanisms. Computational survey and in silico analysis was carried out for the actinomycetes genome which is isolated in two soda lakes of Ethiopia. Promoter regions and their regulatory elements were analyzed by using ten functional sequences.
Results: TSS for each of the ten (10) functional genes of isolated actinomycetes was identified. About 92% of actinomycetes genes contained more than two TSSs and a TSS with the highest predictive score was considered to determine a promoter region of the genes. Genes having more than one TSS and TSS of the highest prediction score was selected and investigated and our result showed that only actinomycete genes LC-21 from lake Chitu and LA-21 from lake Arenguade had a single TSS, whereas 92% of genes contained more than two TSSs. Generally, only the actinomycete isolate (LC-13) gene from Lake Chitu had a maximum of six (6) TSSs. A total of seven common candidate motifs were identified. The location and distribution of these candidate motifs in the promoter regions are dominated by Mot I relative to the TSSs. Depending on their significance value; alginate and motility regulator Z factor families (4.00e-01) were involved in the regulatory mechanism of actinomycetes genes. There is no CpG Island in both promoter and gene body regions of the actinomycetes genome.
Conclusion: Our investigation important to predict the functional gene of sequenced actinomycetes, novel biosynthetic gene clusters (inactivated or cryptic pathways) for secondary metabolite compounds from actinomycetes and opportunities for the biotechnology and pharmaceutical industries and further detail molecular characterization of the actinomycetes genome isolated from two soda lakes in Ethiopia.
Actinomycetes; CpG Island; Motif; Promoter region
TSS: Transcription Start Site; TFs: Transcription Factors; MEME: Multiple Em for Motif Elicitation; NCBI: National Center for Biotechnology Information; bp: Base Pair; NNPP: Neural Network Promoter Prediction; Mot: Motif
A previous study suggested that productions of major secondary metabolites of actinomycetes are associated with the Nonribosomal Peptide Synthetase (NRPS) and Polyketide Synthase (PKS) pathways [1,2]. Sequencing of actinomycetes genomes revealed that great value of unsuspected and uncharacterized biosynthetic gene clusters, known as cryptic pathways, for secondary metabolites and antibiotic-related substances than originally anticipated [3]. These cryptic gene clusters are substantially tied to the environmental conditions in which secondary metabolite production may evolve [4].
Investigation of promoter regions, transcription start sites, and short DNA sequences are key components to understand gene expression regulation mechanisms [5,6]. CpG Islands are also key regulatory elements in the promoter regions of the genome and said to be gene markers having great functions in gene regulation through epigenetic changes [7].
Motifs are short, recurring patterns in DNA that are presumed to have a biological function [8]. Often they indicate sequencespecific binding sites for proteins such as nucleases and Transcription Factors (TF) and linked to transcriptional regulation [9]. The common promoter motif is the crucial indicator for a family of co-regulated genes present in the regions where highly complex protein interactions occur [10]. It is also reported that genes having similar expression patterns contain common motifs in their promoter regions [11].
So far, no molecular work has been performed specifically on actinomycetes and little reported regarding in the genomic analysis of actinomycetes genes in the soda lakes of Ethiopia. Although previous studies by a few investigators confirmed the existence of potential antibiotic-producing actinomycetes from different ecosystems of Ethiopia, a study on the analysis of promoter regions, Transcription Start Sites (TSSs), and motifs which are fundamental to understand gene expression regulation mechanisms and genetic variations in the promoter regions of actinomycetes gene in Ethiopian soda lakes has not been discovered. Despite the onset of the genomic era and some progress in awakening “silent” gene clusters in actinomycetes, screening for new natural products remains an important part of the drug discovery process. Major challenge remains the rediscovery of already known bioactive compounds even from phylogenetically distinct actinomycetes. The present research was the first to fill the above knowledge gap by investigating the regulatory elements such as promoter regions, CpG Islands, Transcription Factors (TFs), and their corresponding binding sites (TFBSs) involved in the regulation of gene expression mechanisms.
Therefore, this investigation is important to predict the functional gene of sequenced actinomycetes, novel biosynthetic gene clusters (inactivated or cryptic pathways) for secondary metabolite compounds from actinomycetes and opportunities for the biotechnology and pharmaceutical industries and further detail molecular characterization of the actinomycetes genome isolated from two soda lakes in Ethiopia.
Description of the study area
The Arenguade/Hora Hadho/and Chitu soda lakes were included in this study. The small lake Chitu is located adjacent to the soda lake Shala. Lake Arenguade is located 50 km Southeast of Addis Ababa. For this study, lake Chitu and lake Arenguade were chosen for their peculiar and interesting features to understand the microbial ecology of the soda lakes in the region. These lakes are similar in that both are craters in origin, have closed basins, have very small catchment areas and are highly productive [12]. On the other hand, they have a number of differences [13,14]. Lake Chitu is shallow (max. depth 17 m) and is located in the Rift valley, a semiarid, hot lowland area at an altitude of 1600 m and is highly alkaline (>600 meq/L) and saline (>6%) (Figure 1).
Figure 1: Map showing the locations of the studied lakes in Ethiopia; Note: Lake Arenguade is not found in the rift valley region.
Water sample collection
From each lake, a total of 12 water samples were collected in 500 mL sterile screw-capped bottles, and sufficient space was provided for aeration and thorough mixing as described earlier [15]. All samples were labeled and coded as LC (Lake Chitu) and LA (Lake Arenguade/Hora Hado), followed by specific numbers to indicate location (site) and isolate number. Samples were transported to the Adama science and technology university applied microbiology laboratory and stored in a refrigerator at 4°C until analysis.
Isolation and screening of alkaliphilic actinomycetes
Production media for the cultivation of actinomycetes: For the cultivation of actinomycetes, both nutrient limiting and nutrient production media were used. The production media for the two soda lakes were chosen depending on the culturability of general actinobacterial and the geochemical properties of the soda lakes [16,17]. Actinomycetes cultures were isolated by serial dilution followed by plating of appropriate aliquots on various media, including Starch Casein Agar (SCA) composed of (g/L) soluble starch, 10; casein, 0.3; KNO3, 2; NaCl, 2; K2HPO4, 2; MgSO4.7H2O, 0.05; CaCO3, 0.02; FeSO4.7H2O, 0.01; agar, 18; Na2CO3, 10; and distilled water, 1,000 ml. Starch nutrient agar and humic acid agar composed of (g/L) humic acid, 1; Na2HPO4, 0.5; KCl, 1.71; MgSO4.7H2O, 0.05; FeSO4.7H2O, 0.01; CaCO3, 0.02; yeast extract, 1; and agar, 18. Na2CO3 was sterilized (121°C, 15 psi) separately as a 25% solution and added to the rest of the medium after cooling. One (1 mL) of nalidixic acid was added to the by dissolving 0.01 g of nalidixic acid in 10 mL of 100% methanol in a water bath at temperature adjusted to 37â?? to inhibit the potential growth of the contaminant gram-negative bacteria.
Morphological and biochemical characterization of selected isolates: Identification of actinomycetes at the genus level was performed by a polyphasic approach, including cultural, morphological, physiological, and biochemical characteristics as described in the international Streptomyces project guidelines. Accordingly, pure cultures were characterized for cell shape, color of aerial and substrate mycelium, micro and macroscopic characteristics of the aerial mycelium, whether diffusible mycelium pigments were pH sensitive or not, different incubation periods, utilization of organic and inorganic nutrients, tolerance to phosphate and salt concentrations, pH, and temperature stability. Taxonomic identification of the isolates was verified by the 16S rRNA gene [18].
Genomic DNA (gDNA)extraction and purification
Extraction of genomic DNA (gDNA) from water and sediment: Hard lysis method, a new protocol was designed for actinobacterial isolates due to their resistance to lysozyme treatment. Since soft-lysis methods are ineffective for gram-positive bacteria, fungi and algae, hard lysis methods are effective [19]. Three protocols were used to minimize bias introduced through isolation. The first method, a procedure described by Moore with additional modifications added by Malkawi, the second method, a procedure by Miller slightly modified by the including an overnight lysis instead of 2 hours, and the third, a modified hard lysis protocol described earlier was used in bacterial culture DNA extraction as described below.
About 2 mL of overnight liquid cultures were harvested by centrifugation at 10000. The cell pellets were washed twice with 0.1 M Tris-EDTA buffer at pH 8.0 and centrifuged at 10000. Then pellet was resuspended in 100 μL of breaking buffer solution, vortexed and added into a 2 mL eppendorf tube containing 100 ng of 50-70 mesh particle size seas. Approximately, 100 μL of PCI (Phenol: Chloroform: Isoamyl alcohol 25:24:1) was added and vortexed at full speed for 3 min. Afterwards, 200 μL of TE buffer was added and vortexed briefly before centrifugation at 10000 for 5 min. The supernatant was removed to prechilled 1.5 mL tubes followed by the addition of 1 ml ice cold 100% ethanol and left on ice for 10 min followed by centrifugation at 10000 for 5 min. The pellet was then resuspended in a solution containing 1 mL ice cold 70% ethanol and 10 μL 4 M NH4OAc, left on ice for 10 min and centrifuged at 10000 for 5 min. The resultant DNA pellet was air dried and resuspended in 50 μL TE buffer pH 8.0. DNA concentration in the suspension was determined spectrophotometrically using a nano drop and purity of the sample was evaluated by the A260/A280 and A230/A260 ratios. A 260/230 ratio of 0.3-0.9, and a 260/280 ratio of 1.6-1.8 was taken as optimum for DNA purity and low levels of inhibitors. About 5 μL aliquot of genomic DNA was loaded onto a 1.0% LE grade agarose gel containing 0.5 μg/mL ethidium bromide alongside a 0.3 μg/μL FERMENTAS™ 100 bp plus ladder. The chemiluminescence of the genomic DNA was compared to the ladder and its corresponding concentration was determined following the manufacturer’s specifications.
Oligonucleotide primers and PCR
The oligonucleotide primers used and the PCR conditions used during the course of this study are summarized in Table 1. For optimal amplification, genomic DNA was diluted in a range from 1 ng-50 ng depending on the concentration of inhibitory compounds. A standard PCR contained 0.2 mM each of dATP, dCTP, dGTP and dTTP, 2 mM of each primer, 2 mM MgCl2 and 0.25 μ polymerase enzyme. About 0.4 ng/μL bovine serum albumin solution was added in all genomic DNA amplifications. PCR amplification of the 16S rDNA fragments was performed using F1 (5-AGAGTTTGATCITGGCTCAG-3’ and R5 (5-ACGGITACCTTGTTACGACTT-3) primers as designed and used earlier. Fermentas DreamTaqTM polymerase was used in all general PCRs and carried out on an Eppendorf Multigene™ thermal cycler in 50 μL reaction volumes. PCR purifications were performed using ExoSAP-IT™ according to the company specifications and gel purifications also done using the Qiaquick™ Gel extraction purification system (Qiagen).
| Primer | For/Rever | Primer target | Primer Function | G+C Clamp | Sequence (5'-3') | Cycling parameters | Predicted size | |||||
|---|---|---|---|---|---|---|---|---|---|---|---|---|
| Fl | Forward | General bacterial 16SrRNA | General sequencing | None | AGAGTTTGATCITG G CTCAG | 95â??/4 min 30 × (95â??/30 s-55â??/30 s- 72â??/90 s) 72â??/10 min | 1500 bp | |||||
| RS | Reverse | None | ACGGITACCTTGTT A CGACTT | |||||||||
| 341F-GC | Forward | DGGE 16SrRNA | DGGE | Yes | CGCCCGCCGCGCG CGGCGGGCGGGGC GGGGGCACGGGGG GCCTACGGGAGGC AGCAG | 94â??/4 min 20 × (94â??/45s-65â??/45 s- 72â??â??l60s)20 × (94â??/30 s- 55â??/30 s-72â??/60 s) 72â??/10 min | 200 bp | |||||
| 534r | Reverse | DGGE 16SrRNA | DGGE | None | ATTACCGCGGCTGC T GG | 94â??/4 min IO × (94â??/45 s-65â??/45 s- 72â??/60 s) 25 × (94â??/30 s- 57â??/30 s-72â??/90 s) 72â??/5 min | 297 bp | |||||
| Act23Sr | Reverse | Actinobacterial specific! 6S | Clone library/DOGE | None | CGC GGCCTATCA GCTTGTTG-3 | |||||||
| 341F-GC | Forward | Yes | CGCCCGCCGCGCG CGGCGGGCGGGGC GGGGGCACGGGGG GCCTACGGGAGGC AGCAG | 450 bp-500 bp | ||||||||
Table 1: DGGE oligonucleotide primers used and the PCR conditions followed in this study.
Sequencing of isolates and construction of phylogenetic tree
From the constructed ARDRA groups, representatives were sequenced and a phylogenetic tree using 16S rRNA was made. Sequencing gel electrophoresis was done automatically by using an ABI PRISM® Bigdye™ terminator cycle sequencing kit (version 3.1). The principles and protocols used for this technique were adopted from previous reports. The obtained sequences were edited by using sequence editor Bioedit, and sequences that were not ‘bad’ were compared using BLAST (Basic Local Alignment Search Tool) at the National Centre for Biotechnology Information (NCBI) database. The isolates were then grouped by constructing an ARDRA table according to the information obtained in the restriction analysis to show which isolates grouped together as described in other literature.
Tree construction was performed using MEGA7 by using a Tamura-Nei distancing model and a neighbor joining tree building model. The resultant rooted tree topologies were re-evaluated by bootstrap analysis with 100000 seed counts and 1000 resamplings. A maximum likelihood Heuristic method with a nearest neighbor interchange was used for the construction of the novel isolate phylogenetic tree based on full length sequences (1300 bp). Bogoriella caseolytica was used as an out-group used to position the root of the tree for the novel Streptomyces isolates, and nucleotide sequences were sent to GenBank to obtain accession numbers.
Determination of Transcription Start Sites (TSSs) and promoter regions
A total of ten gene coding sequences starting with the ATG codon were identified and used in this analysis. To determine their respective Transcription Start Sites (TSSs), 1-kb sequences upstream of the start codon were excised from each gene. All the TSSs of each functional gene were searched within this region by using a Neural Network Promoter Prediction (NNPP version 2.2) toolset with the minimum standard predictive score (between 0 and 1) cut-off value of 0.8. This tool helps locate the possible TSSs within the sequences upstream of the start codon where the RNA polymerases start their activity and transcription process. The neural network promoter prediction tool has the ability to recognize precisely the position of a TSS for a given gene. For those regions containing more than one TSS, the highest value of the prediction score was considered to be a trustable and accurate prediction. According to a previously reported study, a promoter sequence was defined as a 1-kb region upstream of each TSS.
Identification of common candidate motifs and transcription factors
Identified promoter sequences were analyzed using the MEME version 5.0.1 searches, via the web server hosted by the National Biomedical Computation Resource (NBCR) to look for common candidate motifs that serve as binding sites of transcription factors that regulate the expression of genes. The MEME suite software searches for statistically significant candidate motifs in the input sequence set. The MEME output was presented in the form of XML and shows the candidate motifs as local multiple alignments of the input promoter sequences. Briefly, the MEME toolset discovers novel, ungapped motifs (recurring, fixed-length patterns) in sequences submitted in it.
A motif is an approximate sequence pattern that repeatedly occurs in a group of related sequences. MEME represents motifs as position-dependent letter probability matrices that describe the probability of each possible letter at each position in the pattern. MEME takes as input a group of sequences and outputs as many motifs as requested. MEME uses statistical modeling techniques to automatically choose the best width, number of occurrences, and description for each motif. Buttons on the MEME HTML output allow one or all candidate motifs to be forwarded for further analysis to better characterize the identified candidate motifs by other web-based programs, TomTom. The TomTom web server was used to search for sequences matching the identified motif for its respective TF.
Investigation for CpG Islands
CpG Islands were searched by two algorithms. The first, Takai and Jones’ algorithm (the stringent search criteria): In which GC content ≥ 55%, ObsCpG/ExpCpG ≥ 0.65, and length ≥ 500 bp were used. To do this, the CpG Island searcher program (CpGi130) web link was used. Secondly, to search the restriction enzyme MspI cutting sites (fragment sizes between 40 bps and 220 bps), the CLC genomics workbench ver. 3.6.5 was used. Searching for MspI cutting sites is relevant for the detection of CGIs because studies using whole-genome CpG Island libraries prepared for different species revealed that, CpG Islands are not randomly distributed but are concentrated in particular regions because CpG-rich regions are achieved by isolation of short fragments after MspI digestion that recognizes CCGG sites.
Data management and analysis
Microsoft excel software programs were used in the calculations of treatment means and summary tables presented wherever required. Descriptive data are presented using tables as percentages.
Identification of TSSs and promoter regions for each actinomycetes genome isolated from two soda lakes in Ethiopia are as follows:
In this analysis, gene coding sequences and TSSs were identified for each functional gene by excising 1-kb sequences upstream of the start codon, indicating that regulatory elements of the core promoter may lie up within this region. Only actinomycete genes LC-21 from lake Chitu and LA-21 from lake Arenguade had a single TSS, whereas 92% of genes contained more than two TSSs. Generally, only the actinomycete isolate (LC-13) gene from lake Chitu had a maximum of six (6) TSSs (Table 2).
| Gene ID | Corresponding promoter region | TSSs No. | Score predicted (0.8) | Distance from ATG |
|---|---|---|---|---|
| LC-13 | Pro- LC-13 | 6 | 0.97, 0.96, 0.93, 0.88, 0.87, 0.85 | -1221,-3481,-801, -1456, -953, -310 |
| LA-13 | Pro- LA-13 | 3 | 0.99, 0.93, 0.93 | -3402,-443, -3096 |
| LC-15 | Pro- LC-15 | 4 | 0.97,0.93, 0.83, 0.80 | -74, -810, -1779, -257 |
| LA-15 | Pro- LA-15 | 3 | 0.89,0.89, 0.85 | -2963,-3576-3051 |
| LC-17 | Pro- LC-17 | 3 | 0.99,0.89, 0.82 | -1694,-3576, -952 |
| LA-17 | Pro- LA-17 | 5 | 1.00, 0.99, 0.84, 0.82, 0.82 | -796,-3402,-556, -822, -413 |
| LC-19 | Pro- LC-19 | 3 | 0.99,0.99, 0.97 | -733,-934, -1608 |
| LA-19 | Pro- LA-19 | 2 | 0.97,0.83 | -2357, -4847 |
| LC-21 | Pro- LC-21 | 1 | 0.97 | -980 |
| LA-21 | Pro- LA-21 | 2 | 0.97,0.83 | -801, -1309 |
Table 2: TSSs and predictive score values of identified of actinomycetes.
Common candidate motifs and associated TFs in the promoter regions of actinomycetes genome
According to MEME searches actinomycetes genome promoter sequences, we identified seven (7) representatives motifs shared by most input promoter sequences that serve as binding sites of transcription factors that regulate the expression of actinomycetes genes (Table 3).
| Identified candidate motif | (%) of promoters containing each one of the motifs | E-value | Motif width | Total no. of binding sites |
|---|---|---|---|---|
| Mot I | 6 (85%) | 1.50E-11 | 49 | 6 |
| Mot II | 4 (57%) | 1.10E+04 | 9 | 4 |
| Mot III | 3 (42.8%) | 2.10E+04 | 8 | 3 |
| Mot IV | 2 (28.57%) | 3.20E+04 | 6 | 2 |
| Mot V | 2 (28.57%)) | 3.30E+04 | 7 | 2 |
| Mot VI | 1 (14.3%) | 1.50E+05 | 6 | 1 |
| Mot VII | 1 (14.3) | 3.60E+05 | 6 | 1 |
Table 3: Common candidate motifs identified in actinomycetes gene promoter regions.
As indicated in the result which includes LOGOS representing the alignment of the candidate motif and transcription factors with a measure of false discovery rate of the match and links back to the parent transcription database for more detailed information about it and in agreement with. The location and distribution of these candidate motifs in the promoter regions are dominated by Mot I relative to the TSSs. We observed twenty motifs distributed on the positive strand, whereas four motifs distributed on a negative strand. From our current analysis, Motif I was taken as the binding site for transcription factors responsible in the expression and regulation of these genes and the sequence logo for motif I is also presented in (Figures 2 and 3).
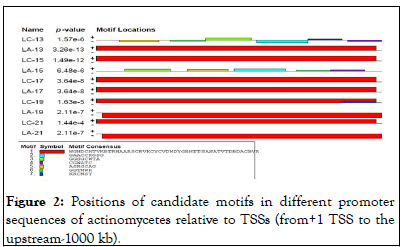
Figure 2: Positions of candidate motifs in different promoter sequences of actinomycetes relative to TSSs (from+1 TSS to the upstream-1000 kb).
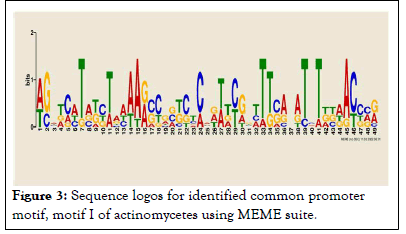
Figure 3: Sequence logos for identified common promoter motif, motif I of actinomycetes using MEME suite.
To obtain more information on the motif I promoter genes, we further used the TomTom web server. To confirm if there are similar to known or previously identified regulatory motifs for TFs, motif I was compared to already documented and publically available databases.
Accordingly, we observed that motif I matched with seven known motifs found in databases. Among seven (7) identified matched motifs, only six TF families were considered in the study, and a left query motif was nontranscription factor families (Table 4).
| TF families | Candidate transcription factors | Gene | E-value | p-value | q-value |
|---|---|---|---|---|---|
| Transcription AmrZ | Alginate motility regulator Z | AmrZ | 4.00E-01 | 4.76E-03 | 5.06E-01 |
| LexA repressor | Ala-Gly bond | LexA | 4.65E+00 | 5.53E-02 | 9.99E-01 |
| Activator protein LasR | LasR | 5.07E-01 | 6.03E-03 | 5.06E-01 | |
| Control protein A | HTH lacI-type | CcpA | 4.71E+00 | 5.61E-02 | 9.99E-01 |
| Putative regulator | LuxR family regulator | ExpR | 4.96E+00 | 5.90E-02 | 9.99E-01 |
| HTH-type regulator VqsM | VqsM | 6.36E+00 | 7.57E-02 | 9.99E-01 |
Table 4: Identified transcription factors which could bind to motif I.
Moreover, it was also revealed that motif I serves as binding sites for many TFs families. Depending on their significance value, alginate and motility regulator Z factor families (4.00e-01) were involved in the regulatory mechanism of actinomycetes genes, which used to enhance a transcription process.
Determination of CpG Islands in promoter regions of actinomycetes genes
To determine regulatory elements in actinomycetes in both promoter and gene body regions, CpG Islands were also investigated by using two algorithms. First, in silico analysis using Takai and Jone’s algorithm found no CpG Islands in all promoter regions in actinomycetes. Second approach to explore the presence of CpG Islands in silico digestion was performed using the restriction enzyme MspI, which revealed no CpG Islands in both promoter and gene body regions (Table 4). However, there were no CpG Island-specific sequences in the other ten promoter sequences of actinomycetes genes.
The Open Reading Frames (ORF)
As indicated in below actinomycetes isolated from lake Chitu (LC-13) and lake Arenguade (LA-13, LA-19, and LA-21) had start codon (functional gene) at 273 and end codon at 578 with a length of 306 found at negative strand. Moreover, only two isolates of both soda lakes (LA-17 and LC-17) had a functional gene which starts at 341 and 310 and ends with 778 and 636 having a length of 438 and 327 found at positive strand respectively (Table 5 and Figures 4-6).
| Sample sequence | Start | End | Length | Found at strand | Start codon |
|---|---|---|---|---|---|
| LA-13 | 273 | 578 | 306 | negative | ATG |
| LA-17 | 341 | 778 | 438 | positive | TTG |
| LA-19 | 273 | 578 | 306 | negative | ATG |
| LA-21 | 273 | 578 | 306 | negative | ATG |
| LC-13 | 273 | 578 | 306 | negative | ATG |
| LC-17 | 310 | 636 | 327 | positive | TTG |
Table 5: Identified functional gene (ORF) of actinomycetes isolated from two soda lakes.
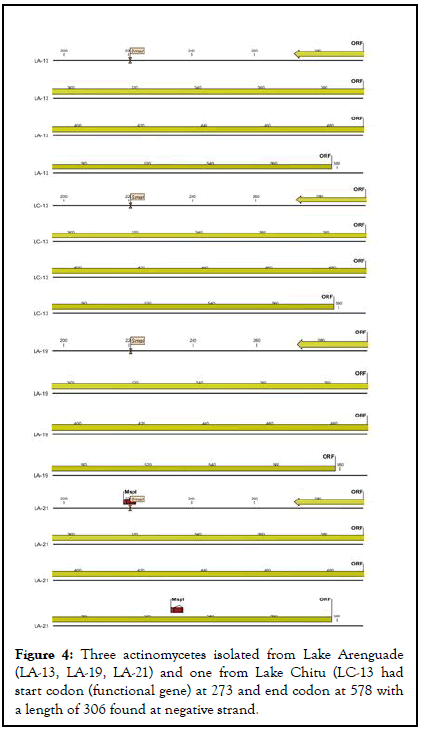
Figure 4: Three actinomycetes isolated from Lake Arenguade (LA-13, LA-19, LA-21) and one from Lake Chitu (LC-13 had start codon (functional gene) at 273 and end codon at 578 with a length of 306 found at negative strand.
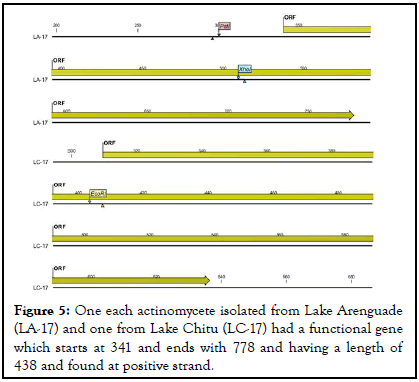
Figure 5: One each actinomycete isolated from Lake Arenguade (LA-17) and one from Lake Chitu (LC-17) had a functional gene which starts at 341 and ends with 778 and having a length of 438 and found at positive strand.
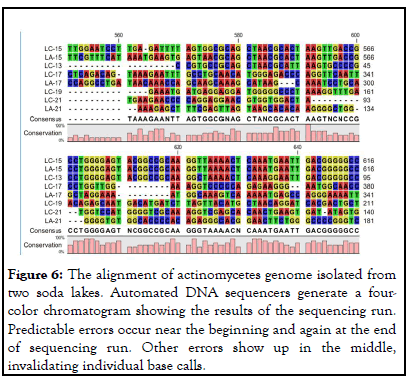
Figure 6: The alignment of actinomycetes genome isolated from two soda lakes. Automated DNA sequencers generate a fourcolor chromatogram showing the results of the sequencing run. Predictable errors occur near the beginning and again at the end of sequencing run. Other errors show up in the middle, invalidating individual base calls.
Phylogenetic tree
As indicated in, constructed phylogenetic tree showed that all actinomycetes isolated from two soda lakes shares distant evolutionary relationships with actinomycetes isolated from Lake Chitu (LC-19). Three actinomycetes isolated from Lake Chitu (LC-13, LC-15, LC-17) and two actinomycetes isolated from Lake Arenguade (LA-15 and LA-17) shared 100% similarity, although actinomycetes isolated from lake Arenguade early evolved when compared with the other. Moreover, two actinomycetes isolated from Lake Chitu (LC-21) and Lake Arenguade (LA-17) shared 84%-89% similarity with actinomycetes isolated from Lake Chitu (LC-19) (Figure 7).
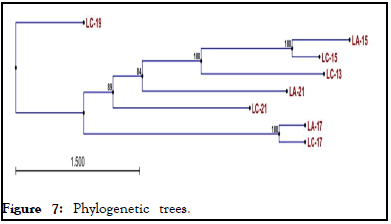
Figure 7: Phylogenetic trees.
The evolutionary history was gathered using the Maximum Parsimony (MP) method. The consensus tree inferred from the 104 most parsimonious trees is shown. Branches corresponding to partitions reproduced in less than 50% of are collapsed. The percentage of parsimonious trees in which the associated taxa clustered together is shown next to the branches. The MP tree was obtained using the close-neighbor-interchange algorithm, in which the initial trees were obtained with the random addition of sequences (10 replicates). All alignment gaps were treated as missing data. There were a total of 1169 positions in the final dataset, out of which 817 were parsimony informative. The phylogenetic analyses were conducted in MEGA11.
As some previous studies suggested, TSS and promoter region should be determined to understand gene expression regulatory mechanisms and association with genetic variations in the regions. During the current analysis, we first identified TSS for each of the ten (10) functional genes of isolated actinomycetes from two soda lakes. We observed that the prediction was more reliable for genes having more than one TSS and TSS of the highest prediction score was selected and investigated. Accordingly, our result showed that only actinomycete isolated from Lake Chitu (LC-21) and Lake Arenguade (LA-21) genes have a single TSS, whereas most of the genes had more than two TSSs. Furthermore, only the actinomycete isolated from Lake Chitu (LC-13) gene has a maximum of six (6) TSSs. Our current result is in contrast to a study reported by Yirgu, et al., in which 37.9% H. seropedicae ACP92s gene have more than one TSS, whereas 62.1% had only one TSS. The inconsistent of the results between the studies might be due to the differences in the genome size of the organisms. Baynham, et al. also reported that 70% of the Pseudomonas aeruginosa genes have more than one TSS, which is in agreement with the current analysis where majority of the isolated actinomycetes genes have more than one TSS.
In the current study, seven (7) representative motifs that are identical to most of actinomycetes gene promoter sequences were identified and motifs shared by most input promoter sequences were analyzed. The location and distribution of these candidate motifs in promoter regions are dominated by Mot I relative to the TSSs. This is inconsistent with the study reported by Halford, et al. 73.9% of the TSSs with different candidate motif were found within -500 bp relative to the translation start codon. Moreover, Bailey, et al. also indicated that multiple TSSs were concentrated between -440 bp to -489 bp relative to the ATG translation start codon.
A common candidate motif for seven (7) actinomycetes genes promoter sequences with a total of ten input sequences were produced by MEME. We observed that twenty (20) motifs were distributed on the positive strand and four motifs were distributed on a negative strand which is in agreement with previous study done by Yirgu and Kebede showed that in the H. seropedicae ACP92s gene, motifs were highly distributed in the positive strands than negative strands. Motifs shared by most promoter regions were considered as candidate motifs that are actively involved in the mechanism of gene regulation. In case of our present analysis, motif I was taken as the common promoter motif for 6 (85%) of genes that act as binding sites for TFs involved in the expression regulation of these genes and the sequence logo for this motif.
Furthermore, we used TOMTOM web server to get detail clue on the motif I promoter genes and correlated with known registered and publically available databases to determine their similarity to known regulatory motifs for TFs. We identified that motif I aligned with six (6) documented motifs in databases and only four (4) TF families were focused in the analysis and a left query motif was non-transcription factor families. Generally, On the basis of their E-value, pvalue, and q-value, alginate and motility regulator Z factor families (4.00e-01) were actively involved in the regulatory mechanism of actinomycetes genes. Baynham, et al. found that AmrZ gene functions as both a transcriptional activator and repressor of multiple genes encoding virulence factors as well as genes involved in environmental adaptation. Loewen, et al., also stated that transcriptional repressor OPI1 had a transcription corepressor activity as molecular functions.
To determine regulatory elements in both promoter and gene body regions in the actinomycetes, first we investigated CpG islands by using the Takai and Jones’ algorithm and there were no CpG Islands in promoter regions in actinomycetes. Our result is incoherent with the previous study done by Yirgu, et al., identified that one CpG Island in the H. seropedicae ACP92’s gene both in promoter and gene body regions. Furthermore, our founding is coherent with studies previously reported, they concluded that poor CpG Islands in both promoter and gene body regions. Similarly, a second approach to explore the presence of CpG Island in silico digestion was performed using different restriction enzyme and MspI, which revealed poor CpG Islands in both promoter and gene body regions. However, there were no CpG Island-specific sequences in the other ten promoter sequences of actinomycetes genes. Consequently, the present result contradict with the previous study done by Yirgu, et al. concluded that H. seropedicae ACP9’2 genes were rich in CpG Islands and were consistent with the studies of summarized as poor in CpG Islands in different eukaryotic organisms.
Only actinomycete isolated from Lake Chitu (LC-21) and Lake Arenguade (LA-21) genes have a single TSS, whereas 92% of genes contained more than two TSSs and actinomycete isolated from Lake Chitu (LC-13) gene has a maximum of six (6) TSSs. Three actinomycetes isolated from Lake Arenguade (LA-13, LA-19, LA-21) and one from Lake Chitu (LC-13 had start codon (functional gene) at 273 and end codon at 578 with a length of 306 found at negative strand. One each actinomycete isolated from Lake Arenguade (LA-17) and one from Lake Chitu (LC-17) had a functional gene which starts at 341 and ends with 778 and having a length of 438 and found at positive strand. Seven (7) candidate motifs shared by most input promoter sequences were investigated. The location and distribution of these candidate motifs in the promoter regions are dominated by Mot I relative to the TSSs and twenty motifs were distributed on the positive strand, whereas four motifs were distributed on a negative strand. Motif I was revealed as the binding site for TFs involved in the expression and regulation of these genes and matched with seven known motifs found in databases. Among seven identified matched motifs, only six TF families were considered in the study, and a left query motif was non-transcription factor families. Depending on their significance value, alginate and motility regulator Z factor families (4.00e-01) involved in the regulatory mechanism of actinomycetes genes, which used to enhance a transcription process. In case of CpG Island determination, there are no CpG Islands in both promoter and gene body regions of the actinomycetes genes but could still be expressed when they are methylated.
The research data analyzed in the current study will be available after accession number obtained from the NCBI genome assembly browser
The authors declared that there is no conflict of interest.
This work was financially supported by the graduate program of Adama science and technology university.
KC designed and performed the experiment, analyzed the data, and prepared the manuscript. KB and ZB supervised the research and revised the manuscript and was a co-author of the manuscript. The authors read and approved the final manuscript and agreed to be published.
The authors acknowledge Adama science and technology university, school of applied natural science, for funding the research.
[Crossref] [Google Scholar] [PubMed]
[Crossref] [Google Scholar] [PubMed]
[Crossref] [Google Scholar] [PubMed]
[Crossref] [Google Scholar] [PubMed]
[Google Scholar] [PubMed]
[Crossref] [Google Scholar] [PubMed]
[Crossref] [Google Scholar] [PubMed]
[Crossref] [Google Scholar] [PubMed]
[Crossref] [Google Scholar] [PubMed]
[Crossref] [Google Scholar] [PubMed]
[Crossref] [Google Scholar] [PubMed]
[Crossref] [Google Scholar] [PubMed]
Citation: Chali K, Bacha K, Belay Z, Muleta T (2023) Genomic Analysis of Actinomycetes Obtained from Two Soda Lakes in Ethiopia. Virol Mycol. 12:250.
Received: 08-Aug-2022, Manuscript No. VMID-22-18738; Editor assigned: 10-Aug-2022, Pre QC No. VMID-22-18738 (PQ); Reviewed: 24-Aug-2022, QC No. VMID-22-18738; Revised: 13-Jan-2023, Manuscript No. VMID-22-18738 (R); Published: 20-Jan-2023 , DOI: 10.35248/2161-0517.23.12.250
Copyright: © 2023 Chali K, et al. This is an open-access article distributed under the terms of the Creative Commons Attribution License, which permits unrestricted use, distribution, and reproduction in any medium, provided the original author and source are credited.