Journal of Geology & Geophysics
Open Access
ISSN: 2381-8719
ISSN: 2381-8719
Research Article - (2022)Volume 11, Issue 10
The study area lies in NE Sudan along the Eastern coast of the Sudanese red sea. The coastal plain is geologically characterized by Cenozoic siliciclastices and shallow marine rift related sedimentary sequences. The main subsurface stratigraphic units in the study area from bottom to top are: Basement Complex (Cambrian), Kareem Formation (Oligocene), Belayim Formation (Late Oligocene), Dungunab Formation (Miocene), Zeit Formation (Late Miocene), Wardan Formation (Late Pliocene) and Shagara Formation (Pleistocene-Holocene). The Total Organic Carbon (TOC%) and pyrolysis data are used to determine the source rock quality and quantity as organic richness, source rock generating capability and kerogen types of the source rock. The source rock characterization graph shows that Zeit Formation includes shale intervals of poor to very good TOC contents with average values ranging from 0.16% recorded in well Digna-1 to 2.76% in well Suakin-1 which was drilled in the Western periphery part of the East Tokar Basin. The average of S2 values in wells ranges from 0.26 to 2.1 reflecting the same wide range from poor to excellent generating potential. The relationships between the TOC values and each of the S1 and S2 values also indicate the direct relation between the organic carbon content (TOC) and the generation potential (S2) of shales in the area as the TOC increases with increasing of S2 values, which confirm the promising potential of the TOC-rich shale intervals of Zeit Formation as a potential and effective source rock. The different geochemical data obtained indicate that the organic matter of Zeit Formation source rocks is rich in type III (gas prone) kerogens mixed with markedly less type II (oil and gas prone) as proved by the conventional van Krevelen diagram using the elemental composition of kerogens (H/C and O/C atomic ratios). These results could be attributed to the marked terrestrial source of the organic matter which could be lacustrine, fluvial, estuary and deltaic sedimentary environments of the Zeit sediments.
Total Organic Carbon (TOC); Source rock; Kerogen
Everything that happens to hydrocarbon during generation, migration, accumulation and production affect their composition. Geochemistry methods measure compositional changes and can defect important variation, these variations and changes can reveal information that is critical to proper and efficient management of the hydrocarbon assessment. So, geochemistry methods are a tool for decision-making during every phase of hydrocarbon asset life. Application of geochemical technical techniques to the oil and gas exploration provide increased understanding of hydrocarbon generation, migration and accumulation process within a basin prior to drilling also geochemical techniques can outline complex basin filling histories, explain unusual oil and gas distribution and identify the source of oil and gas. These methods also have proven to be effective and inexpensive for reducing exploration risk. In applying petroleum geochemistry to solve exploration problems, a major focus is an analysis and interpretation of the compositions of the complex hydrocarbon fluid.
The study area
The study area lies in NE Sudan in the Red Sea State. It is bounded by longitudes 37° 30′ E and 38° 15′ E and latitudes 19° 00′ N and 22° 00′ N. The main physiographic features in the study area are part of Red Sea Hills in the West and coastal plain in the East. The Sudanese coastal plain is 740 km long, generally 20 km wide but increasing to 40 km at Halaib area on its Northern edge and to 50 km at Tokar Delta in the South. The coastal plain generally has gentle topography. It lies between the Red Sea and the erosional scarp that bounds the Red Sea Hills from the East. The coastal plain is predominantly made of interdigitating marine and continental deposits of Pleistocene and recent age, including raised coralline limestone near the shoreline and thick, very coarse, angular terrace deposits near the foot of the Red Sea Hills. These sediments overlie unconformably the tertiary deposits of the Red Sea littoral [1]. The main features of the coastal plain North of Port Sudan are the presence of several isolated outcrops of clastic and carbonate deposits; these include the Low Conical Hills, Eit outcrops, Jebel Saghum, Jebel Tobanam and Jebel Hmamit. These coastal hills are formed almost entirely of Carbonate, Gypsum and clastic deposits with a height of over 100 m and they extend North-South. The Southern extension of the Low Conical Hills trend in a curve–shape nearly to the Eastern escarpment of the Red Sea Hills. The width of the coastal plain in the study area is about 16 km. It is generally flat to gently sloping towards the Red Sea, interrupted by scattered sedimentary outcrops and ridges consisting of continental and marine sediments. The study area is covered mainly by recent deposits, characterized in the North-Eastern portion of the area mainly by sand dunes, alluvial terraces and sabkha deposits near the Red Sea shoreline. The Eastern and Northern parts of the area are flat and covered by gravel terraces of basic and acidic origin, except in the main course of Khor Eit, where the sediments are smaller in size. The Red Sea is a long narrow marine basin, with a total length in Sudan of about 740 km. It extends from the Eritrean border in the south to the border with Egypt in the North. Its maximum width is 306 km. The Red Sea is the Eastern boundary of the study area, with a width of about 148 km in the study area.
The stratigraphic frame work of the Sudanese Red Sea Cenozoic strata have been established through a series of studies since 1962, Carrella et al. [2], Sestini et al. [3], Bunter et al. [4]. The stratigraphy of the study area constituted by the following lithological units from bottom to top [5]: (A) Basement Complex (Cambrian): The igneous rocks in Digna-1 well are mainly metamorphosed from intermediate to basic igneous rocks (lower metamorphic facies). The Basement has been also reached in Durwara-2 well. (B) Kareem Formation (Oligocene): It is mainly defined in Durwara-2 well represented by sandstone and shale with a thickness of about 542 m. The section unconformably overlies metamorphic Basement rocks. (C) Belayim Formation (Late Oligocene): It is encountered only in two wells in the study area, Durwara-2 and Digna-1 wells with different facies. In the Durwara-2 well, the Belayim Formation is represented by sandstone and shale at the top and two main anhydrite beds at the bottom separated by shale interbeds. It has a thickness of 527 m. The lithology changes to mainly carbonate facies intercalated with thin anhydrite and shale beds in well Digna-1 well with a thickness of 429 m, dated as undifferentiated Belayim-Kareem. (D) Dungunab Formation (Miocene): It is composed of a very thick sequence of evaporites (rock salt and anhydrite) with thin beds of shales. The thickness ranges from 300 m-900 m [6-10]. The Dungunab Formation is represented in the study area by massive salt section ranging in thickness from 300 m in Digna-1 to about 870 m in Durwara-2 well. (E) Zeit Formation (Late Miocene): Top of the Zeit Formation is defined based on the first thick anhydrite bed. It is represented mainly by rapid intercalations between clastics (shale and sandstone) and evaporates (salt and anhydrite). The average thickness of Zeit Formation is about 1800 m-1900 m. Based on the lithology of Suakin-1 well, the Zeit Formation could be subdivided into three main units mostly separated by unconformity surfaces. The Upper Zeit is characterized by dark grey shale with anhydrite, salt and sand intercalations. The basal part of the Upper Zeit is marked by a vari-colored course grained sandstone bed that might represent an unconformity surface. The Middle Zeit is represented by light to dark grey shale, siltstone and thin evaporate streaks. It is characterized by the dominance of red shale with a relatively thick red shale bed near its base [11-15]. The Lower Zeit is topped by a relatively thick evaporite unit about 80 m in two beds at depth 2683 m in Suakin-1 well, which is correlated to a thinner unit (about 20 m) at 2558.5 m in Suakin-1 well. (F) Wardan Formation (Late Pliocene): It is dominated by sandstones, shales with siltstone and thin carbonate interbeds, and evaporate streaks. The thickness of Wardan Formation ranges between 410 m-1140 m. (G) Shagara Formation (Pleistocene-Holocene): It is represented by mixed lithofacies consisting of marine sand/sandstone section intercalated with claystone, partially with thin streaks of dolomite, anhydrite and limestone. The thickness of Shagara Formation ranges between 217 m-1240 m [16-20].
Objectives
The aim of this study is:
• The evaluation of the source-rock parameters of within the different penetrated formations in study area.
• Developing and measuring the maturity history of source rocks in the study area.
• Determination of the hydrocarbon generative potential of source rocks.
• Elucidate the mature areal extent of the source rocks and the preservation time limits of the expelled hydrocarbons.
The Total Organic Carbon (TOC%) and pyrolysis data are used to determine the source rock quality and quantity as organic richness, source rock generating capability and kerogen types of the source rock. The vitrinite reflectance measurements (Ro%) of some selected samples, which are the most powerful paleogeothermometer maturity indicator are used to detect the thermal maturity level of source rocks. The TOC-rich shale intervals within Zeit Formation are determined to be used in the volumetric assessment [21-26].
Organic carbon richness of Zeit Formation shale
The source rock characterization graph shows that Zeit Formation includes shale intervals of poor to very good TOC contents with average values ranging from 0.16% recorded in well Digna-1 to 2.76% in well Suakin-1 which was drilled in the Western periphery part of the East Tokar Basin. This suggest a high possibility to find higher carbon-rich shale beds (TOC>1.5%) in the central deepest area of the depocenter of the basins due to the good preservation conditions in the deeper parts of the depositional environments at that time. The isocarbon (TOC wt.%) map of Zeit Formation shale shows distribution of the organic content. TOC content increases towards the depocentral areas of the three basins and troughs, where it increases to about 4% at the Northern of North Suakin Basin, to 3.5% in the East Tokar Basin and to 2.5% in East Bashayer Basin indicating good to very good source rocks. However, these higher TOC values also suggest presence of organic rich shale in Zeit Formation in the depocentral areas, where it could be more than 4%. This may be attributed to the medium rate of sedimentation and subsidence, which allow for better preservation of the embedded organic matter and consequently higher TOC values. These deeper parts of the depocenters and troughs or grabens most likely contain potential source intervals of good generation potential. This is proved by the vertical distribution pattern of the TOC values with depth in the studied wells (Figures 1 and 2). In well Bashayer-2 (at East Bashayer Basin) the TOC-rich shale intervals (TOC>0.5%) exist at the Upper and Lower Zeit sequences measuring about 165 m (Figure 3 and Table 1). In well Suakin-2 (at East Suakin Basin) the TOC-rich shale intervals exist mainly in the Lower Zeit sequence measuring about 131 m, while in South Suakin-1 well, measures the maximum thickness, 565 m, existing in the three sequences; Upper, Middle and Lower. On the other hand, Digna-1 well has no TOC-rich intervals. The isolith map of the TOC-rich intervals in the study area shows bigger thickness values at the depocentral basinal areas or troughs where the thickness is up to about 600 m at North Suakin trough, 500 m at East Tokar Basin and South Suakin Trough, and about 400 m at East Bashayer trough (Figures 4 and 5).
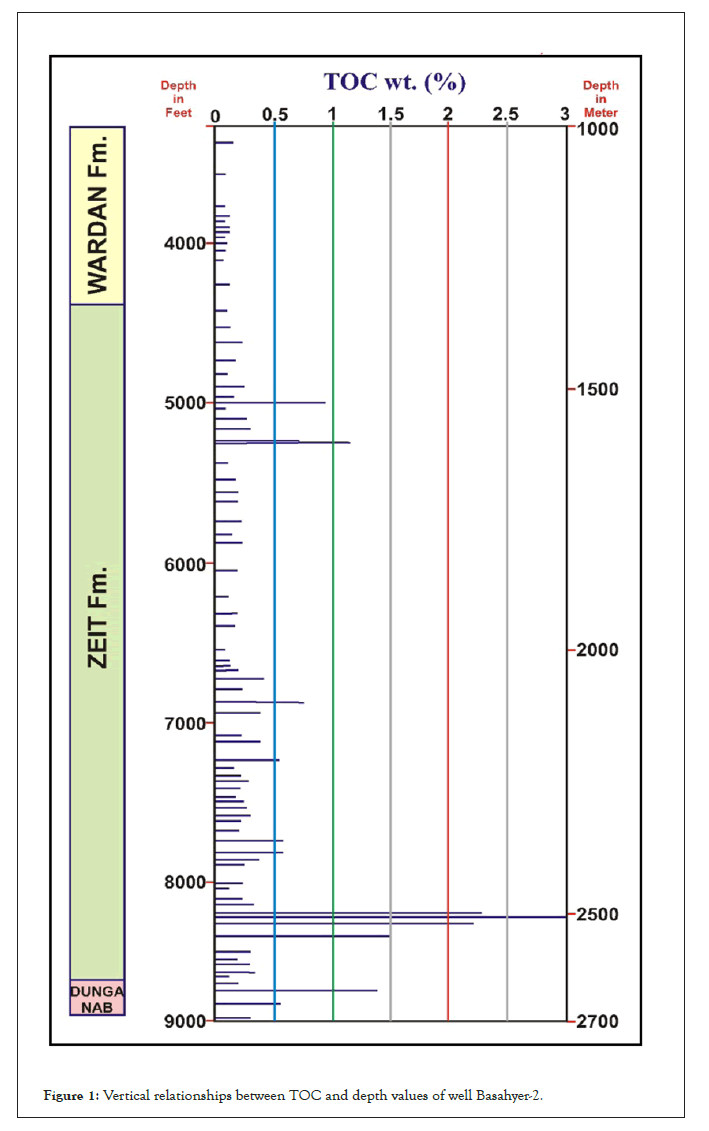
Figure 1: Vertical relationships between TOC and depth values of well Basahyer-2.
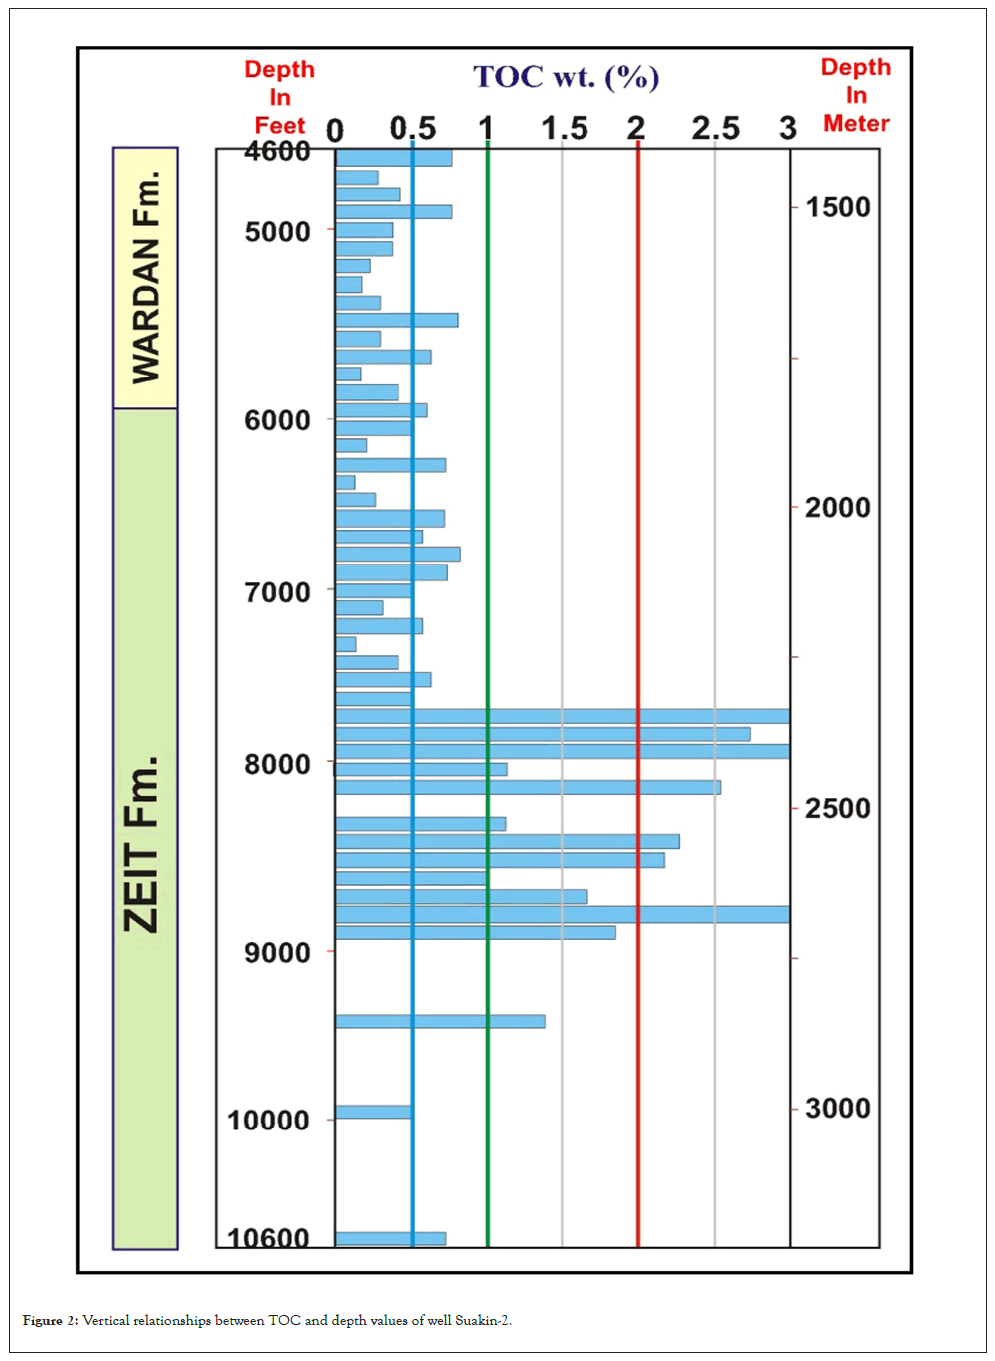
Figure 2: Vertical relationships between TOC and depth values of well Suakin-2.
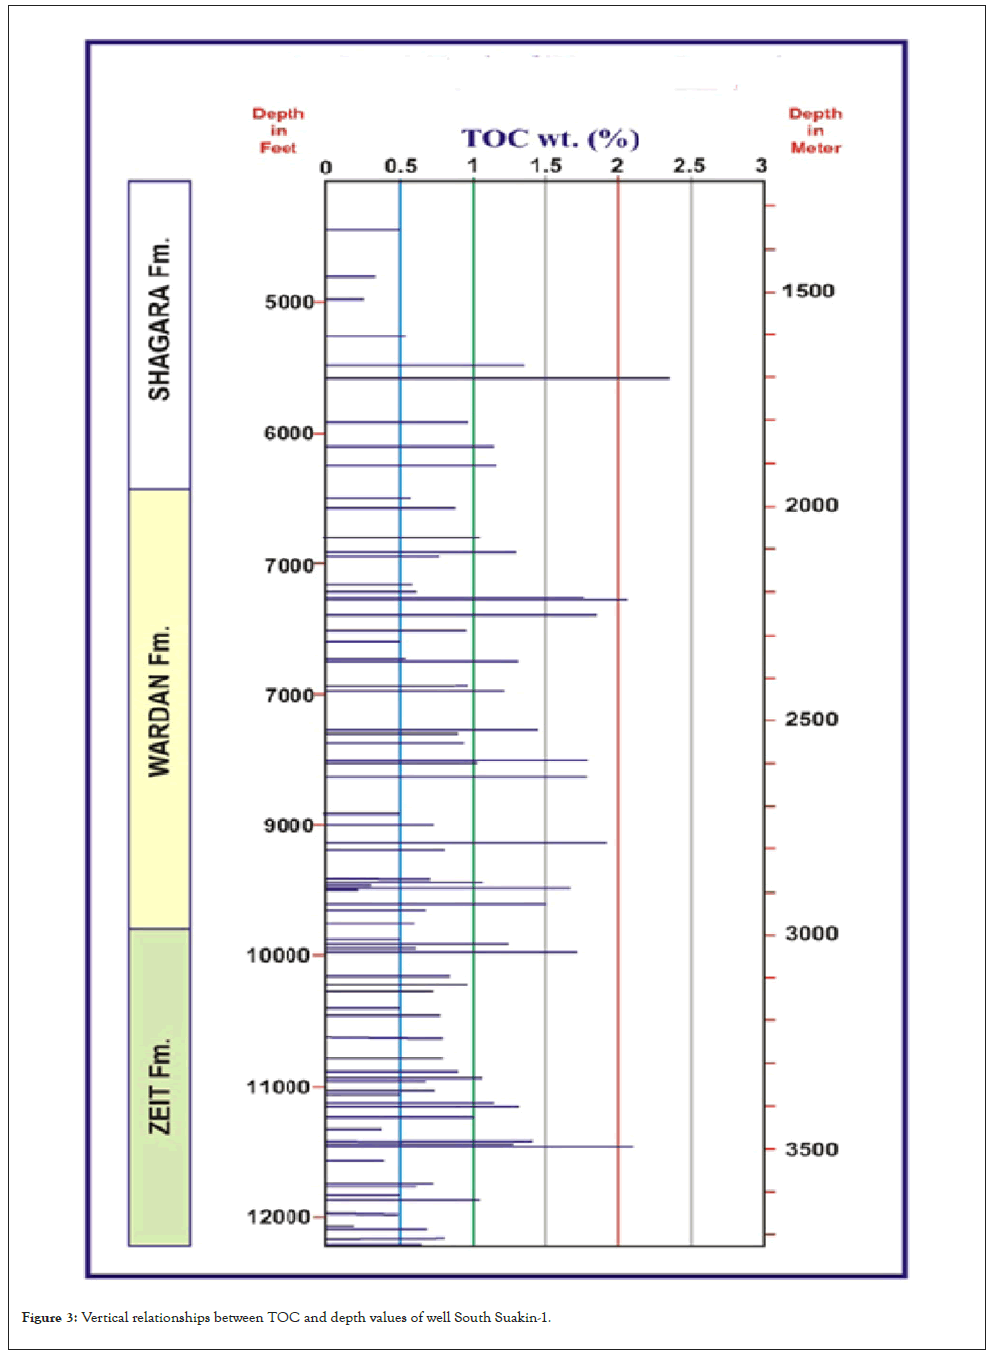
Figure 3: Vertical relationships between TOC and depth values of well South Suakin-1.
| Well name | Shale thickness (m) | Thickness of TOC rich intervals (m) |
TOC wt. % |
Ro% | S2 | S1+S2 | S1/(S1+S2) |
|---|---|---|---|---|---|---|---|
| Suakin-1 | 349 | 128 | 2.76 | 0.9 | 2 | 1.81 | 0.20 |
| Suakin- 2 | 260 | 131 | 1.83 | 1.09 | 2.1 | 2.92 | 0.52 |
| Bashayer2 | 479 | 165 | 0.55 | 0.6 | 0.3 | 0.7 | 0.43 |
| South Suakin-1 | 616 | 565 | 0.7 | 1.83 | 0.26 | 0.8 | 0.40 |
Table 1: Geochemical data (average values) of Zeit Formation shale in study area.
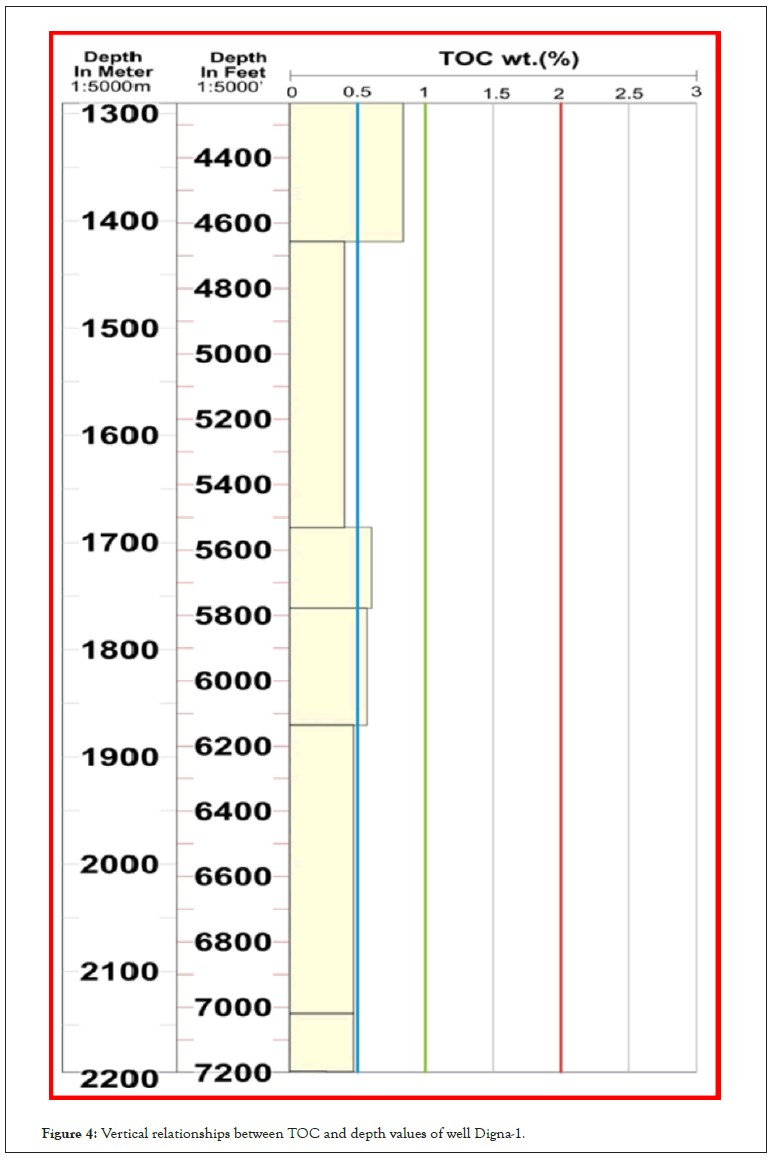
Figure 4: Vertical relationships between TOC and depth values of well Digna-1.
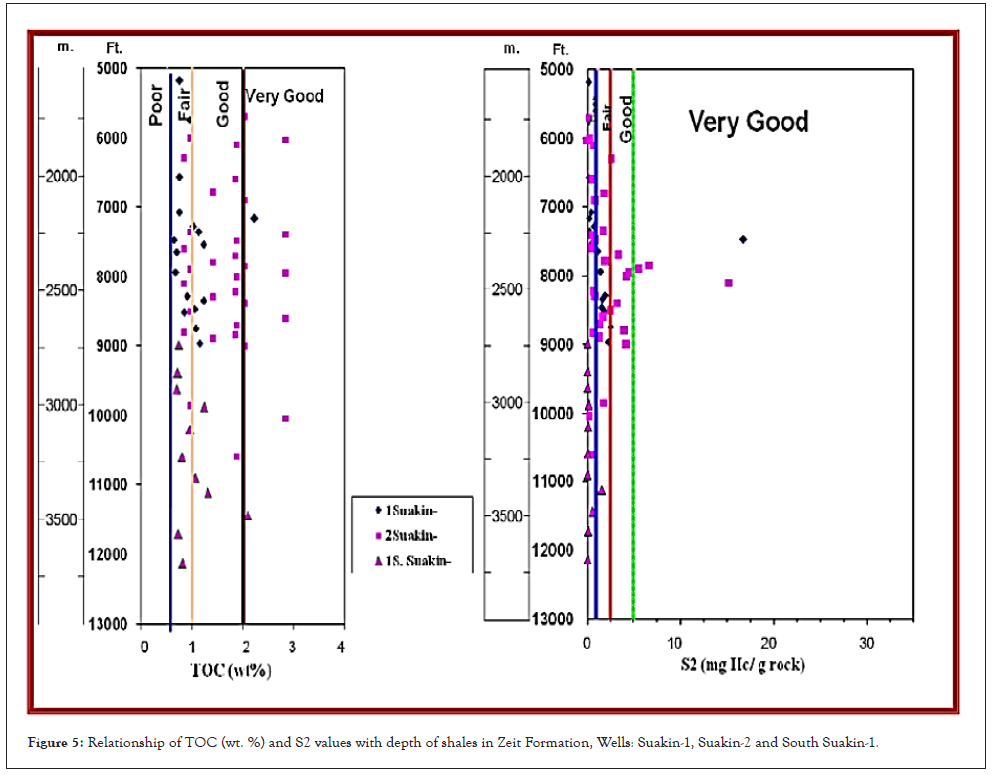
Figure 5: Relationship of TOC (wt. %) and S2 values with depth of shales in Zeit Formation, Wells: Suakin-1, Suakin-2 and South Suakin-1.
Source potential (generating capability)
The source generating (capability) potential of Zeit Formation is indicated by the S2 (mg HC/g rock) pyrolysis results (Figures 6 and 7). In well Suakin-1 the pyrolysis-derived S2 values of the pyrolyzed samples range from 0.2 to 16.79 mg HC/g rock, in well Suakin-2 the S2 values range from 0.01 to 4.24 mg HC/g rock and in well South Suakin they range from 0.03 to 1.58 mg HC/g rock while in Bashayer-2 well they are up to 0.9 mg HC/g rock reflecting a wide range from poor to excellent generating potential. The average of S2 values in wells ranges from 0.26 to 2.1 reflecting the same wide range from poor to excellent generating potential too. The iso-contour map of the S2 values shows the same distribution pattern and trends given by the organic carbon richness map. The S2 average values increases at the depocentral areas, where the average value is up to 4 mg HC/g rock in North Suakin trough indicating good potential source rock and in both East Tokar and East Bashayer troughs. The S2 average value measures 2.5 mg HC/g rock denoting fair potential source rock (Figure 6). The total genetic potential values (S1+S2, mg HC/g rock) of Zeit shales in Bashayer-2 and South Suakin-1 wells show poor source rocks since the values are smaller than 2 mg HC/g rock, while shales of well Suakin-2 indicates good source rock as the values are up to 7 mg HC/g rock in some samples (Figure 8). The same distribution pattern shown by isocontour map of S2 values is reached also by the total genetic values (S1+S2, mg HC/g rock) of Zeit shales, since the depocentral areas of the troughs show values up to 4 mg HC/g rock indicating good source rock. The only exception is the depocentral area at South Suakin-1 well where the value is about 1 mg HC/g rock denoting fair source rock. Plotting the free hydrocarbons (S1) values versus the TOC values of samples of Zeit shale source rocks indicates indigenous organic matter. This indicates that all the studied samples are free of contamination or migrant hydrocarbons. The relationships between the TOC values and each of the S1 and S2 values also indicate the direct relation between the organic carbon content (TOC) and the generation potential (S2) of shales in the area as the TOC increases with increasing of S2 values, which confirm the promising potential of the TOC-rich shale intervals of Zeit Formation as a potential and effective source rock (Figure 7). Study of the Production Index (PI) values of Zeit shale samples indicate that the depocentral areas of the troughs are characterized by migrating hydrocarbons since the PI values are bigger than 0.4, while the rest areas are located within the oil-window zone as the PI values range from 0.08 to 0.4. On the other hand, the Eastern offshore area and the Eastern shallow area close to the shore line are considered at the early generation zone with PI values less than 0.08. This is could be attributed to the tectonics, particularly faulting, which have affected the area after generation time and have changed the structural features giving rise to migration of generated hydrocarbons (Figure 8).
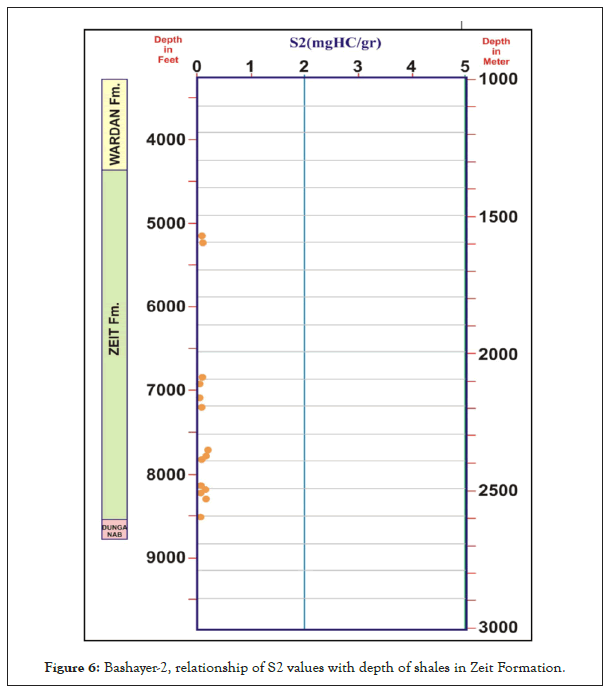
Figure 6: Bashayer-2, relationship of S2 values with depth of shales in Zeit Formation.
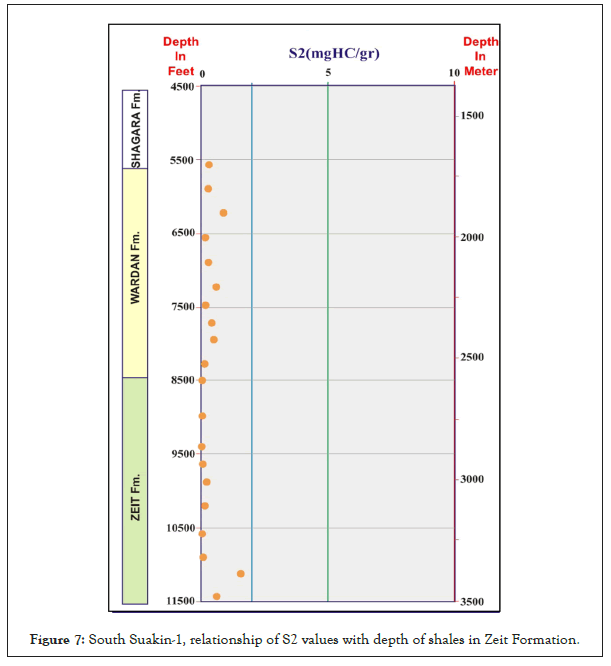
Figure 7: South Suakin-1, relationship of S2 values with depth of shales in Zeit Formation.
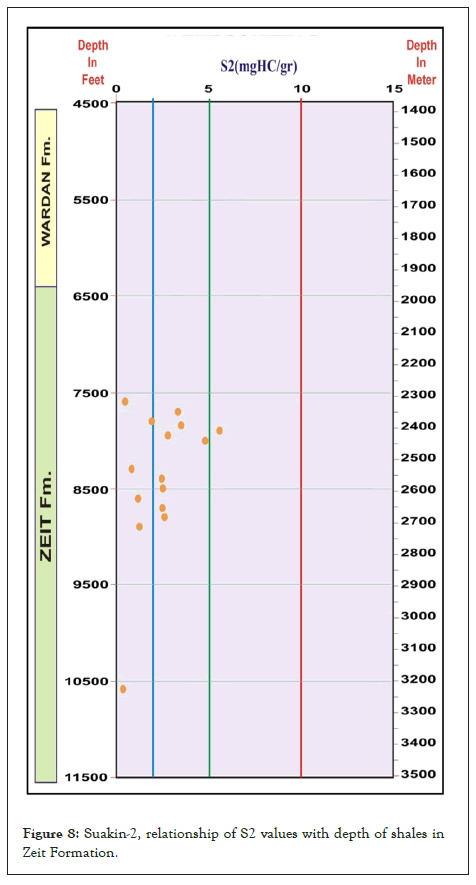
Figure 8: Suakin-2, relationship of S2 values with depth of shales in Zeit Formation.
Type of organic matter (kerogen quality)
The different geochemical data obtained (pyrolysis, kerogen elemental analysis and macerals) indicate that the organic matter of Zeit Formation source rocks is rich in type III (gas prone) kerogens mixed with markedly less type II (oil and gas prone) as proved by the conventional Van Krevelen diagram using the elemental composition of kerogens (H/C and O/C atomic ratios) (Figure 9). It is confirmed also by the modified van Krevelen diagram using pyrolysis results (Hydrogen Index (HI) and Oxygen Index (OI)). The hydrogen index of the analyzed Zeit Formation shales ranges from 4 to 595 mg HC/g TOC suggesting a wide range of poor to potential source rock for generating both oil and gas at optimum maturity. Plotting of HI versus OI of Zeit pyrolyzed samples on the modified van Krevelen diagram indicates that the predominant kerogen type is the Type III (gas-prone) with HI values less than 200 mg HC/g TOC. Few samples of Type II kerogen, which have HI ranging from 250 to 550 mg HC/g TOC, are indicated in wells Suakin-1 and Suakin-2 (Figure 9). However, Type I kerogen is not indicated in the studied samples although some high values of HI are obtained from shales of Suakin-1 and 2 wells (Type I kerogen shows HI values bigger than 550 mg HC/g TOC and OI values less than 50 mg CO2/g TOC). This could be attributed to the marked terrestrial source of the organic matter which could be lacustrine, fluvial, estuary and deltaic sedimentary environments of the Zeit sediments. The same kerogen types is reached by plotting the HI vs. OI of the modified van Krevelen diagrams of kerogens of each of wells Bashayer-2, Soth Suakin-1 and Suakin-2. One sample is located between zones of kerogen Types II and I on the diagram of well Suakin-2 which goes in harmony with the high HI values obtained for shale samples of wells Suakin-1 and 2. However, also concluded that the kerogen type in Lower Zeit (Dungunab) in Tokar-1 (St2) and Talla-1 (St) wells is type II while the kerogen type in the Zeit Formation in Tokar-1 (St2) well is mainly the type I and type II. Also this study reveals that the source shale intervals of Zeit Formation are characterized by predominance of kerogen Type III (gas prone) of autochthonous lacustrine origin and also allochtonous terrestrial organic material in the lacustrine and estuary regime mixed with Type II (oil and gas prone). This is in harmony with the mixed environments which are suggested for the Zeit Formation in all previous studies.
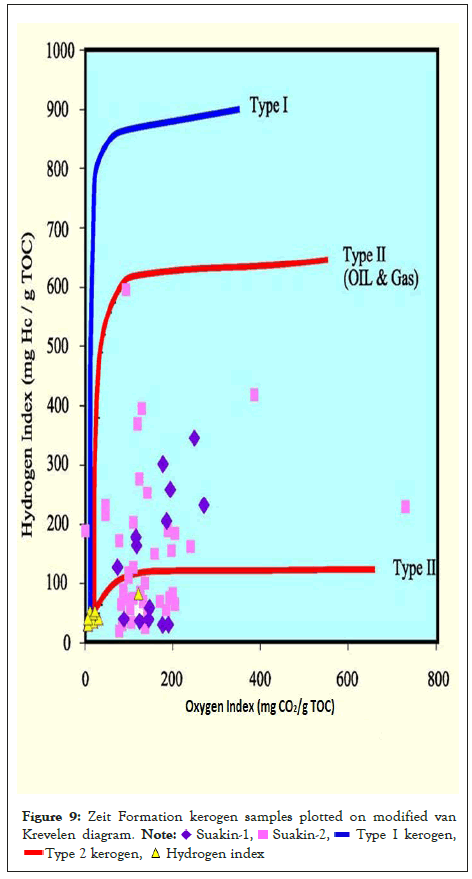
Figure 9: Zeit Formation kerogen samples plotted on modified van
Krevelen diagram. 
 .
.
• The Pre-salt system is under explored, penetrated only in two wells, Durwara-2 and Digna-1 wells with oil shows.
• The shale beds of the Zeit Formation represent fair to good potential and effective source rocks for existing discoveries in Block-15 area.
• Zeit Formation includes poor to very good TOC contents in the drilled wells. It There is a high possibility to find higher carbon-rich section (TOC>4 wt.%) in the deepest parts of the troughs.
• The dominant kerogen type of Zeit Formation is the gas-prone Type III of terrestrial origin, particularly in the Western near shore region of East Bashayer–South Suakin troughs. It might be the source for dry gas in Bashayer-1A well.
• The Suakin-Talla-Tokar area is characterized by the oil and gas prone Type II kerogen with insignificant amount of the oil prone Type I kerogen. To the far offshore region, the kerogen consists of mixed oil and gas prone Type II and gas-prone Type III of lacustrine to shallow marine origin. It might be the source for gas and condensate in the Suakin-1 discovery.
• The generated hydrocarbons from Zeit Formation source rock in the kitchen areas of the basins started to expel at time ranging from 2.6 to 5.7 My. This timing suggests high migration and accumulation efficiency for hydrocarbons generated in these basins for the post-salt petroleum system.
Author was indebted to Petroleum Labs, Researches and Studies (PLRS) most of core samples, data and direct support during field work in the study area.
Citation: Eltayib SHMA (2022) Geochemical Study for Evaluating the Source Rock and their Hydrocarbons Generation Potentiality in Zeit Formation, Sudanese Red Sea Coastal Plain. J Geol Geophys. 11:1056.
Received: 28-Nov-2022, Manuscript No. JGG-22-20477; Editor assigned: 30-Nov-2022, Pre QC No. JGG-22-20477 (PQ); Reviewed: 14-Dec-2022, QC No. JGG-22-20477; Revised: 21-Dec-2022, Manuscript No. JGG-22-20477 (R); Published: 28-Dec-2022 , DOI: 10.35248/2381-8719.22.11.1056
Copyright: © 2022 Eltayib SHMA. This is an open-access article distributed under the terms of the Creative Commons Attribution License, which permits unrestricted use, distribution, and reproduction in any medium, provided the original author and source are credited.