Journal of Geology & Geophysics
Open Access
ISSN: 2381-8719
ISSN: 2381-8719
Research Article - (2022)Volume 11, Issue 9
Vertical Electrical Sounding (VES) survey using Schlumberger electrode configuration was employed in Kipeto area, Kajiado County with an objective to determine the extent of natural flammable natural gas and to characterize its subsurface geo-electrical structures. Apparent resistivity was measured using a Geotron G41 terrameter. A Global Positioning System (GPS) was used to position each station in the field. A total of eight VES stations were conducted around the Gas point (BH1) with a maximum current electrode separation of 500 m. The data was qualitatively analysed with the help of computer software; IP2Win.The study provided preliminary findings of a possible displacement of water aquifer by a flammable gas in small signatures, which might be an extension of an extensive gas zone. In addition it was noted that this is enhanced by the fractured subsurface. The VES results revealed that the area has 2 to 5 geo-electric layers: Dump black cotton soil with resistivity average and thickness of 66.67 Ωm and 4.41 m; slightly weathered layer with 180.95 Ωm and 7.16 m; Fresh volcanic layer with 245.56 and 23.76 m; highly weathered volcanics with clay 11.6 Ωm and 5 m and Fresh weathered volcanics with 1146 Ωm and infinity thickness. At a depth from 200 m for VES 1,4,6 and 8, is an extensive layer of low resistivity about 6 Ωm-13 Ωm. This layer might be moist and muddy.
Geo-electric layer; Electrical resistivity; Natural gas; Subsurface; Kipeto Kajiado
This survey report, presents subsurface geophysical formations of Kipeto area, Kajiado County in Kenya. Geo-electrical survey using Schlumberger resistivity technique was employed to image and investigate possible extension of natural gas potential in the area. Due to the ability of Electrical resistivity method to map conductive and non-conductive zones of the layered subsurface it was considered for the survey. Therefore it was possible to establish both qualitative and quantitative research data of the area. High resistive layers signify a possible extension of natural gas. Due to availability of mixture of boreholes in the area with some dry and others with water and one with gas, a possible displacement was noted in low resistive zones along a fault line in the dry valley adjacent to the Gas point. The geology of the area and matching of the documented resistivity of the earth materials helped in characterization and modeling of the data obtained.
The study area
Kipeto area is located in Kajiado west sub county, Kajiado County in Kenya along Kiserian Kajiado about 70 km south west of Nairobi. The area is bounded by latitudes 1 30s and 2 00s and longitudes 3630E and 3700E. The average altitude of the area is about 1780 m (Figure 1).
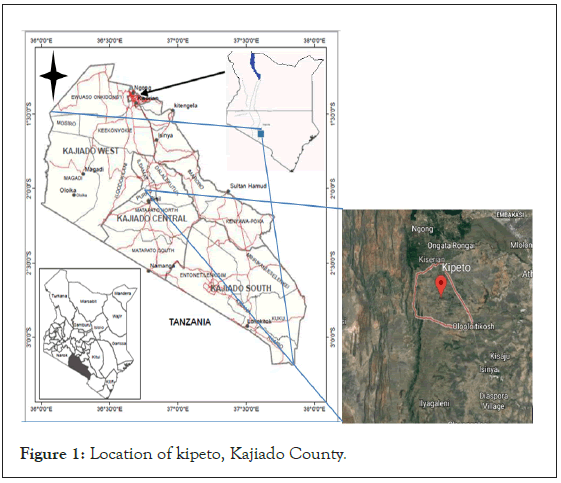
Figure 1: Location of kipeto, Kajiado County.
Geological setting of the area
The geology of the project area is majorly characterized by a thin layer of black cotton soil which is underlain by phonolites, trachyte and agglomerates of tuffs. The area lies in the Ol Doinyo Narok plateau at an altitude of 1700 m to 2050 m above sea level. The faulting in the area runs parallel to the Rift system in a North- South trend. Kipeto forms part of the extensive Mozambique belt to the east of the rift system, where Sedimentary strata of recent age and tertiary volcanic rocks dominate. Historically, volcanic activities has dominated the region which mainly comprises of lava successions trends and traceable sediments of Cenozoic age, with the oldest rocks of the Basement system being of Precambrian age which include gnesses, limestone and qurtites. These rocks are exposed due to intense erosion in the region distorting the cones of the mountain chains that have formed due to gradual compression and folding of the Basement over time. Kapiti phonolites which is the oldest of the sub-Miocene peneplain, extends to the east while Mbagathi trachytes, thins to the south and overlaps with olorgesaille phonoliotic nephelinite which was a recent volcanic event in the geological history of the area. However it forms a generally flat terrain with less dissection and few outcrops apart from some river valleys where they are defined. The Basement system is believed to have Sedimentary origin due to their layering and composition (Figure 2).
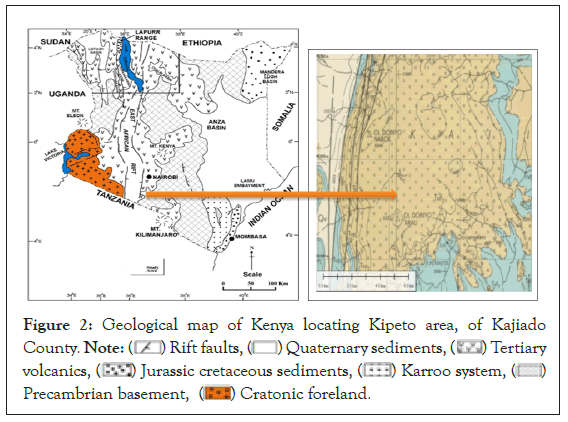
Figure 2: Geological map of Kenya locating Kipeto area, of Kajiado
County. Note: ( ) Rift faults, (
 ) Quaternary sediments, (
 ) Tertiary
volcanics, (
 ) Jurassic cretaceous sediments, (
 ) Karroo system, (
 )
Precambrian basement, (
 ) Cratonic foreland.
Geological surveys derive their roots back in the 1920’s courtesy of the Schlumberger brothers [1]. They involve injection of D.C electric current into the subsurface formation through copper electrodes and measuring ground impedance to the flow electric current, via a pair of potential electrodes. An alternating current of low frequency of about 20 Hz may be used. The subsurface geology parameters such as permeability, fluid type, minerals in the rocks are among some determinants of ground resistivity. Apparent resistivity data can be measured in the field, while with the help of computer iteration and inversion software, resistivity of different materials can be estimated quantitatively. This apparent, resistivity is an average of measured true resistivity of the earth section [2], since the earth is not a homogeneous body mass. According to Loke et al. [3], however, detailed information of vertical alignment of layers in terms of depth, thickness and resistivity is achieved through modeling of subsurface by plotting graphs of apparent resistivity against separation of current electrodes [4].
The Schlumberger array technique is employed using two current electrodes and two potential electrodes as four point array (Figures 3 and 4).
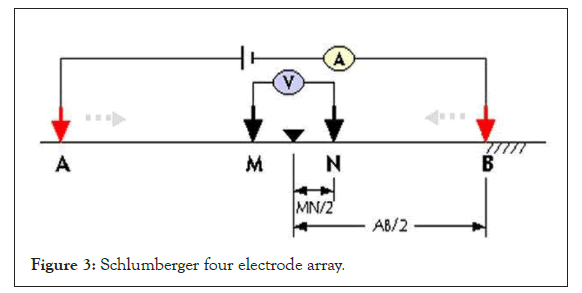
Figure 3: Schlumberger four electrode array.
D.C current is injected in to the formation through electrodes AB and measuring the resultant potential between potential electrodes MN. Apparent resistivity values are calculated using equation 1.

K is the geometric factor
The Geometric factor k is high dependent to the arrangement of the
four electrodes. With the advancement of the modern equipment, resistance  is given direct by the resistivity meters, therefore in
practice apparent resistivity is given by the relation

In this investigation the geometric factor K can be calculated from equation 3 and 4
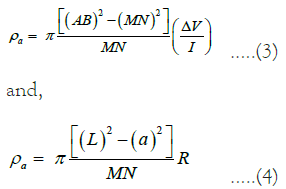
Figure 4: Approximate Resistivity values of common rocks.
Fieldwork and data collection
Geotron (model: G41) terrameter, a South African equipment (plates 2 and 3) was used for data collection due to its high precision and efficiency. The ability of this equipment to convert subsurface resistance values to apparent resistivity values saved a lot of time and financial resources in the field. The survey was carried out in an area of about 4 km2 . Using the gas point as a reference point 8 Vertical Electrical Sounding (VES) were carried out using Schlumberger technique with an orientation spacing AB/2 of 250 meters. Apparent resistivity values were recorded in a filed book at five potential electrodes MN/2 spacing of 0.5 m, 2 m, 5 m, 10 m and 25 m. The exact position and elevation of every VES was determined by the help a hand GPS device [5-7]. The apparent resistivity with depth was monitored where high resistivity subsurface zones would indicate a possible extension of the flammable natural gas (Figures 5 and 6).
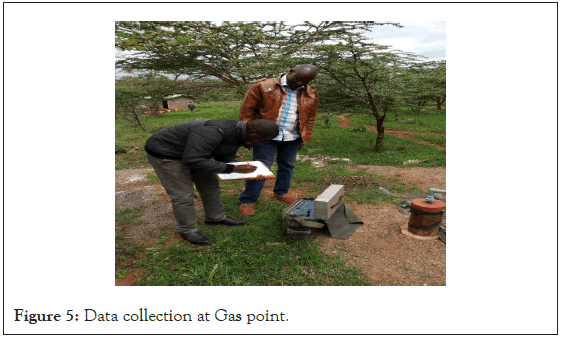
Figure 5: Data collection at Gas point.
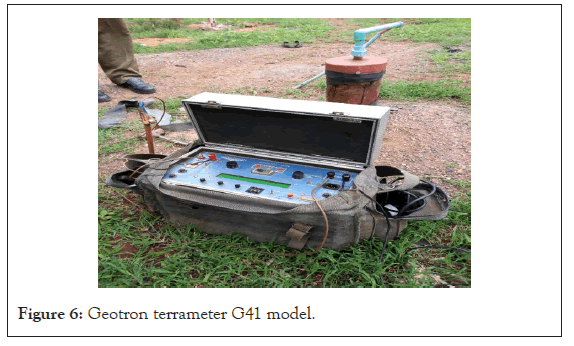
Figure 6: Geotron terrameter G41 model.
Vertical electrical Sounding data presentation
A total of eight sounding were established around the BH1 (Gas point). The layout was guided by the existence of a mixture of various drilled boreholes around the gas point which had variable characteristics. Some boreholes with water while some that were dry. A general layout is shown in the Figure 7 below.
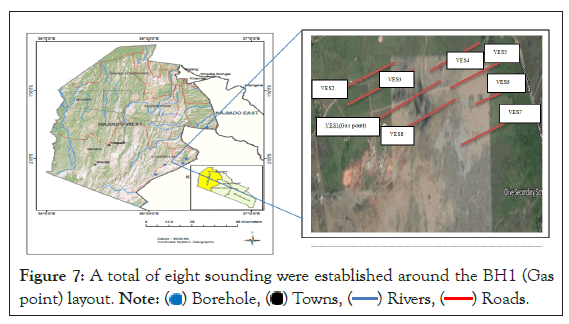
Figure 7: A total of eight sounding were established around the BH1 (Gas
point) layout. Note: ( ) Borehole, (
 ) Towns, (
 ) Rivers, (
 ) Roads.
IP2Win curve fitting
The generated curves shows red curve which is calculated and observed curves in black, accompanied by a detailed table showing more information about lithological layers and their individual resistivity, in ρ column, depth from the surface in d column, depth from VES point elevation in Alt column and layer thickness in h column. Resistivity value variation is shown by the blue curve [8- 10].
For VES 1, Figure 8, four lithological layers were imaged: the first layer with a resistivity of 58.0 Ωm has a thickness of about 3.46 m; the second layer with a resistivity of 8.96 Ωm has a thickness of 1.86 m; the third layer with a resistivity of 99.9 Ωm has a thickness of 50.2 m; the fourth layer with a resistivity of 0.154 Ωm has a thickness of 202 m and a basement being hit from depth of 258 m. The curve fitting has an accuracy of 9.0%.

Figure 8: Modeled and interpreted resistivity data for VES 1.
For VES 2, Figure 9, four lithological layers were imaged: the first layer with a resistivity of 29.1 Ωm has a thickness of about 0.472 m; the second layer with a resistivity of 664 Ωm has a thickness of 0.466 m; the third layer with a resistivity of 72.0 Ωm has a thickness of 7.19 m; the fourth layer with a resistivity of 5.55 Ωm has a thickness of 1.25 m and a basement being hit from depth of 9.38 m. The curve fitting has an accuracy of 5.28%.
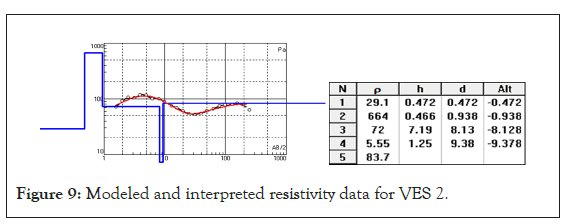
Figure 9: Modeled and interpreted resistivity data for VES 2.
For VES 3, Figure 10, four lithological layers were imaged: the first layer with a resistivity of 94.1 Ωm has a thickness of about 2.68 m; the second layer with a resistivity of 11.7 Ωm has a thickness of 0.247 m; the third layer with a resistivity of 99.5 Ωm has a thickness of 28 m; the fourth layer with a resistivity of 594 Ωm has a thickness of 21.2 m and a basement being hit from depth of 52.2 m. The curve fitting has an accuracy of 6.63%.

Figure 10: Modeled and interpreted resistivity data for VES 3.
For VES 4, Figure 11, two lithological layers were imaged: The first layer with a resistivity of 86.8 Ωm has a thickness of about 10.7 m; the second layer with a resistivity of 502 Ωm has a thickness of 9.33 m and a basement being hit from depth of 20.1 m. The curve fitting has an accuracy of 10.3%.
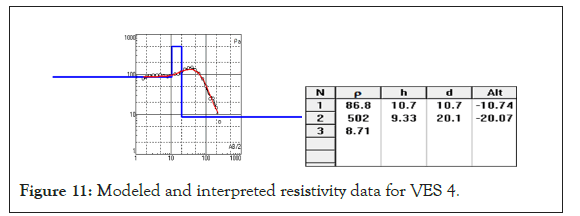
Figure 11: Modeled and interpreted resistivity data for VES 4.
For VES 5, Figure 12, five lithological layers were imaged: the first layer with a resistivity of 77.1 Ωm has a thickness of about 4.11 m; the second layer with a resistivity of 13.8 Ωm has a thickness of 1.16 m; the third layer with a resistivity of 724 Ωm has a thickness of 3.97 m; the fourth layer with a resistivity of 40.3 Ωm has a thickness of 9.31 m; the fifth layer with a resistivity of 1146 Ωm has a thickness of 18.8 m and a basement being hit from depth of 37.3 m. The curve fitting has an accuracy of 8.29%.
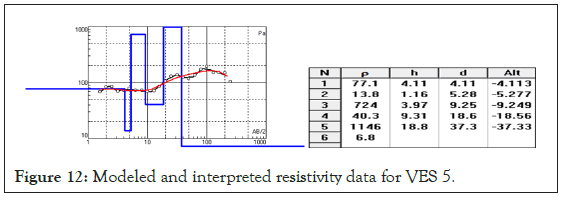
Figure 12: Modeled and interpreted resistivity data for VES 5.
For VES 6, Figure 13, four lithological layers were imaged: the first layer with a resistivity of 224 Ωm has a thickness of about 2.01 m; the second layer with a resistivity of 89.4 Ωm has a thickness of 3.74 m; the third layer with a resistivity of 294 Ωm has a thickness of 24.6 m; the fourth layer with a resistivity of 419 Ωm has a thickness of 15.4 m and a basement being hit from depth of 45.8 m. The curve fitting has an accuracy of 10.3%.
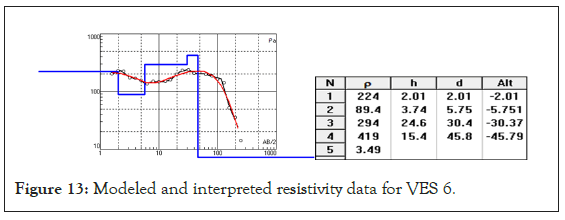
Figure 13: Modeled and interpreted resistivity data for VES 6.
For VES 7, Figure 14, three lithological layers were imaged: the first layer with a resistivity of 65.5 Ωm has a thickness of about 1.78 m; the second layer with a resistivity of 12.7 Ωm has a thickness of 3.26 m; the third layer with a resistivity of 184 Ωm has a thickness of 28.6 m; and a basement being hit from depth of 33.7 m. The curve fitting has an accuracy of 5.65%.
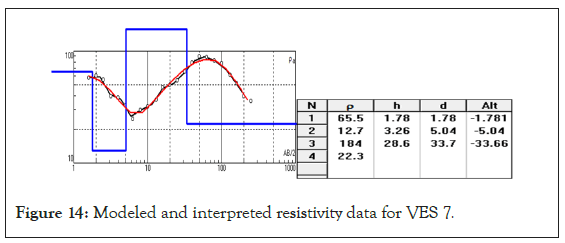
Figure 14: Modeled and interpreted resistivity data for VES 7.
For VES 8, Figure 15, two lithological layers were imaged: the first layer with a resistivity of 56.1 Ωm has a thickness of about 7.89 m; the second layer with a resistivity of 145 Ωm has a thickness of 37.2 m and a basement being hit from depth of 45.1 m. The curve fitting has an accuracy of 6.63%.
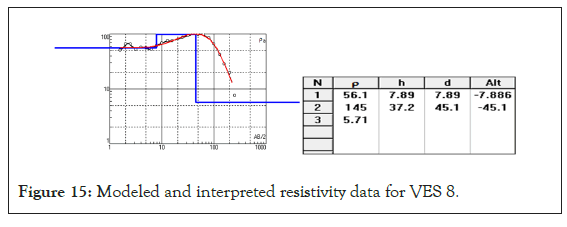
Figure 15: Modeled and interpreted resistivity data for VES 8.
Data interpretation
Qualitative interpretation: The collected field VES data was fed into Microsoft excel computer software which generated apparent resistivity curves that were interpreted qualitatively. The apparent resistivity data was plotted against half current electrode separation AB/2 on a log-log sheet. The primary interpretation was done through visual inspection of the trends of the achieved curves.
Apparent resistivity curves
VES 2 and 4 show increase in resistivity with depth to a depth of 10 m this is due to dry top soils beyond which VES 2 the resistivity decreases due to conductive layer. VES 1 and 3 shows moist top layer to a depth of 10 m beyond which resistivity increases. All shows conductive last layer with VES 1 and 4 being most conductive beyond 180 m this is due to presence of highly fractured and most layer (Figure 16).
Figure 16: Apparent resistivity curves against depths for VES1,2,3 and 4.
Note: ( ) VES1, (
 ) VES2, (
 ) VES3, (
 ) VES4.
VES 5, 6 and 8 indicate relatively high resistive top surface layers, this is due to presence of dry weathered top soils. This layer is followed by a low resistive layer which is sandwiched between resistive layers occurring between a depth of 5 m-10 m. Beyond a depth of 100 m the layer is highly conductive this could be due to weathered material or the presence of deeper aquifer. VES 6 however shows high resistive layers compared to VES 5, 7 and 8 (Figure 17).
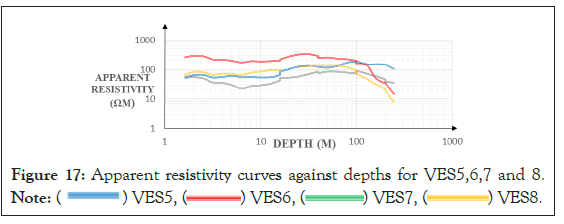
Figure 17: Apparent resistivity curves against depths for VES5,6,7 and 8.
Note: ( ) VES5, (
 ) VES6, (
 ) VES7, (
 ) VES8.
Pseudo cross-sections models
Measured apparent resistivity was presented in pictorial form as pseudo sections, showing cumulative resistivity along the VES points, which enhanced quantitative interpretation. IP2Win takes into consideration the geological nature and the effectiveness of the field data in its semi-automation interpretation. Electrical conductive litho-layers are presented by cool colours while warm coloration indicates those that are resistive. In Figure 18, directly below k2 and k3 is a formation of high resistivity, this could be due to outcrops of unweathered volcanics, however k7 shows an all depth low resistive layers to a depth of 250 m, this could be due to existence of highly fractured layers with substantial moisture content or metallic minerals. In Figure 19, below K4, K5 and K6 about a depth of 30 m to 100 m is a region of wide spread of high resistive zone bounded by yellow coloration. The highest resistivity in the area is averaged to be 350 Ωm–400 Ωm. The gas point VES (K1), shows an indication of high resistive signatures at a depth of about 50 m which is interrupted by a low resistive layer at about a depth of 110 m below the surface. Most profiles indicate an existence of an extensive moist layers probably wet muddy clay of about 5 Ωm–15 Ωm beyond 180 m onwards [11-13].
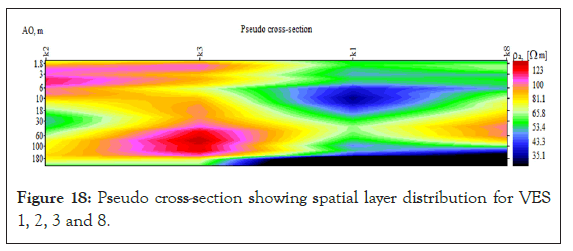
Figure 18: Pseudo cross-section showing spatial layer distribution for VES 1, 2, 3 and 8.
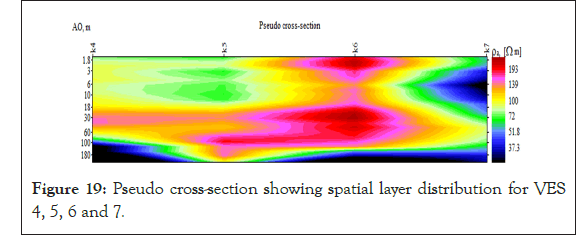
Figure 19: Pseudo cross-section showing spatial layer distribution for VES 4, 5, 6 and 7.
The field data was interpreted by comparing it with the geology of Kipeto area and matching with approximated values of electrical resistivity of various documented earth materials. Different geological layers and zones were identified from the models generated. The interpretation of resistivity pseudo-cross section shows the subsurface resistivity heterogeneities, this is due to a couple of faults which are identified below the subsurface. These faults however may be the boundary of different lithological layers. A high resistive body (layer) is noticed at a depth of approximate 50 m below the gas point sounding, which can be due to natural gas pockets hosted by relatively resistive rocks. This layer however is sharply interrupted by a relatively low resistive zone that extends downwards beyond 200 m. At a depth from 200 m for VES 1, 4, 6 and 8, is an extensive layer of low resistivity of about 6 Ωm-13 Ωm. This extension layer might be moist and muddy. However, water fill of pore spaces in the layer is a possibility due to low resistivity signatures observed. The existence of the layer explains the availability of dry wells in the area. A more extensive survey is however recommended in the area so as to get more subsurface information of the lithology of the area.
I wish to express my gratitude and special thanks to my supervisors Prof. Ambusso from Kenyatta University and Dr. Odek from Chuka University, for their great support and guidance throughout the project, I will forever be indebted. I cannot forget to extend appreciation to my postgraduate colleagues Baraza and Wechuli for their encouragement during my research.
Citation: Dancan K, Willis A, Antony O, Makoha B, Wechuli M (2022) Geo-Electric Investigation of Flammable Natural Gas in Kipeto Area, Kajiado County in Kenya. J Geol Geophys. 11:1051.
Received: 03-Nov-2022, Manuscript No. JGG-22-19944; Editor assigned: 07-Nov-2022, Pre QC No. JGG-22-19944 (PQ); Reviewed: 21-Nov-2022, QC No. JGG-22-19944; Revised: 28-Nov-2022, Manuscript No. JGG-22-19944 (R); Published: 05-Dec-2022 , DOI: 10.35248/2381-8719.22.11.1051
Copyright: © 2022 Dancan K, et al. This is an open-access article distributed under the terms of the Creative Commons Attribution License, which permits unrestricted use, distribution, and reproduction in any medium, provided the original author and source are credited.