Journal of Geography & Natural Disasters
Open Access
ISSN: 2167-0587
ISSN: 2167-0587
Research Article - (2023)Volume 13, Issue 2
The physical and tectonic setting exposes the western part of Cameroon to natural and anthropogenic hazards. Small scale landslides with devastating effects are recurrent along the Cameroon Volcanic Line. Limited studies have addressed the susceptibility to sliding in the area. This study therefore aimed at producing a landslide susceptibility map of the West Region to aid local and national authorities in land use planning and policy to minimize loss. Eleven conditioning and triggering factors were selected to investigate landslide susceptibility in the study area. These factors include; slope angle, lithology, soil, slope aspect, elevation, rainfall, geological faults, land use, normalized difference vegetation index, roads and river networks. These factors were assigned weights using the analytical hierarchy process. The weighted linear combination technique was used to derive landslide susceptibility indices and the susceptibility map. The map was reclassified into five classes; very low, low, moderate, high and very susceptibility class. About 16% (2180 km2) of the study area lies within the high to very high class while 47% (6512 km2) is found within the moderate class. Steep slopes, weathered volcanic rocks and thick soil cover at high elevations control the distribution of landslides while high intensity rainfall is the main triggering factor. Residential houses and road infrastructures along steep slopes are the most vulnerable to sliding. Site specific assessment needs to be conducted in order to implement effective mitigation measures.
Cameroon; Geographic information system; Landslide susceptibility; Multi-criteria decision analysis; Cameroon volcanic line; Remote sensing
On annual basis, over 1000 lives and property damage worth over $4 billion are lost as a result of landslides. Of all the natural hazards in 2019, about 11% (44) were landslides leading to over 1,293 deaths [1]. Studies show that most lives lost as well as property damage could be prevented if sufficient information and preventive measures were in place before a landslide event [2-4]. In many developing countries like Cameroon (Figure 1), several challenges are faced ranging from basic needs such as food, shelter, water and sanitation, health care, quality education, increased population growth, the prevalence of diseases, conflicts and climate change [5,6]. As a result of an increase in urban population and inadequate infrastructures, more unplanned development is taking place in unstable terrains increasing the likelihood of susceptibility to slides [7]. For better land use, urban planning and mitigation of the impact of landslides, it is imperative to understand the causes, spatial distribution and to map areas liable to future landslides [8,9].

Figure 1: Location of study, (a) Inset of African map indicating the location of Cameroon (dark polygon). (b) Inset map of Cameroon showing
the West Region (gold polygon). (c) Study area, the Divisions (Departments) in the West Region of Cameroon and landslide inventory.
Note: ( )
Inventory, (
)
Inventory, ( ) Roads, (
 ) Division Boundary, Elevation: (
 -2744 m), (
 -224 m)
The advancement in geospatial technology such as Global Positioning System (GPS), Geographic Information System (GIS) and remote sensing has contributed to hazard assessment, risk identification and disaster management [10]. GPS is a satellitebased navigation system that provides geolocation information and time anywhere in the world [11,12]. Several studies have demonstrated the use of GPS technologies in mapping landslides [11-16]. GIS technology is designed to collect, store, process, analyse, manage and present geographic or spatial data. It has been widely applied in the study of landslides in recent decades [17-20]. Remote sensing is the science and art of acquiring information about an object on the earth's surface without being in physical contact with it. Remote sensing has been applied in several studies for landslide hazard zonation [21-24].
Different methods and techniques have been employed in determining landslide susceptibility zones these include; deterministic, heuristic, statistical and multi-criteria decision analysis [9,25-32]. They can be grouped under two broad headings; qualitative and quantitative methods. Qualitative methods are subjective and present the landslide susceptibility maps in descriptive terms whereas quantitative methods give rise to numerical estimation in terms of the probability of occurrence of a landslide in a given zone [33]. The heuristic method relies on the investigator's knowledge of past landslide occurrences, causes and factors that contribute to slope instability. It is, therefore, a qualitative method that involves the ranking and weighting of causative factors according to their importance in contributing to slope failure [34-36]. A statistical method is a quantitative approach which deals with the analysis of the relationship between causative factors and prior landslide distribution. Statistical techniques commonly used in landslide hazard mapping include bivariate, multivariate, logistic regression and artificial neural networks [37-43]. Deterministic models are based on the analysis of existing slope failure mechanisms through physical models calibrated using onsite and laboratory tests [33,44].
Several factors are taken into consideration in landslide susceptibility mapping. Determining the contribution of each parameter to landslide susceptibility mapping is a complex problem. The Analytical Hierarchy Process (AHP) is a multicriteria technique for landslide hazard mapping that makes use of pairwise comparison of causative factors and expert knowledge of the investigator in assigning weights or priority scale to the factors [33,45-48]. The AHP method operates under four facets; formulation of the problem, determination of intended goal and alternatives, construction of pairwise comparison matrix, determining factor weights and deriving landslide susceptibility index using an aggregation method. Park et al. [33] investigated landslide susceptibility in Inje area in Korea using frequency ratio, AHP, logistic regression and artificial neural network and revealed that AHP performed well compared to the other methods. A similar outcome was obtained by Kavzoglu et al. [4] in Trabzon Province in Turkey where Multicriteria Decision Analysis (MCDA) outperformed logistic regression in determining landslide susceptibility zones. Vojtekova and Vojtek [9] used the MCDA technique in mapping landslides in Slovakia, they obtained a satisfactory result.
The physical and tectonic setting of Cameroon coupled with changing climatic conditions exposes the western part of the country to both natural and anthropogenic hazards [8,49-56]. Several natural and anthropogenic hazards have been recorded in Cameroon including; flooding, volcanic eruption, earthquakes, landslides and volcanic gas emission [51,52,57,58]. The western part of Cameroon has been hit by small but recurrent landslides leading to over 146 deaths, thousands of persons displaced and millions of dollars in property loss in the past three decades [50,53,59-62]. Most studies of landslides in this region have focused on mapping their occurrences and distribution as well as damages caused [49,53]. While Che et al. [8] produced a landslide susceptibility map for Limbe (a section of the tectonically active Cameroon Volcanic Line), the recent landslide in Gouache neighbourhood in Bafoussam (Figures 2a-2d), an area with no historical landslide record sheds light on the necessity to map the entire region. This study is therefore aimed at producing a landslide hazard zonation map that will be used by local and national authorities for land use planning and policy to minimize loss. The objectives of this work are; to identify areas more likely to be affected by landslides in the future using satellite images and the analytical hierarchy process, to understand the factors leading to slope instability in the region from the multicriteria decision analysis, to identify settlements and land uses in the high-risk zone for possible relocation or preventive measures, to increase awareness and add to the already growing data on hazards in Cameroon.

Figure 2: Recent landslides in the West Region of Cameroon, (a) Landslide scar. (b) demolished house along landslide path. (c) constructed houses along unstable slope. (d) recovery of materials and human remains from landslide debris.
Study area
The study area is situated in the geopolitical West Region of Cameroon within longitude 10° 30’ 00” and latitude 5° 30’ 00” (Figure 1). It is the smallest of the ten regions of Cameroon with a surface area of approximately 13892 km2, a total population of 1,921,590 as of 2015 and a high population density of 140/ km2 [63]. Bafoussam, the political capital of the West Region is located about 336 km from the national capital, Yaounde. The area has a moderate Equatorial climate resulting from high elevation and high humidity. Temperatures vary between 15°C to 28°C. This region experiences high rainfall averaging 1000-2000 mm/year [63].
The topography of the West Region is generally mountainous with elevations ranging from 224 to 2744 metres above sea level. As a result of the mountainous terrain, fast-flowing rivers are ubiquitous. Several crater lakes have developed from collapsed volcanoes. The area has a variable soil type comprising of ferralitic soils and alluvial soils derived from the weathering of plutonic and volcanic rocks.
The original forest vegetation has been cleared for agriculture giving rise to grassland vegetation. Patches of Woodland Savannah of the Sahel type are found distributed within the area. Plantation farming is practised on a small scale, with coffee, cocoa, tea and tobacco as the main cash crops. Livestock farming includes; cattle, sheep and goat rearing. Poultry and piggery farming is also increasingly practised in recent years. The region is well known for artistic and craftsmanship which involves the production of high-quality ceramics from clay, woodworks, brass and bronze casting and cotton textiles [63]. It is the most accessible region in Cameroon comprising of several paved roads linking Yaounde, Douala and Bamenda.
The geology of Cameroon is comprised of Precambrian basement rocks, sedimentary rocks of Cretaceous Period and Cenozoic Era and volcanic rocks of Cenozoic Era [64]. The Precambrian basement is subdivided into the Congo Craton (Archaean and Paleoproterozoic terranes) and the Central African Fold Belt (CAFB). The CAFB is a Neoproterozoic Orogen associated with Trans-Saharan Belt of West Africa which is linked to the Brasiliano Orogen of NE Brazil [65]. Three tectonic units have been identified in this belt; North Cameroon Domain, Central Cameroon Domain and South Cameroon Domain. The study area lies within the central domain comprised of intrusions of Pan-African granitoids emplaced through the control of zones of weaknesses along the Cameroon Volcanic Line [66]. The Cameroon Volcanic Line (CVL) is a chain of oceanic and continental volcanoes extending from the Pagalu Island to Lake Chad. It is oriented NE-SW extending over a length of 1600 km and a width of ~100 km [67,68]. The geology of the study area is made up of three main units;
• Garnet-bearing gneiss, migmatites and amphibolite
• Granitoids
• Basaltic rocks comprised of basaltic lava and dolerite dykes [66,69].
Data sources for landslide conditioning factors
Various factors have been selected to investigate landslide susceptibility in the study area. Table 1 details the type and source of data used in the assessment of landslides susceptibility. Thematic maps were generated from these data in a GIS environment. Given the paucity of literature in the study area, the selection of factors was based on a review of literature that conducted comparable assessments of landslide susceptibility in areas with similar characteristics [8,49,51,53,70,71]
Landsat 8 Operational Land Imager (OLI) images were downloaded from the United States Geological Survey website (Table 1). These images were layer stacked in ERDAS Imagine 2018 employing contrast enhancement and feathering techniques [72].
| Input data | Format | Map layer generated | Data source |
|---|---|---|---|
| SRTM DEM (30 m) | Raster | Aspect | USGS website (https://earthexplorer.usgs.gov/) |
| Slope | |||
| Elevation | |||
| Landsat 8 OLI | Raster | Land use map | |
| Image (30 m) | NDVI | USGS website (https://earthexplorer.usgs.gov/) | |
| Geology (1: 1, 000, 000 scale) | Raster | Lithology map | |
| Shapefile | Distance to fault | Van Schmus et al. [65] | |
| Soils | Shapefile | Soil map | Africa Groundwater Atlas, 2019 |
| Rainfall | Raster | Average monthly rainfall | NASA Earth Science Data (https://giovanni.gsfc.nasa.gov/) |
| Roads | Shapefile | Distance to road | |
| Rivers | Shapefile | Distance to river | OpenStreet Map (openstreetmap.org) |
Table 1: Input data set, format, generated layers and data source used in the study
Multicriteria decision analysis
Multicriteria Decision Analysis (MCDA) is a GIS-based method for decision making through the integration of geographic data and subjective judgements [73].
Analytical hierarchy process
An Analytic Hierarchy Process (AHP) is a form of MCDA quantitative method for decision making using factor weights through pairwise comparison [74]. This method measures both tangible and intangible variables through relative M weights given to each variable based on the preference of the researcher. It has been widely applied in MCDA, planning, natural and manmade resource allocation, and conflict resolution [75-79].
The AHP method has three distinct facets; decomposition, comparative judgment and synthesis of priorities. A complex problem is broken down into a hierarchy of variables or factors using a pairwise comparison matrix, factors are assigned weights on a nine-point scale (Table 2) [80]. The factors are arranged in a matrix form with the same number of rows and columns with scores assigned to each factor in comparison to other factors [81]. The scale of comparison of paired factors was determined from a careful literature review of landslide occurrences along the Cameroon Volcanic Line [52,54,55,61,62,82]. After generating the pairwise comparison matrix, weights of each factor were determined by calculating the principal Eigenvector of a square reciprocal of the metrics making sure they sum up to unity [31,73]. The pairwise comparison is based on two intrinsic questions to determine criterion or factor more important than the others and the extent based on a ratio scale of 1/9 to 9 (Table 2). The AHP calculation was undertaken using Microsoft excel.
| Intensity of importance | The verbal judgement of preference |
|---|---|
| 1 | Equal importance |
| 3 | Moderate importance |
| 5 | Strong importance |
| 7 | Very strong importance |
| 9 | Extreme importance |
| 2,4,6,8 | Intermediate values between adjacent scale values |
Table 2: Proposed scale for factor weighting in MCDA [74]
To validate the results of the pairwise comparison metrics and factor weights, the Consistency Index (CI) and the Consistency Ratio (CR) was determined [80]. The consistency index is given by
Where CI = Consistency Index
λmax = normalized highest Eigenvalue of the pairwise matrix
n = number of factors (11 factors in this study)
The consistency ratio shows how random the matrix ratings were selected as given by Saaty [81].
Where CR = Consistency Ratio RI = Random Index
Random Index (RI) has been proposed by Saaty [73] and presented in Table 3
| Factors (n) | 1 | 2 | 3 | 4 | 5 | 6 | 7 | 8 | 9 | 10 |
| Random Index (RI) | 0 | 0 | 0.58 | 0.9 | 1.12 | 1.24 | 1.32 | 1.41 | 1.45 | 1.49 |
Table 3: Random consistency index for deriving consistency ratio [74]
A consistency ratio of 0 implies perfect ratings of factors, CR of >0.1 implies inconsistency of the ratings. Saaty [81] suggested a re-evaluation of factor ratings for CR >0.1.
The result of a pairwise comparison matrix gives rise to factor weight which is then aggregated to generate a landslide susceptibility map [83-85]. Several methods have been employed to aggregate factor weights in generating susceptibility maps. These include; weighted linear combination, weighted sum, weighted overlay and ordered weighted average [9,31,72,84,86].
Data preparation
Landslide inventory: The first step involved in producing a landslide susceptibility map is to generate an inventory of past landslides [87]. Following the law of uniformitarianism, landslides are likely to occur in areas where past slope failures have been recorded [88,89]. Landslide inventory map can be used as a means for assigning weights to landslide triggering factors [90]. These maps can be generated from aerial photographs, field surveys, satellite images and existing landslides. Fourteen landslides were determined in the study area from the review of literature (Table 4) and the classification of satellite images (Figure 1).
| Location of slide | Date | Casualties/Damage | Source |
|---|---|---|---|
| Fossong-Wentcheng (Dschang) | Aug-1978 | 6 deaths, damage to plantation | Tchoua, 1989 |
| Mbankomo/Akok Bikanda | 1986 | No casualty | Ayonghe et al. 1999 [49] |
| Bakombo | Jun-1988 | 8 deaths, property damage | Ayonghe et al. 1999 [49] |
| Pinyin | 1991 | Destruction of farm land | Cameroon civil protection report 2008 |
| Santa | Sep-1992 | 12 deaths | Cameroon civil protection report 2008 |
| Gouata | Sep-1997 | 1 dead, damage to farmland | Ayonghe et al. 1999 [49] |
| Baingoh | Jun-1998 | 5 deaths, damaget to properties and farmland | Ayonghe et al. 1999 [49] |
| Nwa | 2000 | Destruction of plantation | Cameroon civil protection report 2008 |
| Bana | 2002 | Destruction of plantation | Aboubakar et al. 2013 [91] |
| Bamboutos | Jul-2003 | 23 deaths, 700 livestock killed, 1000 persons displaced | Ayonghe and Ntasin, 2008 [51] |
| Maga | Jul-2003 | 20 deaths | Kagou Ndongmo, 2006 |
| Bapi | Unknown | Unknown | Deduced from satellite images |
| Ngwenfon | Unknown | Unknown | Deduced from satellite images |
| Bassinte | Unknown | Unknown | Deduced from satellite images |
| Makpa | Unknown | Unknown | Deduced from satellite images |
| Yantou (Fomepea) | Unknown | 3 deaths, property damage | Zangmene, 2020 [92] |
| Kekem | Oct-2007 | 1 death, damage to farm land | Aboubakar et al. 2013 [91] |
| Koutaba | Oct-2011 | 2 deaths | Aboubakar et al. 2013 [91] |
| Gouache | Oct-2019 | 42 Deaths | Cameroon News Agency |
| Echiock | Aug-2020 | 1 death, damage to farm lands | Ndonbou, 2018 [93] |
Table 4: Landslide inventory derived from review of literature and satellite image analysis
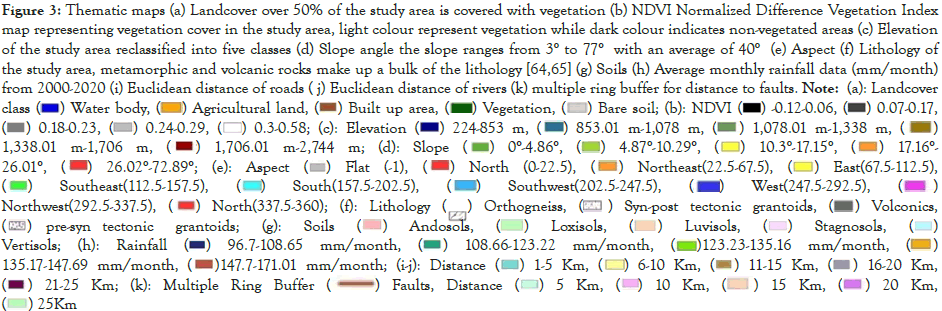
Land use and normalized difference vegetation index: Land use map was generated from the Landsat 8 OLI satellite image through supervised classification using maximum likelihood [94]. False-colour composite images and Google Earth were used to obtain training data through the polygon method. Five land cover classes were identified; water body, agricultural land, builtup area, vegetation and bare soil (Figure 3a).
Due to the influence of vegetation coverage on slope stability, Normalized Difference Vegetation Index (NDVI) was carried out to characterize vegetation extent in the study area equation 3
Where NDVI = Normalized Difference Vegetation Index
IR = Infrared (band 5)
R = Red (band 4)
NDVI analysis results in an output of values ranging from -1 to 1 where the negative values represent clouds, water and snow [95]. NDVI values of 0–0.1 represent barren land, rocks and soils while values of 0.6–1 represent dense vegetation (Figure 3b).
Elevation: A 30 m resolution Shuttle Radar Topography Mission (SRTM) Digital Elevation Model (DEM) was downloaded from the USGS website. The average elevation of the study area is 155 m, the lowest point is 224 m and the highest point is 2744 m (Figure 3c). Generally, areas with higher elevations are more susceptible to landslides. The elevation generated was reclassified into five classes to determine the level of contribution of each category to landslides.
Slope: The Digital Elevation Model (DEM) was used to generate a slope map, the slope in the study area ranges from 3.64° to 77.33° with an average of 40.49° (Figure 3d). Areas with steep slopes are often more prone to landslides [4]. The Slope was reclassified into five classes following the recommendation of Kumar et al. [90]. The categories are; flat to gentle, moderate, fairly moderate, steep and very steep slopes (Figure 3d).
Aspect: Aspect refers to the orientation of a slope from 0° to 360°. Sunlight exposure, drying winds, rainfall and discontinuities are factors associated with slope aspect which influences the degree of susceptibility to landslides [96]. Nine slope directions were generated and reclassified according to their contribution to landslide susceptibility (Figure 3e).
Geology: A scanned geologic map of Cameroon was georeferenced, the geology of the study area was digitized into polygons that were converted to raster format. Four lithologies were identified; pre-syn tectonic granitoids, syn-post tectonic granitoids, orthogneiss, and volcanic rocks (Figure 3f). The area has highly weathered volcanic rocks which have been identified in some studies as landslide-prone lithologies [53].
Soils: The stability of slopes depends on the soils they contain [97,98]. The soil map was digitized from the African groundwater Atlas map. The soil atlas was converted from shapefile to a 30 m raster file in Arcmap. Five soil types of varying permeability and susceptibility to landslides were derived; andosols, loxisols, luvisols, stagnosols, and vertisols (Figure 3g). Luvisols are the dominant soil type in the study area. Soils capable of holding water have a higher level of susceptibility [99].
Rainfall: The average monthly rainfall data of the study area from the year 2000 to 2020 were downloaded from the NASA Earth Data website, this data was interpolated to generate the rainfall map (Figure 3h). The average monthly rainfall ranges from 97 to 171 mm/month. The rainfall data were reclassified into five classes representing susceptibility levels.
Distance to road and river: Road cut and drainage density have been shown to influence slope stability [38,100]. Road and river network data was downloaded from the Open Street Map data repository as shapefiles. The shapefiles were converted to raster data with a resolution of 30 m. The Euclidean distance function in ArcMap was used to derive the distance to roads and rivers. Five classes were generated for both distances to road and distance to rivers (Figures 3i and j).
Construction of roads along steep slopes leads to slope instability which is exacerbated by vehicle movement and high- water retention capacity in cracks that result [38,101].
Distance to fault: From the georeferenced geologic map of Cameroon, faults were digitized into line features (Figure 3k). The multiple ring buffer function was used to generate a distance to faults. Five classes were derived with intervals of 5 km.

Aggregation of factor weights: In this study, the Weighted Linear Combination (WLC) method was used (Figure 4). This method is customized in many GIS platforms and it is flexible in combining thematic maps of conditioning factors to generate landslide susceptibility map [46]. It requires the standardization of classes within each factor to a common numeric scale. The factor classes are multiplied by the weights obtained from the comparison matrix and their results summed to obtain the landslide susceptibility index (equation 4).
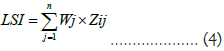
Where LSI = Landslide Susceptibility Index
Wj = Weight value of causative factor j
Zij = Weight value of class i of causative factor j

Figure 4: Flow chart of input data and processes used in generating the landslide susceptibility map
The landslide susceptibility indices generated was reclassified to derive the landslide susceptibility map using the Jenk classification method. The map was reclassified into five classes; very high, high, moderate, low and very low susceptibilities (Figure 5).

Figure 5: Landslide susceptibility map derived from the weighted linear combination of 11 conditioning factors
Note: Landslide class ( ) Very
low, (
) Very
low, ( ) Low, (
 ) Moderate, (
 ) High, (
 ) Very high
Landslide susceptibility map
Landslide susceptibility map was generated through the weighted linear combination method using 11 landslide conditioning factors (Figure 5 and Supplementary Table 1). The landslide susceptibility map was classified into five classes using the natural break (Jenk) method; very low, low, moderate, high and very high susceptibility. The Jenk method is a data clustering technique used to determine the best grouping of values into different classes by minimizing the deviation of each class from the class mean while maximizing the class deviation from the means of other groups [2].
To create a landslide susceptibility map using the AHP technique, a pairwise comparison matrix is constructed. The matrix is used in assigning factor ratings and for calculating factor weights (Supplementary Table 1 and Table 5). The consistency ratio determines the degree of consistency in assigning the factor weights. In this study, the Consistency Ratio (CR) is <0.1.
The area and percentage coverage of five landslide classes is presented in Table 6. From Table 6, the medium landslide category has the highest area coverage of 6512 km2 (47%) followed by the low category 3149 km2 (23%). The very low landslide category occupies 2051 km2 (15%). The lowest area coverage is occupied by the high landslide category 230 km2 (2%). The very high landslide category covers 1950 km2 (14%) of the study area. Therefore, about 16% (2180 km2) of the study area falls within the high and very high landslide category (Table 6).
Landslide model validation
To determine how successful the model is in predicting landslide susceptible zones, the landslide inventory was superimposed on the landslide susceptibility map see Table 6. From Table 6 43% of landslide inventory falls within the high to very high susceptibility class. About 36% of landslide falls within the medium class while 21% falls within the low susceptibility class. The result shows that no landslide has been recorded in the very low landslide susceptibility class.
Selection and weighting of conditioning factors
The reliability of the landslide susceptibility map generated depends on the selection of appropriate conditioning factors, the objective weighting of factors and the suitability of the model used [27,102]. The spatial scale of analysis has been identified as a determinant for choosing conditioning factors. For local spatial scale (1-30 km2), it is recommended that more accurate input data be used [9,103]. At regional, national or global scale, it is usually difficult to use site-specific data due to the variability of terrain features over large scales, therefore, more generalized conditioning factors are adopted [102-109]. The selection of conditioning factors was based on the review of literature which revealed similar slope failures along the Cameroon volcanic line [50,51,53,55].
A major challenge commonly encountered in landslide susceptibility analysis is the subjectivity involved in assigning weights to conditioning factors [110]. To objectively assign weights to these factors, some authors have suggested the use of landslide frequency ratio and weight of evidence [18,111]. Donati and Turrini [27], superimposed thematic maps of conditioning factors on landslide inventory map to determine factors most relevant to landslide susceptibility in Valnerina, Italy. This approach was adopted in the study.
Several GIS techniques have been employed to assess landslide susceptibility. Kavzoglu et al. [4] compared Multi- Criteria Decision Analysis (MCDA), Support Vector Machine (SVM) and Logistic Regression (LR) to determine landslide susceptibility in Northeast Turkey. It was found that MCDA using the Analytical Hierarchy Process (AHP) technique was far superior to logistic regression. Furthermore, Ahmed [31] examined three different MCDA methods in the Chittagong area in Bangladesh and obtained favourable results, though the weighted linear combination out-performed both AHP and Ordered Weighted Average (OWA). In a similar study, Feizizadeh and Blaschke [46] noted that the AHP method out-performed both WLC and OWA in a landslide study in the Urmia lake basin, Iran. As a result of the successes in the application of MCDA methods [9,75,76,112- 114], coupled with its ability to integrate different data layers with varying uncertainties, the MCDA technique was chosen for this study. The result obtained is representative of the study area when compared to the landslide inventory.
Causes of sliding in the area
Several factors interplay in making an area liable to sliding, both natural and anthropogenic influences on slope stabilities can be distinguished. Steep slopes (35-77°) and high elevation (700-2700 m) are responsible for most of the sliding in the study area this is in accord with the results obtained from areas with similar characteristic [101,115,116]. Weathered volcanic rocks and thick soil cover on steep slopes also contribute to slope instability in the study. This result is similar to that reported by Che et al. [8] and Buh [52] in the Limbe Municipality. Earthquakes have been identified as a landslide triggering factor [117-124]. Seismic induced landslides have been reported along the Cameroon Volcanic Line [49]. Buh [52] noted that earthquakes along the CVL are of low intensity and have no major association with landslides. An indirect link may be associated with the development of tension cracks leading to high infiltration of water and eventual slope failure. This is the scenario in the study area as evidence from the strike slip faults cutting through the high-risk zones [66,69]. As the case may be with several tropical terrains, studies point to a high intensity rainfall (100 mm/ day) over a short duration as the main trigger of landslides in Cameroon [52,55,61,62].
Rivers and roads appear to have less influence on landslide susceptibility in the study area. This is in contrast to the result of Che et al. [8] in Limbe where road cuts and slope erosion by rivers contributed to landslides. This could be explained by the fact that considerable preventive measures; retaining walls and slope terrace have been constructed along major high ways. Land use change is one of the anthropogenic factors leading to slope failure [125,126]. This is confirmed by the work of Alcantara-Ayala et al. [127] in Sierra Norte, Mexico where 72% of landslides occurred in areas with low vegetation cover resulting from deforestation. As a result of population growth and the construction of buildings along steep slopes with no engineering considerations, land use change will continue to have an impact on landslide susceptibility in the study area.
Uncertainties in landslide model assessment
In the MCDA using the AHP technique, errors may result from assigning incorrect factor weights. For example, Ahmed [31] noted that high susceptibility class was found at low elevation which is not normally associated with landslides. This resulted from the assignment of weight to some factors which occurred both in high as well as low elevations. Therefore, results obtained using MCDA may have inherent errors. As a result of the subjectivity in assigning factor weights, an incorrect weight assignment affects the accuracy of the susceptibility map generated [128]. Another source of error is the incorrect pairwise comparison of factors. Ahmed [31] suggested that different combination of factors be taken into consideration in order to derive the most appropriate factor weights. To ensure appropriate rating and weighting of factors, Saaty [75] and Eastman [80] developed the consistency index and consistency ratio for determining the randomness in assigning factor weights which in turn affects the quality of the susceptibility map generated. The consistency ratio for both factors and sub-factors is less than 0.1 (Tables 5 and 6) which is the cut-off set by Saaty [75] for revising factor weighting. Therefore, the susceptibility map created in this study is of good quality.
| a | b | c | d | e | f | g | h | i | j | k | Weight | |
|---|---|---|---|---|---|---|---|---|---|---|---|---|
| (a) Slope | 1 | 2 | 3 | 3 | 1 | 7 | 8 | 8 | 5 | 9 | 2 | 0.23 |
| (b) Geology | 0.5 | 1 | 2 | 2 | 0.33 | 5 | 7 | 7 | 4 | 7 | 1 | 0.14 |
| (c) Soils | 0.5 | 0.33 | 1 | 1 | 0.33 | 5 | 6 | 6 | 3 | 5 | 0.33 | 0.09 |
| (d) Aspect | 0.5 | 0.33 | 1 | 1 | 0.33 | 4 | 2 | 2 | 0.5 | 3 | 0.33 | 0.05 |
| (e) Elevation | 1 | 3 | 3 | 3 | 1 | 6 | 7 | 7 | 5 | 7 | 3 | 0.23 |
| (f) Rainfall | 0.14 | 0.2 | 0.2 | 0.25 | 0.17 | 1 | 2 | 2 | 0.33 | 3 | 0.2 | 0.03 |
| (g) Road | 0.13 | 0.14 | 0.17 | 0.5 | 0.14 | 0.5 | 1 | 1 | 0.33 | 2 | 0.14 | 0.02 |
| (h) Rivers | 0.13 | 0.14 | 0.17 | 0.5 | 0.14 | 0.2 | 1 | 1 | 0.33 | 2 | 0.14 | 0.02 |
| (i) Landuse | 0.2 | 0.25 | 0.33 | 2 | 0.2 | 3 | 3 | 3 | 1 | 4 | 0.25 | 0.05 |
| (j) NDVI | 0.11 | 0.14 | 0.2 | 0.33 | 0.14 | 0.33 | 0.5 | 0.5 | 0.25 | 1 | 0.14 | 0.01 |
| (k) Fault | 0.5 | 1 | 2 | 2 | 0.33 | 5 | 7 | 7 | 4 | 7 | 1 | 0.14 |
| CI | 0.07 | |||||||||||
| CR | 0.04 |
Table 5: Normalised pairwise comparison matrix, consistency ratio and factor weights
| Landslide class | Area (km2) | Area (%) | % of inventory |
|---|---|---|---|
| Very Low | 2051 | 15 | 0 |
| Low | 3149 | 23 | 21 |
| Medium | 6512 | 47 | 36 |
| High | 230 | 2 | 14 |
| Very High | 1950 | 14 | 29 |
| Total | 13892 | 100 |
Table 6: Area, percentage coverage and validation of landslide classes
The quality of the data set used may also introduce errors in the map generated. The spatial resolution of satellite images and SRTM DEM constraints its effectiveness in studying landslides which also affects the thematic maps derived [19,129,130]. Petley et al. [105] were successful in identifying just 25% of landslides in Nepal’s highlands using Landsat 7 ETM+ images with a 30 m spatial resolution pan sharpened to 15 m. Nichol and Wong [131] showed that at a 1 m spatial resolution, satellite images may not be suitable for identifying small scale landslides (<10 m wide). Therefore, a 30 m spatial resolution satellite image and DEM is not suitable for this study given that most of the landslides along the CVL are of small scale [58,60,61,132]. However, this is the data set freely available for the study.
When georeferencing and digitizing raster data, errors are usually introduced [133]. To reduce the error margins, ground control points were carefully selected and a first order polynomial was used to georeference the geologic, faults and soil maps. Topological rules (no overlapping, no dangle lines and no pseudo lines) were used to ensure accurate digitizing of faults, geology and soil maps [133]. The rainfall data obtained from the NASA Earth Data website was interpolated using the kriging technique [134]. An averaging algorithm was used to fill in the missing time gap data [135]. Data acquired from Open Street Map (OSM) may be inaccurate resulting from the contribution of data from volunteers with little to no geospatial knowledge. However, the availability of high-resolution aerial and satellite images enables efficient data collection and validation of digitized features.
Risk assessment
The ultimate aim for undertaking a landslide susceptibility assessment is to determine land-use types that might be affected in an event of a landslide in order to implement mitigation measures [101,136]. A qualitative approach was used to determine the risk associated with landslide categories in agricultural land, urban area and road infrastructures. Some roads in the study area are found within high-risk zone, for example, about 42 km of the Bafoussam-Foumban highway lies within the very high susceptibility class while 22 km passes along the high susceptibility class (Figure 6). Similarly, the national road (N4) running from Douala-Bafoussam cuts across the moderate susceptibility class for over 58 km and the high category for about 6 km (Figure 6). Furthermore, the Mbouda-Bamenda highway passes through the moderate susceptibility class for over 48 km [137-139].

Figure 6: Roads and urban areas in high to very high landslide susceptibility zones
Note: Landslide class () Very
low, () Low, () Moderate, () High, () Very high
Results show that about 10% of the urban area comprising of parts of Foumban, Foumbot, Bafoussam, Santchou, and Mbouda falls within the very high class (Figure 6). About 7% of the urban area including parts of Bafoussam, Bangante, Santchou lies within the high category. Over 30% of the urban area is located in the moderate susceptibility class. Residential houses built along unstable slopes have been identified as the most vulnerable to sliding. Another important land use which might be affected by landslides is agricultural land. Over 50% of agricultural land is found within the moderate susceptibility category. This has been identified in some studies as a landslide inducing factor as it involves the cutting down of trees and tilling of soils [77]. A small portion of the agricultural land (4%) is found within the high to very high susceptibility class [140].
Several small but destructive landslides have hit the western part of Cameroon along the Cameroon Volcanic Line in the past three decades. With increase in urbanization and construction of houses on steep slopes without engineering considerations landslides in the West Region of Cameroon are inevitable. This is exacerbated by changing climatic conditions leading to increase in rainfall regime. This study therefore aimed at undertaking a landslide susceptibility assessment to aid local and national authorities in land use and policy planning to minimize the destructive effects of landslides. Eleven landslide conditioning factors were selected to investigate slope stability in the study area. Steep slopes, high elevations, weathered volcanic rocks and thick soil cover along steep slopes are identified as the major landslide causative factors. High intensity rainfall (110 mm/day) for over a period of 2-4 days is the main landslide triggering factor in the area. The landslide susceptibility map generated from the multicriteria decision analysis was subdivided into five classes; very low, low, moderate, high and very high susceptibility class. Roads and residential houses built along steep slopes are the most vulnerable infrastructures to slides. Agricultural land is less vulnerable to sliding as over 50% is found within the moderate susceptibility class. To curb the effect of landslides, some mitigation mechanism such as; tree planting, slope terracing, draining pipes, construction of retaining walls is proposed. In order to implement appropriate mitigation measures, it is recommended that site specific assessments be conducted to identify triggering factors in high to very susceptibility zones.
Raphel Etoyiva Abine is a Commonwealth Scholar funded by the UK government. Harold Lovell is gratefully acknowledged for critiquing and improving the manuscript.
The author declares no conflict of interest.
This work is an output from the author’s MSc dissertation. It was conceived and produced by the author.
Code availability ‘Not applicable’
No funding was received to assist with the preparation of this manuscript.
Citation: Abine RE (2023) GIS and Remote Sensing Assessment of Landslide Susceptibility along the Cameroon Volcanic Line: West Region, Cameroon. J Geogr Nat Disasters. 13: 269
Received: 17-Mar-2023, Manuscript No. JGND-23-22250; Editor assigned: 20-Mar-2023, Pre QC No. JGND-23-22250 (PQ); Reviewed: 04-Apr-2023, QC No. JGND-23-22250; Revised: 11-Apr-2023, Manuscript No. JGND-23-22250 (R); Published: 18-Apr-2023 , DOI: 10.35841/2167-0587.23.13.269
Copyright: © 2023 Abine RE. This is an open-access article distributed under the terms of the Creative Commons Attribution License, which permits unrestricted use, distribution, and reproduction in any medium, provided the original author and source are credited.