Journal of Stock & Forex Trading
Open Access
ISSN: 2168-9458
ISSN: 2168-9458
Research Article - (2024)Volume 11, Issue 3
The main context of the study is to analyze financial markets indices response to novel Coronavirus (COVID-19). In general, international stock markets are overlooking financial crises due to the COVID-19 epidemic outbreak. This review focus on a statistical survey to know what index has gain/loss to what degree. Critical analysis findings are benchmark index like the S and P 500 and Dow Jones Industrial average (DJI) has plummeted. Other indices like FTSE 100, NIKKEI 225, NASDAQ 100, SSE 50, DAX, HENG SENG, MOEX.ME and SENSEX have shown a negative % change. Global stock markets posted the biggest fall since 2008 financial crises.
Financial markets; COVID-19; Stock markets; Benchmark index; Financial crises
Like SARS (Severe Acute Respiratory Syndrome) in 2003, a newly virus named “2019-nCoV” (novel Coronavirus) has identified first time in Wuhan, a city of China in December 2019. Later on, novel Coronavirus (2019-nCoV) referred as new name “coronavirus disease 2019” by World Health Organization (WHO) while Coronavirus Study Group (CSG) of international committee proposed “SARS-CoV-2” as name to novel coronavirus [1]. The coronavirus disease causes respiratory illness with symptoms flu, cough and fever, in more severe condition difficulty in breathing end with fatal. The hazardous side of this COVID-19, it is spread very vastly from human to human by via droplets inhalation and physical contact. According to WHO (World Health Organization) report at the end of January china has 9720 confirmed cases of COVID-19 with 213 deaths, outside the china 106 confirmed cases in 19 countries spread by travel to and from Wuhan. So with this dispersion rate WHO declared global health emergency in the mid of January (World Health Organization, 2020) [2,3].
World Health organization (WHO) shared some statistics about COVID-19 epidemic outbreak at the end of first quarter of 2020. The origin country of epidemic china has 82,545 confirmed cases with 3,314 deaths. Infectious disease blowout very fast in European region Italy contained 1, 01,739 confirmed cases and 11,591 deaths, Germany has 61,913 confirmed cases and 583 deaths occurred while France with 43,977, Japan with 1953 and Spain occupied 85,195 confirmed cases. COVID-19 has infected 22,145 people in the state of (UK) United Kingdom. USA has lead in this epidemic outbreak with 1, 40,640 definite patients and 2,398 deaths. All over the world challenging by COVID-19 epidemic outbreak with 7,50,890 confirmed patients and 36,405 deaths (World Health Organization, 2020) [4].
The dispersion of coronavirus much more than SARS and MERS even infected cases of SARS in a month are less than coronavirus infected cases within a week. According to current situation fatality rate of coronavirus about 2.2% less than SARS about 10%, while MERS had around 35% fatality rate.
Financial markets panic
The increasing in economic activities regionalization and financial markets liberalization from since 1980’s caused integration among world economies. Recently due to infectious disease COVID-19 worldwide capital markets are unstable. The epidemic outbreak covered 208 countries till date updated due to which a complete locked down in around the world. The interruption in economic activities like production, supply chain value, spending by household and services facilities caused the economic supply and demand shocks [5].
The U.S security and exchange commission terminated stock exchanges trading for 15 minutes four times just in a month of March to bring out the market from panic trading. Before this in 1987 and 1997 stock trading had halted due to market crashed. When S and P 500 has dripped more than 7% from previous close, the trading stopped during the opening hour on March 9, 12, 16 and in the mid of day on 18th March. The trading of Dow and NASDAQ has shut down in the response of S&P 500 pause. As the Dow and S&P 500 prices have plunged the volatility of Chicago Board of Exchange has increased [6].
FTSE 100 had been gaining since 2011, presently just within a month index has plunged to its lowest level. To avoid the severity of damages governments and central banks restricted the economic activity, investor anxiety affect the Wall Street impel it into fast bear-market. Dow Jones Industrial Average companies shares prices fell by more than 20% from its latest peak. Dow jones has plummeted by 12.9%, index worn-out by almost 3000 points on 16, March referred to worst day. World second largest economy was fighting against COVID-19 in late of January, china global supply chain disrupted when the central city Wuhan locked down. Asian powerful economy suffers by fall in GDP since 1976. By the fall in shares prices world richest people have lost $1tn. Italian debt suffered its biggest selloff since 2011. The U.S and German bond market has also suffered 10-year bonds yields fell by 20 points in the first week of March. Almost 7000 stock in global equities have lost $6trillion of their market value in start of March. One third of German market, half of Japanese, nearly 80% of South Korean shares and emerging market have move in bear-market (Wilkes, World Economic Forum, 2020) [7].
Like 2008 recession where stock markets had crashed and interest rate reduction strategies implemented, once again global financial crises has been seeing in 2020 due to COVID-19. US Federal Reserve and bank of Canada has reduced interest rate from 1.75% to 1.25%, bank of England reduced from 0.75% to 0.25% within first two weeks of March. The managing director of IMF, Kristalina Georgieva, declared global growth will be drip in 2020 below the preceding year due to COVID-19. Low income and emerging economies will get $50 billion by IMF to tackle financial emergency. According to estimation one-third of economic losses will be suffer as direct cost while two-third will be indirect by the harsh circumstances for business and financial markets [8]. As the spread of COVID-19 in china, it has restricted activities like traveling, transportation, labor mobility and working hours in February therefore output decline. Global financial uncertainty caused the assumption about global GDP growth will be low might be below zero in first quarter of 2020. It might be possible global growth declined ½ percentage in this year based on 2019. Countries like Japan, Korea and Australia interrelated with china though their economic activities like production, imports, exports and supply chain also suffering from infectious disease (Organisation for Economic Co-operation and Development, 2020). The Chinese exports reduced by 2% on annual based due to manufacturing Production Manager’s Index (PMI) dropped by 22 points in the February. According to today statistics Chinese manufacturing intermediates inputs trade covered 20% of global trade. COVID-19 has disruption in Chinese manufacturing inputs are crucial to global value chain. The interruption in china supply chain has affected many companies production around the world (United Nations Confrence on trade and development, 2020).The financial markets have undergone restrictions due to coronavirus outbreak, euro stoxx 50 plummeting 8.3% to its lowest level. Australia manage A$17.6 billion against coronavirus dispersion to avoid sever conditions in recession [9].
Financial markets and a number of industries have revealed severe adverse conditions in the response to COVID-19. Euro stoxx 50 has dropped by 50% while S and P 500 reduced by 18% from its peak in the mid-February, this decrease in index points critical than SARS. European countries and U.S has locked down to prevent the virus spreads therefore GDP growth and output plummeted. Tourism in Italy has fall 40% to 80% while in France 30% to 40% due to epidemic situation.
Statistics and interpretation
To take a close look at market, indices monthly prices of first quarter of this year (2020) collected and lineup in Table 1. To analyze gain/loss percentage change measure adopted for per month or quarter. Figure out the situation of markets by critical examination of indices in Table 1 [10].
| Indicies | 2019 | Jan | Feb | Mar | Q1 | ||||
|---|---|---|---|---|---|---|---|---|---|
| price | price | % change | price | % change | price | % change | price | % change | |
| DJI | 28,538.44 | 28,256.03 | -0.99 | 25,409.36 | -10.07 | 21,917.16 | -13.74 | 21,917.16 | -23.2 |
| GSPC | 3,230.78 | 3,225.52 | -0.16 | 2,954.22 | -8.41 | 2,584.59 | -12.51 | 2,584.59 | -20 |
| NDX | 8,733.07 | 8,991.51 | 2.96 | 8,461.83 | -5.89 | 7,813.50 | -7,66 | 7,813.50 | -10.53 |
| NIKKEI225 | 23,656.62 | 23,205.18 | -1.91 | 21,142.96 | -8.89 | 18,917.01 | -10.53 | 18,917.01 | -20.04 |
| FTSE100 | 7,542.40 | 7,286.00 | -3.4 | 6,580.60 | -9.68 | 5,671.96 | -13.81 | 5,671.96 | -24.8 |
| DAX | 28.1 | 27.1 | -3.57 | 24.95 | -7.93 | 20.59 | -17.47 | 20.59 | -26.73 |
| SSE50 | 3,063.22 | 2,932.49 | -4.27 | 2,821.04 | -3.8 | 2,689.38 | -4.67 | 2,689.38 | -12.2 |
| HENGSENG | 28,189.75 | 26,312.63 | -6.66 | 26,129.93 | -0.69 | 23,603.48 | -9.67 | 23,603.48 | -16.27 |
| MOEX.ME | 107.75 | 109.94 | 2.03 | 99.08 | -9.88 | 97.25 | -1.85 | 97.25 | -9.74 |
| SENSEX | 41,253.74 | 40,723.49 | -1.29 | 38,297.29 | -5.96 | 29,468.49 | -23.05 | 29,468.49 | -28.57 |
Table1: Indices prices and % change of first quarter, 2020.
There are three major indices; DJI (Dow Jones Industrial average), GSPC (Standard and Poor’s 500) and NDX (NASDAQ 100) in the United States mutually exertion as security market indicator series. Empirical data in table 1 disclosed a continuous down fall from Jan, 2020 to Mar, 2020 with increasing trend in benchmark index S and P 500 and DJI. At the end of first quarter of this year, DJI has dropped 6,621.28 points with -23.20% changes while S and P 500 move from 3,225.52 points to 2,584.59 with 20% decrease. In the first month of year NDX has gain 2.96% after that index plunged by 10.53% due to COVID-19. The drip in NIKKEI 225 by -1.91% in January indicates the impact of epidemic outbreak started in china. After dispersion of virus outside the china NIKKEI 225 proceed with decrease 8.89% in Feb and 10.53% in March. In general FTSE 100 is a leading indicator of United Kingdom (UK) financial markets. FTSE 100 is most popular and widely use market index in Europe. This year starts with 7,286 points of FTSE 100 but at the 31st March 5,671.96 points exposed index has collapsed 24.80%. DAX is the main stock index in Germany, index price fell from 28.10 to 20.59 in the Q1 (Quarter 1). SSE 50 related to Shanghai stock exchange, China was in lead of epidemic outbreak in the first two month so that’s why in the end of third month SSE 50 shown overall 12.20%negative change. Aggregate fall in Q1 by HENGSENG is 16.27% directs Hong Kong stock market also fronting crises. Russian stock market index MOEX.ME displayed gain in January then negative % change point out loses. Above table mentioned there is major drop 8,828.80 points just in March with -23.05% change in SENSEX trading in Bombay stock market [11].
The decreasing pattern in prices declared, there is stock market crises in all over the world. The negative % change in Q1 column specifies all the indices have collapsed. This is great recession time period since 2008 crises, global countries adopting some precautionary measure like; trading halt, decrease in interest rates, ease in collateral policies and relaxation in credit policies, government central banks funding to control and limit global crises.
Statistics visualization
Data visualization make easier to understand, to detect pattern and trend of data. Here’s below every index represent in chart to quick understanding about market direction. Two lines plotted in chart one is closing price while other one signify simple moving average. Moving average is a simple technical tool analysis to watch market trend or direction. It helps smooth out price action by filtering out the “noise” from price fluctuations. As per analysis moving averages of all indices have downward trend in March. Down fall trend in moving averages even prices are below the averages it signal for short trader to sell stock at the point where prices crossover. But it is best opportunity for long term traders to buy stock at the point where prices maximum below the averages. NASDAQ 100 shown little bit uptrend in the mid of February then get again downtrend. SSE 50 moving average indicates slightly down fall trend as compared with DJI, S and P500 and NASDAQ (Figures 1-10) [12,13].
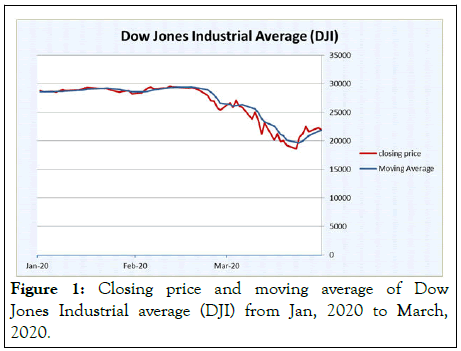
Figure 1: Closing price and moving average of Dow Jones Industrial average (DJI) from Jan, 2020 to March, 2020.
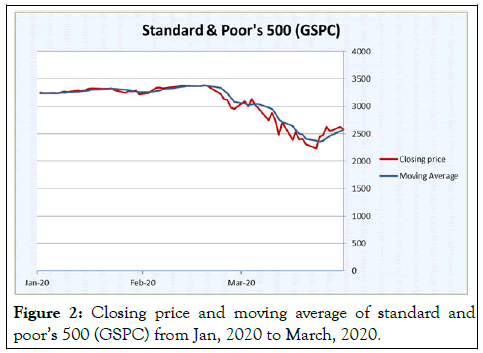
Figure 2: Closing price and moving average of standard and poor’s 500 (GSPC) from Jan, 2020 to March, 2020.
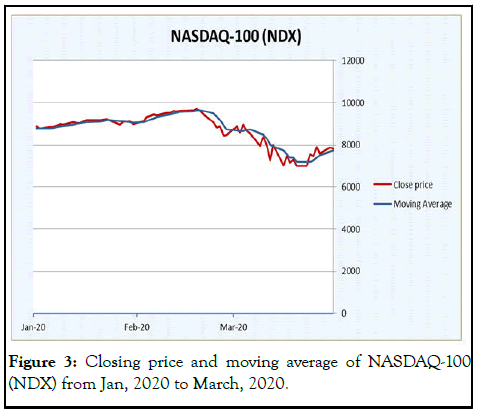
Figure 3: Closing price and moving average of NASDAQ-100 (NDX) from Jan, 2020 to March, 2020.
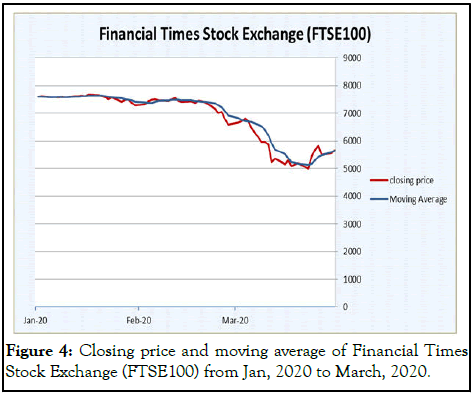
Figure 4: Closing price and moving average of Financial Times Stock Exchange (FTSE100) from Jan, 2020 to March, 2020.
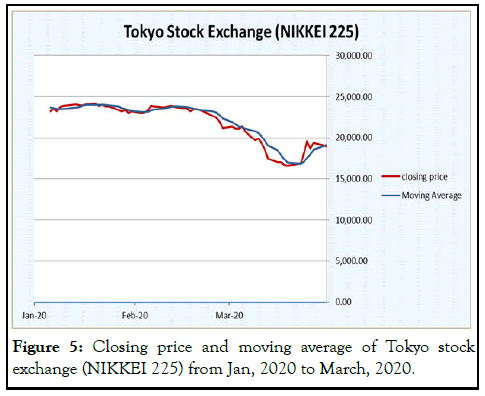
Figure 5: Closing price and moving average of Tokyo stock exchange (NIKKEI 225) from Jan, 2020 to March, 2020.
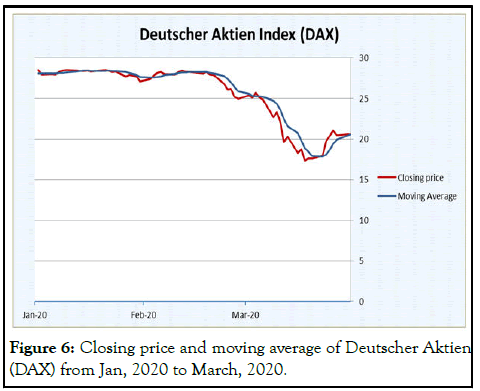
Figure 6: Closing price and moving average of Deutscher Aktien (DAX) from Jan, 2020 to March, 2020.
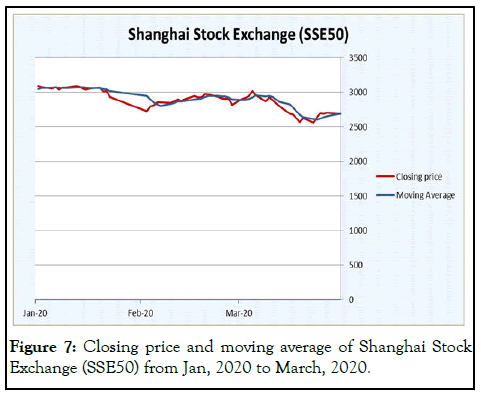
Figure 7: Closing price and moving average of Shanghai Stock Exchange (SSE50) from Jan, 2020 to March, 2020.
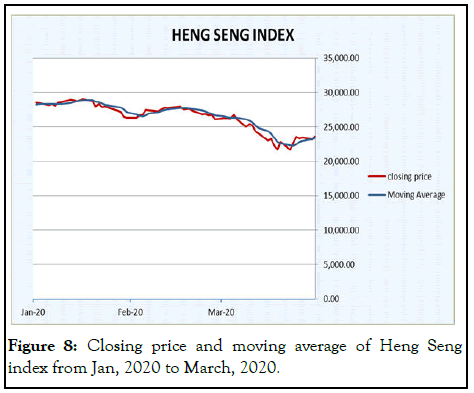
Figure 8: Closing price and moving average of Heng Seng index from Jan, 2020 to March, 2020.
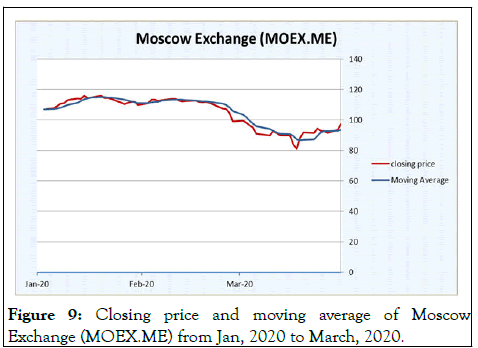
Figure 9: Closing price and moving average of Moscow Exchange (MOEX.ME) from Jan, 2020 to March, 2020.
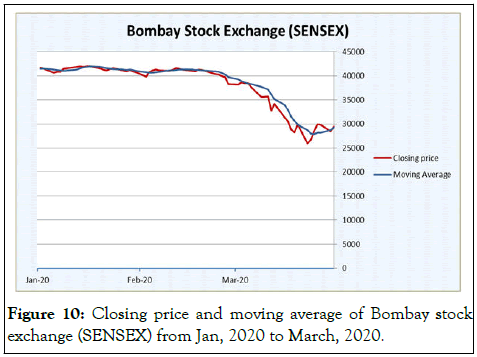
Figure 10: Closing price and moving average of Bombay stock exchange (SENSEX) from Jan, 2020 to March, 2020.
Germany financial market also feels panic, DAX blue-chip stock index dropped by 8% (updated till 10th March) its worst day since from 9/11 attack. Germany industrial state, North Rhine- Westphalia has 1200 confirmed cases of infectious disease which contributed 20% to country’s productivity. To tackle financial panic government facilitates in company financing, credit collateral and tax relief. This is the worst quarter for Asia-Pacific stock markets since 2008. Japan Nikkei index has plunged by 20%, Australian S and P/ASX dripped by 24% while Indian SENSEX index points fell 28%.
[Crossref] [Google Scholar] [PubMed]
[Crossref] [Google Scholar] [PubMed]
[Crossref] [Google Scholar] [PubMed]
[Crossref] [Google Scholar] [PubMed]
[Crossref] [Google Scholar] [PubMed]
[Crossref] [Google Scholar] [PubMed]
[Crossref] [Google Scholar] [PubMed]
[Crossref] [Google Scholar] [PubMed]
[Crossref] [Google Scholar] [PubMed]
Citation: Sattar MA, Sattar MF (2024) How the World Indices Responding to Novel Coronavirus (COVID-19). J Stock Forex. 11:265.
Received: 19-Jun-2020, Manuscript No. JSFT-24-5023; Editor assigned: 24-Jun-2020, Pre QC No. JSFT-24-5023 (PQ); Reviewed: 08-Jul-2020, QC No. JSFT-24-5023; Revised: 15-Aug-2024, Manuscript No. JSFT-24-5023 (R); Published: 12-Sep-2024 , DOI: 10.35248/2168-9458.24.11.268
Copyright: © 2024 Sattar MA, et al. This is an open-access article distributed under the terms of the Creative Commons Attribution License, which permits unrestricted use, distribution, and reproduction in any medium, provided the original author and source are credited.