
Journal of Clinical Trials
Open Access
ISSN: 2167-0870

ISSN: 2167-0870
Research Article - (2023)Volume 13, Issue 2
Glioblastoma Multiforme (GBM) is a Grade IV malignant primary tumor present in the central nervous system. Despite advancements in treatments, it has a poor prognosis as the median survival is 14 months-15 months. The goal of this study was to identify the candidate biomarkers as well as the functional pathways regulated in GBM. The dataset (GSE100675) accessed included 3 glioblastoma tissues, 3 paired tissues, and 3 normal tissues. The Differentially Expressed Genes (DEGs) were identified using GEO2R, which found a total of 1,609 DEGs (916 downregulated and 693 upregulated). A gene ontology and KEGG pathway analysis was done with the DEGs. The KEGG pathway analysis was then utilized in constructing a Protein Protein Interaction (PPI) network, identifying the genes of interest. The interaction network was then put into cytoscape and 10 hub genes were identified. To ensure reliability of the research, those hub genes were put in GEPIA, and the data was compared for consistency of the research, with the regulation of all 10 hub genes matching that of a larger dataset. Kaplan-Meier analysis was done on the hub genes, which demonstrated that an upregulation in Signal Transducer and Activator of Transcription 3 (STAT3) was associated with lower survival. Study shows that STAT3 gene may be a key factor in the progression of GBM, being crucial in cell proliferation. In conclusion, STAT3, along with the molecular pathways identified, may be used as a potential prognostic and diagnostic biomarker and can be used to further our understanding of GBM.
Glioblastoma multiforme; Biomarker; Pathway; STAT3; Bioinformatics
Glioblastoma Multiforme (GBM) is a grade IV malignant primary tumor present in the central nervous system. It affects glial cells in the central nervous system and may originate anywhere in the brain or the spine; however, it does not spread to other organs or parts of the body. Most people live for 15 months after being affected, but 90% of people die at 24 months [1]. GBM has an incidence rate of 3.21 per 100,000 people globally; however, despite being rare, it is the most common glioma in all age groups and has a poor prognosis as the median survival is 14 months-15 months after being diagnosed, making it a significant health issue. The low prognosis is due to the high molecular heterogeneity and high invasiveness. CT scan, MRI scan, or a brain PET scan, MR spectroscopy and a tissue biopsy are often used to diagnose a patient with GBM. Treatment options include chemotherapy, radiation therapy, targeted therapy, and surgery [2]. However even with large advances in treatments, it is still incurable.
Despite extensive studies done in GBM, it still remains to be poorly understood. Multiple factors cause the tumor, including mutations. In order to form a deeper understanding of GBM, it is crucial that its molecular mechanisms be further analyzed to open more treatment options as well as provide patients with better care. Additionally, finding molecular biomarkers along with a potential diagnosis would allow for more personalized treatment and improved prognosis.
Microarrays were utilized in the screening of Differentially Expressed Genes (DEGs), allowing for the identification of genes that are closely related to the occurrence of the tumor. However, due to the tissue heterogeneity, determining specific molecular mechanisms of the tumor is a challenge.
In this research, potential prognostic and therapeutic biomarkers were discovered using public databases. Identifying prognostic biomarkers would be advantageous as it would allow determining who is at a higher risk of getting the tumor and identify the life threatening tumor early on, allowing treating GBM earlier and increasing survival rates [3]. The goal of this study was to identify candidate biomarkers that can be used in the identification and treatment of glioblastoma multiforme. Additionally, the goal was to identify the functional pathways regulated in glioblastoma multiforme.
This study analyzed one microarray dataset consisting of 3 glioblastoma tissue and 3 normal, healthy tissue. DEGs were filtered using GEO2R, which were then analyzed using the Database for Annotation, Visualization and Integrated Discovery (DAVID) functional annotation tool to access the gene ontology and the KEGG pathway analysis [4]. Search Tool for the Retrieval of Interacting Genes/Proteins (STRING) was used to construct a Protein Protein Interaction (PPI) network, and Cytoscape allowed for further analysis of the network and identified the hub genes. Gene Expression Profiling Interactive Analysis (GEPIA) was utilized to validate the research findings. PROGgeneV2 allowed for survival analysis and prognostic data to be analyzed and further interpreted.
GBM tissue and normal tissue were accessed using the accession code GSE100675 on Gene Expression Omnibus (GEO) database, allowing access to database using next-generation sequencing along with microarray datasets. The gene expressions were further evaluated using GEO2R. DEGs were determined by comparing gene expression in GBM and normal tissue. In order to determine what genes were upregulated, the fold change value was to be greater than 1. If it was less than -1, it was to be downregulated. This was done to shorten the list of genes to analyze further. DEGs were identified by using a p<0.05 on the short listed genes.
The DAVID functional annotation tool was used to do the KEGG pathway analysis and access the gene ontology of the dataset with a p<0.05. The gene ontology categorizes the DEGs into three functional groups which are cellular component, molecular function, and biological processes.
To construct a PPI network, the STRING database was utilized by using the proteins the DEGs coded for. The network was then put into cytoscape, which was utilized in analyzing the interactions between the candidate proteins the DEGs transcribed for. Cytoscape also identified the degree of connectivity for each node along with the total number of connections that were in the PPI and the total number of nodes [5].
GEPIA database was used in the validation of the research and confirming its reliability. The database accessed data from The Cancer Genome Atlas (TCGA) and showed the expression of a gene in a cancer in relation to a healthy individual. Validation was done by comparing the regulation of genes collected from the dataset accessed in this study to that of a larger dataset from TCGA.
PROGgeneV2, a prognostic database, allowed for analysis of the prognosis and survival of a patient in relation to the hub genes. Data derived from TCGA was used to indicate survival rate. Kaplan-Meier analysis was done on the hub genes. Patients that had GBM were classified into either having a higher expression or a lower expression of the gene. The survival of each patient was then plotted on a graph, allowing a visual representation of survivability of the patient in relation to expression of the gene. A p<0.05 was used to determine which plotted dataset has a difference considered statistically significant [6].
Identification of DEGs
Dataset was accessed from gene expression omnibus (GSE100675). It consists of 9 samples: 3 of glioblastoma tissues, 3 normal tissues, and 3 paired tissues.
Differentially expressed genes in the dataset were identified using microarray analysis. When glioblastoma tissue was compared with normal tissue, it was found that there were 693 significantly upregulated genes and 916 significantly downregulated genes, a total of 1,609 DEGs (Figure 1 and Table 1).
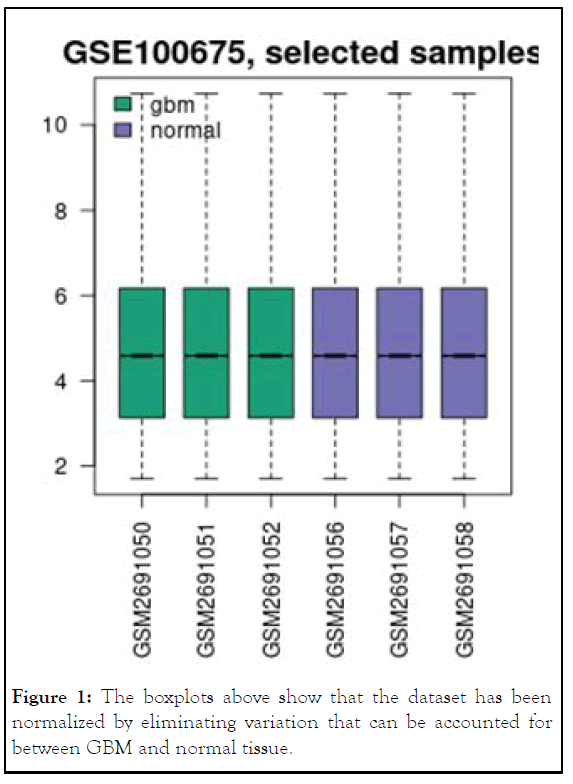
Figure 1: The boxplots above show that the dataset has been normalized by eliminating variation that can be accounted for between GBM and normal tissue.
| DEGs | Gene names |
|---|---|
| Upregulated | ESM1 EMP1 CHI3L1 HIST1H3F PTBP1 SP110 S1PR3 PFN1 HIF1A ZFP36L2 BAZ1A CLEC2B PARP9 CDK4 ARHGAP15 CDK2 HIST1H2AM NEDD1 WEE1 IQGAP1 SEC61A1 ARHGDIB SLC31A1 DTX3L ADAM9 IFI16 LPL PNP ELTD1 TMEM179B FAM60A SEPN1 PTPRC LAMC1 GPR65 PDIA3 PRRX1 PROS1 EDNRA MSN HLA-DPB1 HLA-H COL8A1 BTG2 MMP14 MMP2 ID3 TNFRSF19 LYN GANAB RAB13 GRN ANXA2 ETS1 MBOAT1 ZC3HAV1 CD37 MYD88 CD14 HLA-G SNAP23 ODC1 FCGR3A HIST2H2AA4 PARP14 ZBTB20 PYGL SERPINA3 CALR FAM111A FN1 EDEM2 CXCL10 IDH1 MMP9 STT3A CD93 PSME2 MSR1 YBX3 MLEC PPIB EIF4A1 SPPL2A SAMHD1 MKI67 EIF4A1P2 PRCP TMX1 MAML2 ANXA2P2 LAPTM5 RELA SPARC STK32A NOP10 RP2 IFI30 ITPR2 MAP7D3 NMI ANGPT2 TRIM25 FKBP7 TNPO1 ATRAID TGFB1 CYBB COTL1 KDELC2 MGP CMTM6 RNASE2 TYROBP C1QC AIF1 ENG P4HB MS4A7 CDCA7L CCDC80 CD58 HIST1H3B HLA-B ETV6 EVI2B LAMB2 AASS TXNDC5 HIST1H2AG MAN2B1 DOCK11 FGL2 STAT3 NCKAP1L SPP1 HIST1H1B CTSS PIK3CG PLBD1 NUP205 CDK6 GNL2 LINC00152 VSIG4 CD4 RPLP0 FPR1 CD63 XRN2 GAS2L3 HIST2H2AA4 HLA-DPA1 KNTC1 ADAP2 RBL1 LAP3 OS9 RPN2 E2F7 IRAK4 ITGB1 SNORD69 PPP1R14BP3 BT3P10 PSME1 C1orf162 DUSP6 MPEG1 TGFBR1 MYO1E TLR1 HIST1H2BK KDELR2 LIMD1 DESI2 PRDM1 TGFB1I1 BTK MAPKAPK2 HEATR1 APBB1IP SNORD78 MYL12A TRAM2 SAMD9 HIST1H3J ATP7A FYB DCBLD2 PLP2 FCER1G FLVCR2 TOP2A USP3 SP1 TLN1 HLA-DOA ADAM17 OR56B1 TGFBR2 OLFML2B MS4A6A SCAF11 HERC5 TP53 MIR21 IGFBP7 LOC541471 LITAF BGN PECAM1 NAGA BIN2 RNF213 RIT1 PLVAP HIST1H3D VCAN-AS1 MOB1A CD68 DOCK2 SEMA5A CLIC1 IFITM2 NFE2L3 LAPTM4A DHX40 CKS2 GBP5 EMP3 HIST1H4L TNFSF13B HLA-E PARP4 FSTL1 IGSF6 CD226 ANXA5 ITGA4 CHD1 DRAM2 MS4A4A CCL4 PRRC1 PRKD3 GMFG SNORD27 MVP N4BP2 SNORD10 TIMP1 DOCK8 PGM2 RNFT1 CD53 EMB NPL C1QB NUP107 STAT1 FCGR2A CFI NUP160 ITGA2 HLA-DMB FCGR2C HIST1H2AI CXCL16 HAVCR2 TAGLN2 FPR3 EML4 DDX21 TRAM1 YBX1 HSPA5 LIMA1 FCGR3B CXCL9 MCL1 RECQL DCAF13 TRIAP1 ZNF217 PDPN SCIMP MAGT1 LY86 SULF2 PRDX4 TNFRSF1A ADAM12 FAM129A GBP2 SNORD82 SLC16A4 FKBP15 IQGAP2 FCGR1A CTSC ITGA1 STX11 RBMS1 IFITM3 UCP2 OLR1 LOC100129034 A2M IGF2R CTSK MYO9B VCL PHLDA1 TLR8 GALNT1 VCAN VIM TAP1 GALNT2 LOC100506474 GBP3 RRM2 ANXA1 LYZ PDIA4 IL17RA COL4A1 MTMR11 LXN FCGR1B ESCO2 IL13RA1 HLA-DRA SOAT1 HIST2H3D MIR612 HIST1H3H SRPX2 EMR2 GBP1 GLA ATP6V0E1 SERPINB1 CTSA MYOF HIST1H2BO SMC4 ABCA1 POFUT1 HIST1H2AC ITGAV TMEM255A FCGR1C STK17A HLA-DMA GLIPR1 SIGLEC9 MDM2 HIST1H2BM NUSAP1 GNS HLA-C SRPX TXNIP CD248 APOL6 CD86 NID1 SMC5 MAP3K1 EZH2 UTP20 IBSP ZFP36L1 HIST1H2BF LMAN1 FCGBP EDA2R INSM1 FKBP14 OSMR LGMN MRC2 APOC1 LMNB1 TREM2 ANXA2P1 ZAK IFIH1 KDELR1 COL4A2 STC1 CDH11 TLR3 ATP10D NRAS SNORA53 MIR4521 HIST1H2BJ COLGALT1 SLC40A1 GNG5P2 FLNA CALD1 LAMB1 MT2A NECAP2 HIST1H1C MTHFD2 ADAMTS9 SERPINB8 SNORD14B HIST1H3C TFPI HCLS1 BCAT1 SERPINA1 RPS19 SNORD4B DERL2 ATL3 PLSCR1 LPCAT3 C19orf38 CASP1 FAM111B TNC TMEM194A ZFP36 CDK1 PCNA IFITM4P IFI44 ITGB3 MIDN CD151 TRIM38 NES RAP1B CD74 FKBP9 SLC43A3 CD84 CPVL ARHGAP42 ELK3 CD44 PAG1 H3F3A CALU JAG1 KIF20A HPGDS SULF1 BUB1 PLOD1 SCPEP1 AIM1 FTL FBN1 ELF1 GNG5 S100A11 HIST1H3E GAPT PXDN SRGN CLIC4 AAED1 LIMS1 UGDH ANO6 LGALS3BP |
| Downregulated | UNC13C CACNG2 HS6ST3 SV2B HCN1 CAMK1G PHYHIP SULT4A1 SLC12A5 RGS4 MYT1L TESPA1 SLC1A2 RIMS2 WASF3 NAPB SLC6A17 CELF4 SLC39A12 NCDN SYT4 RBFOX1 CACNA2D3 SPTBN2 GRIN2A GABRG2 ELAVL2 SYN1 KCNC2 GOT1 ATP1A3 NEFL NSMF KIAA0513 JPH3 RGS7 PPP2R2C CDS1 CLVS2 GABRA1 RAB3A MAPK10 GNG3 CKMT1A CHD5 ATP2B3 CALM3 SYN2 SHANK3 DNM1 VSTM2A FBXW7 MAP7D2 SLC17A7 GRIN1 IDS PTPN5 TMEM130 HLF NEFM FBXL16 PACSIN1 SNAP25 CA11 KIAA1045 CKMT1B SYT5 JAKMIP1 OPALIN CACNG3 KCNH3 RFPL1S UBE2QL1 SYP CTNNA2 NMNAT2 UNC79 CAMKK2 SLC17A6 SH3GL2 RBFOX3 AGAP2 TRHDE SVOP DLG4 RAB6B GAD2 RUNDC3A FRMPD4 SYT1 STX1B GABRB2 HSPA12A IGIP SLC4A10 NRXN3 MAST3 CNTNAP1 CABLES1 PAK1 SNCA CHGB ST8SIA3 RYR2 VSNL1 BRSK1 MOAP1 EEF1A2 ARRB1 ARHGAP44 ATXN7L3 KIF5A ARHGAP32 INA STMN2 PSD IQSEC3 GRIA2 CEND1 NCS1 SCN2B DUSP8 GFOD1 GRM5 SHANK1 GRAMD1B SLC8A2 ZNF483 GAD1 BTBD10 GABRA4 GP1BB FAM73A THRA STXBP6 LGI1 RIMS1 STXBP5L DDN CREG2 BSN ETNPPL AGXT2L1 PCSK2 HPCAL4 LOC100128264 CAMK2A MAST1 KCNN1 KIAA1549L DGKZ RIMS3 KRT222 OLFM3 TSPYL1 CLDN10 CAMTA2 DLGAP2 CAMK2N1 PDE1B KIAA1107 NDRG3 NDRG4 RAB11FIP4 FAM163B ATP6V1G2 MAP3K10 SCN3B STXBP1 CAMK2G VAMP2 CPEB3 GABRG1 KCNB1 UNC13A ADCY1 C9orf172 NEURL GPRASP1 MAP1A FAM81A TMEM150C RAP1GAP2 PCDH9 SLC25A4 RANBP3L FRMPD2P1 LONRF2 CDK5R1 PITPNM3 MGAT5B LINC00507 PPP3R1 KIAA0319 HABP4 KBTBD11 SNORD115-2 GUCY1B3 STX1A CASKIN1 PRKCB NELL1 MAP2K4 CRYM MAP6 CPLX2 MAPK8IP3 SLC6A15 EPB41L1 TAGLN3 SLCO1C1 CACNA1B GARNL3 SNORD115-35 KGFLP2 GABARAPL1 PDE2A CDH18 PDP1 LRRC7 LOC440894 TCEAL7 L1CAM CEP170B AJAP1 TPPP CACNB1 SH3GL3 FEZF2 GABRA2 MAL2 HOOK1 NAPG AP3B2 WDR47 ACTL6B JPH4 CDK5R2 LMO3 SRRM4 RALYL ENC1 PSD2 GLUD1 PRKCE AMPH CAMK1D PPM1K KCNB2 LINC00087 KCNAB1 DLGAP3 OLFM1 CIT KCNV1 PDE8B ATP2B2 SCN2A CELF3 SYT7 EMX2 RAB11FIP2 CACNB3 KCNH1 RB1CC1 TMEM132D KIF3C DCLK1 PRMT8 GPR22 STOX1 THRB BCL11A RAPGEF4 IQSEC2 DOC2A DLGAP1 CAMKK1 CLSTN3 PDZD4 MLIP MCF2L2 GLRB HMP19 EMX2OS CAMK4 NRGN SLITRK4 MYRIP PTPRT GAS7 DOC2B PRNP AKT3 HIVEP2 ENTPD3 UNC80 RIMBP2 SCN8A KCNJ9 KIAA1644 ATP6V0A1 SPRYD3 RAPGEFL1 PPP4R4 DBC1 DLG3 NRG3 NELL2 SNORD115-30 AKAP11 ST6GALNAC5 TBR1 PDZD2 GDAP1 HS3ST4 ADCY5 PCLO RTN1 UNC5D CNTNAP2 KALRN CDH9 FNDC9 CACNB2 NSF TMEM59L ADD3 C1QL3 PPP1R9B TUBG2 PTPRN2 BEX5 MUM1L1 SNORD115-3 GNAL KIF3A ABR CYP4X1 IQSEC1 ACO2 PAK3 PI4KAP1 WDR17 PIP4K2B SEPT3 NDST3 IPCEF1 EPHB6 SNORD115-27 NEUROD6 MAPK9 OR14I1 LRFN5 C11orf87 SCAMP5 RNF144A-AS1 SNORD115-24 RAB3C MICU3 CAP2 MYCBP2 FAM153A GABRB3 ANK2 KHDRBS2 GABRD DRD1 CHN1 TOM1L2 TPRG1L CHD3 EPHX4 SLC25A27 EPHA4 PPFIA2 SLC25A18 CYP46A1 NRIP3 FLRT2 CHRNB2 NEGR1 NTRK2 NPTN GDA GHITM MFSD4 STXBP5 ALDOC SNORD115-17 SNORD115-19 HECW1 POU4F1-AS1 FAM153B SNORD114-26 NGEF SNORD115-4 RASGRF2 BC146931 HTR5A ATP8A2 CNKSR2 OMD PPP1R16B MKL2 KCNH7 NRSN1 PGBD5 MYO5A NSFP1 RUNDC3B DYNC1I1 PAFAH1B1 NRXN1 NLK NBEA TRPC5 SLC39A10 SYNJ1 GABRA5 PRKACB WDR7 FXYD1 KCNIP4 GRIN2B HOMER1 KCNQ3 SGSM2 TSPYL5 PAK7 KCNMA1 HMGCLL1 SGIP1 DKK3 GRM1 C2orf80 FAIM2 SNORD113-4 SYT16 TMEM63C SCG5 BSCL2 PEG3 ZIM2 VIP RND1 KCNIP2 RELN NSF PI4KAP2 CACNB4 TRIM2 NYAP2 NET1 KCNA4 CNTNAP5 NPTX1 TMEM14A AK5 ADD2 NEBL CDKL5 PREPL CELF5 SST SNAP91 BTRC REPS2 LINC00641 SAMD12 NAP1L2 KCTD16 MCHR2 SNORD115-8 TTC7B DLG2 ATRNL1 TSPYL2 LMTK2 SNORD115-37 ACTR3B FRRS1L NEUROD2 APC SNORD113-6 NECAB1 SLITRK1 DGKB ATL1 GLRA3 SYNGAP1 KLHL2 FGF12 SNORD115-31 CACNA1A CNIH2 KIF1A NDFIP2 LMO7 PPP1R1A ACVR1C WBSCR17 GPR83 TLN2 ERC2 ZBTB18 TTLL7 NUAK1 PPP3CA FSTL5 TTBK2 TTC9B PNMAL1 LINC00622 TENM2 PHACTR1 ALDH2 STOX2 RASGRF1 RTN4RL1 SIDT1 AGTPBP1 HHATL RGS7BP SNORD114-9 CDKL2 NAP1L3 DZIP3 GABRB1 PRKCG MAPT PYGM C14orf132 SLC35F3 CDH12 SPOCK1 WIF1 SERPINI1 ATP1B1 DNAJC6 ALDH6A1 ANKRD36BP2 KLC1 OXCT1 SLC25A23 HECW2 ARPP21 MIR4534 SNORD115-44 SOGA3 CAMK2B CAMTA1 DOK6 DPP10 CABP1 CHGA CYFIP2 GLT1D1 PPM1H ASIC2 R3HDM1 SNORD114-25 ATP2B1 SNORD114-20 SCAI CLCN4 KCTD8 SLC9A6 ELAVL3 SNORD115-28 ATCAY ENHO SSTR2 KCNA2 RAB3B FOCAD B3GAT1 LINC00966 SERINC1 SNORD115-33 SNORD114-21 FXYD7 LINC00294 SNORD115-21 MARCH4 MRO LINC00889 HMGCS1 SNORD115-25 NEFH EHD3 ZDBF2 FRY GABBR2 BEX1 PART1 |
Table 1: Table 1 below shows a list of the genes that were identified as DEGs from the comparison between glioblastoma tissue and normal tissue. The genes that have been bolded are those that were identified as the 10 hub genes.
Gene ontology: The DAVID functional annotation tool was used to analyze the gene ontology, comparing glioblastoma tissue with normal tissue. After the DEGs were sorted into the three categories, the top 10 most significant go terms were identified for each category. In biological processes, the upregulated DEGs were mostly involved in nucleosome assembly, negative regulation of gene expression, and chromatin silencing at DNA, while the downregulated DEGs were mostly involved in chemical synapse transmission and nervous system development.
In cellular components, upregulated genes were involved with extracellular exosome and membrane, while downregulated genes were mostly involved with plasma membrane and cell junction [7].
In molecular functions, upregulated DEGs were enriched mostly in protein binding and protein heterodimerization activity, while downregulated DEGs were enriched in calcium ion binding and calmodulin binding. These findings suggest that the upregulated DEGs are mostly involved with protein binding, extracellular exosome, and membrane, and the downregulated DEGs are mostly involved with plasma membrane, cell junction, and chemical synaptic transmission. It is also demonstrated that chemical synaptic transmission is the most enriched term in biological processes, plasma membrane in cellular components, and protein binding in molecular functions (Figures 2 and 3).
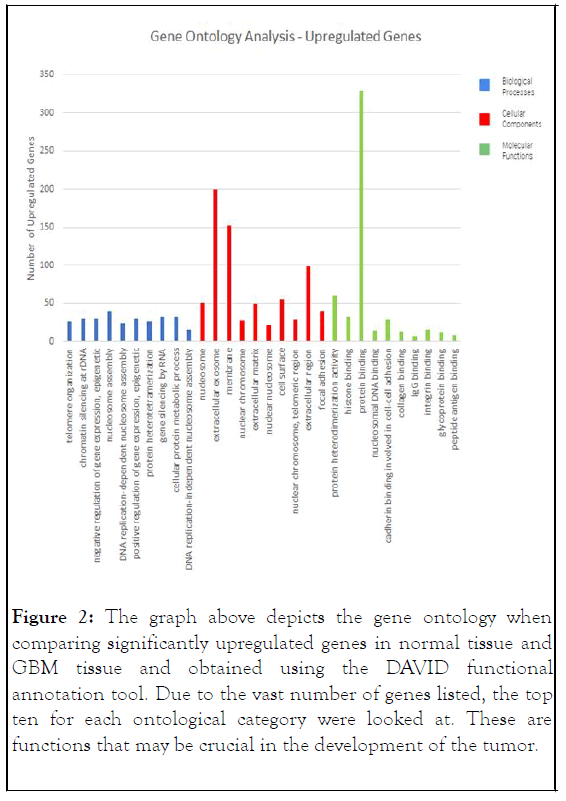
Figure 2: The graph above depicts the gene ontology when comparing significantly upregulated genes in normal tissue and GBM tissue and obtained using the DAVID functional annotation tool. Due to the vast number of genes listed, the top ten for each ontological category were looked at. These are functions that may be crucial in the development of the tumor.
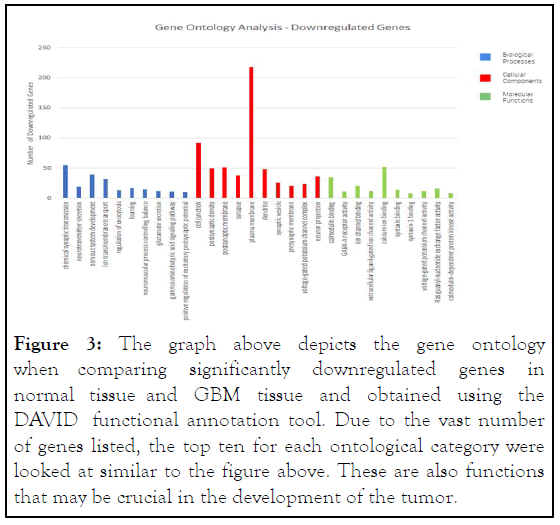
Figure 3: The graph above depicts the gene ontology when comparing significantly downregulated genes in normal tissue and GBM tissue and obtained using the DAVID functional annotation tool. Due to the vast number of genes listed, the top ten for each ontological category were looked at similar to the figure above. These are also functions that may be crucial in the development of the tumor.
KEGG pathway analysis: The DAVID functional annotation tool was utilized to do KEGG pathway analysis as well, where pathways that have been upregulated and downregulated were identified. Online publications and research were used to determine which pathways are needed to look at based on its relevance to glioblastoma and whether it has been proved to be linked to its progression [8]. The most enriched upregulated and downregulated pathway are the pathways in cancer pathway and cAMP signaling pathway respectively (Tables 2 and 3).
| Upregulated pathways | |||
|---|---|---|---|
| Pathway/Name | Gene # | P-value | Genes |
| hsa04514: Cell Adhesion Molecules (CAMs) | 21 | 1.18 x 10⁻⁶ | ITGB1, CD86, HLA-DRB5, ITGA4, HLA-B, HLA-C, HLA-G, HLA-E, HLA-DMA, VCAN, CD4, HLA-DMB, PTPRC, HLA- DPB1, PECAM1, HLA-DRA, ITGAV, CD226, CD58, HLA-DOA, HLA-DPA1 |
| hsa04151: PI3K-Akt signaling pathway | 28 | 8.99 x 10⁻⁴ | ITGB1, ITGB3, TNC, LAMC1, IL2RG, RELA, PIK3CG, NRAS, GNG5, IBSP, SPP1, ITGAV, MCL1, ANGPT2, ITGA4, LAMB2, ITGA2, ITGA1, FN1, LAMB1, OSMR, CDK6, COL4A2, COL4A1, MDM2, TP53CDK4, CDK2, |
| hsa04064: NF-kappa B signaling pathway | 10 | 9.16 x 10⁻³ | LYN, CCL4, BTK, TRIM25, CD14, IRAK4, RELA, MYD88, TNFSF13B, TNFRSF1A |
| hsa05200: Pathways in cancer | 29 | 2.97 x 10⁻³ | ITGB1, LAMC1, ETS1, HIF1A, RELA, PIK3CG, NRAS, EDNRA, GNG5, ITGAV, TGFB1, LAMB2, STAT1, MMP2, ITGA2, STAT3, FN1, LAMB1, MMP9, TGFBR1,TGFBR2, CDK6, COL4A2, COL4A1, CDK4, CDK2, CKS2, MDM2, TP53 |
Table 2: Table 2 was constructed after a KEGG pathway analysis was done using the DAVID functional annotation tool. Through the analysis, 4 pathways were found to be significantly upregulated. These pathways are significant in the development of the tumor due to the statistical significance and number of genes present in each pathway.
| Down regulated pathways | |||
|---|---|---|---|
| Pathway/Name | Gene # | P-value | Genes |
| hsa04024: cAMP signaling pathway | 30 | 4.22 x 10⁻¹² | CAMK2B, GRIA2, RYR2, CAMK2A, ATP1A3, ADCY1, ADCY5, MAPK9, PAK1, GRIN2A, AKT3, DRD1, CAMK2G, PRKACB, GABBR2, GABBR1, ATP2B3, ATP2B2, ATP2B1, SSTR2, ATP1B1, CALM1, CALM2, RAPGEF4GRIN2B, GRIN1, MAPK10, CAMK4, FXYD1, CALM3, |
| hsa04080: Neuroactive ligand- receptor interaction | 29 | 5.70 x 10⁻⁸ | GABRB3, GABRB2, GRIA2, GABRB1, THRB, THRA, GPR83, GRM1, MCHR2, GRIN2A, GRM5, GLRA3, DRD1, GABRD, CHRNB2, GABRA2, GABBR2, GABRA1, GABBR1, GABRA5, GABRA4, GABRG1, GRIN1, GLRBSSTR2, HTR5A, GABRG3, GRIN2B, GABRG2, |
| hsa04726: Serotonergic synapse | 14 | 5.29 x 10⁻⁵ | GABRB3, PRKCG, GABRB2, GABRB1, PRKCB, KCNJ9, CACNA1B, CACNA1A, HTR5A, ADCY5, GNG3, CYP4X1, PRKACB, KCNJ3 |
| hsa04014: Ras signaling pathway | 20 | 1.16 x 10⁻⁴ | PRKCG, PRKCB, RASGRF2, RASGRF1, GRIN2B, GRIN1, MAPK10, MAPK9, GNG3, PAK1, GRIN2A, SYNGAP1, AKT3, CALM3, CALM1, PAK3, CALM2, FGF12, PRKACB, PAK5 |
| hsa04310: Wnt signaling pathway | 15 | 1.34 x 10⁻⁴ | PRKCG, CAMK2B, PRKCB, CAMK2A, NLK, MAPK10, MAPK9, PPP3CA, PPP3CB, PPP3R1, APC, WIF1, BTRC, CAMK2G, PRKACB |
| hsa05214: Glioma | 9 | 1.07 x 10⁻³ | CAMK2B, PRKCG, PRKCB, AKT3, CAMK2A, CALM3, CALM1, CAMK2G, CALM2 |
| hsa04070: Phosphatidylinositol signaling system | 10 | 4.20 x 10⁻³ | CDS1, PRKCG, SYNJ1, DGKB, PRKCB, CALM3, PIP4K2B, CALM1, CALM2, DGKZ |
| hsa04722: Neurotrophin signaling pathway | 11 | 5.23 x 10⁻³ | CAMK2B, MAPK10, MAPK9, NTRK2, CAMK4, AKT3, CAMK2A, CALM3, CALM1, CAMK2G, CALM2 |
Table 3: Table 3 was constructed after a KEGG pathway analysis was done using the DAVID functional annotation tool. Through the analysis, 8 pathways were found to be significantly downregulated. These pathways are also significant in the development of the tumor due to the statistical significance and number of genes present in each pathway.
Construction of the PP1 network and identification of hub genes: The STRING database and cytoscape software were utilized in constructing a PPI network. A total of 148 DEGs were put into the software and database, resulting in a PP1 network that consisted of 130 nodes and 484 edges. From the 130 nodes, the 10 nodes with the highest degrees of connectivity were identified [9]. Cytoscape was used to analyze and identify the top 10 hub genes. The top ten hub genes with a degree of connectivity of 14 or higher were ITGB1, GNG3, GNG5, NRAS, CAMK2A, CAMK2B, ITGAV, ITGB3, ADCY5, and STAT3. ITGB1 has the highest degree of connectivity at 22 (Figure 4).
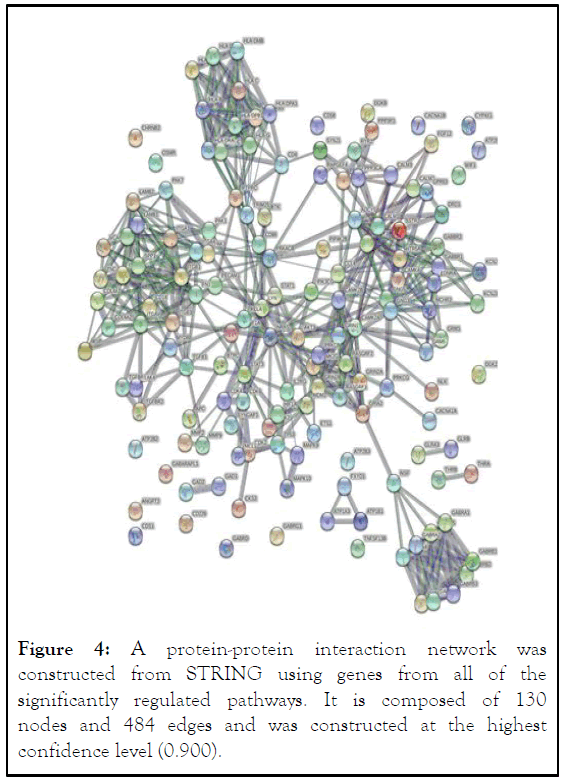
Figure 4: A protein-protein interaction network was constructed from STRING using genes from all of the significantly regulated pathways. It is composed of 130 nodes and 484 edges and was constructed at the highest confidence level (0.900).
Validation: GEPIA was used to validate the research. Boxplots were employed to compare the regulation of the genes in the sample accessed to a larger sample. It was determined if genes have been upregulated or downregulated in a larger sample size to ensure that it matches with the sample size. Analyzing if the gene is regulated similarly in both sample sizes validated the findings. The regulation of the genes in the smaller dataset composing of 3 GBM tissues and 3 normal tissues accessed through GEO was compared to a larger dataset consisting of 163 GBM tissues and 207 normal tissues (Figure 5).
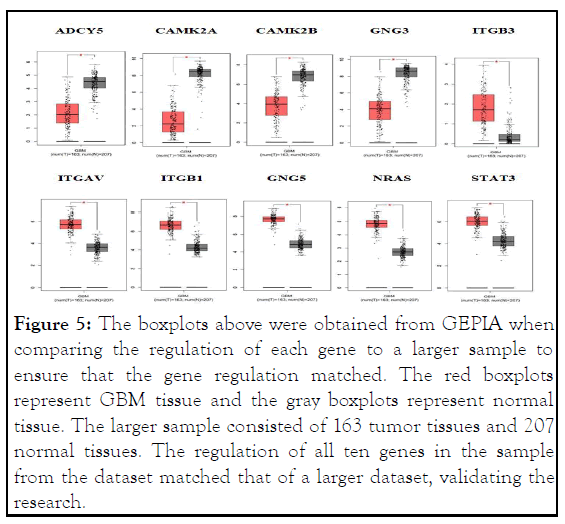
Figure 5: The boxplots above were obtained from GEPIA when comparing the regulation of each gene to a larger sample to ensure that the gene regulation matched. The red boxplots represent GBM tissue and the gray boxplots represent normal tissue. The larger sample consisted of 163 tumor tissues and 207 normal tissues. The regulation of all ten genes in the sample from the dataset matched that of a larger dataset, validating the research.
Survival analysis: When using PROGgeneV2, line graphs were utilized to determine how the regulation of a specific gene may affect the survival rate of a person while also making sure that the results are statistically significant with a p>0.05 (Table 4). Based on PROGgeneV2, high expression of the STAT3 gene is negatively associated with patients with a lower survival (Figure 6).
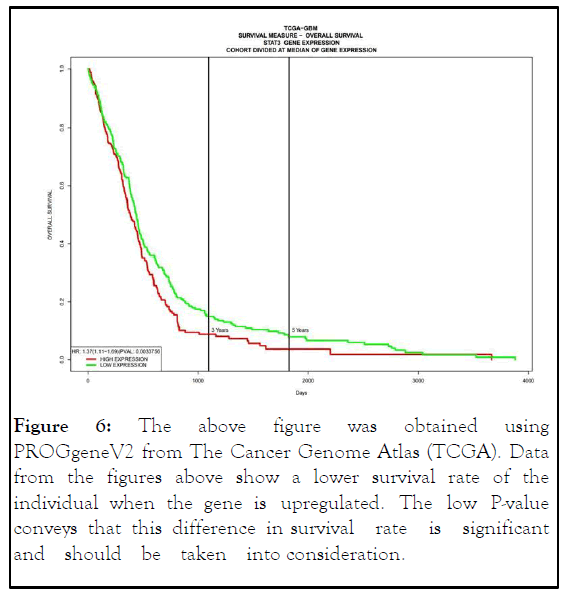
Figure 6:The above figure was obtained using PROGgeneV2 from The Cancer Genome Atlas (TCGA). Data from the figures above show a lower survival rate of the individual when the gene is upregulated. The low P-value conveys that this difference in survival rate is significant and should be taken into consideration.
| Category | Samples | No of events | Median survival | Low conf int (95%) | Upp conf int (95%) |
|---|---|---|---|---|---|
| High | 271 | 205 | 384 | 345 | 451 |
| Low | 271 | 221 | 438 | 399 | 479 |
Table 4: The below table was obtained using PROGgeneV2 from The Cancer Genome Atlas (TCGA). Data from the figures above show a lower survival rate of the individual when the gene is upregulated. The low P-value conveys that this difference in survival rate is significant and should be taken into consideration.
In this study, a total of 1,609 Differentially Expressed Genes (DEGs) (915 downregulated and 694 upregulated) were identified. The gene ontology revealed that the upregulated DEGs were involved mostly with cell proliferation and cell cycle, while the downregulated DEGs were involved mostly in synapses and nervous system development. The progression of GBM may be connected to multiple cellular components, biological processes, and molecular processes, as signified by the gene ontology. Studies show that disruption in cell proliferation is involved with the progression and development of the tumor. Functions from gene ontology and pathways from the KEGG pathway analysis may be crucial in the development of the tumor, requiring further study to be done.
The DEGs were put into STRING, creating a Protein- Protein Interaction network (PPI) composed of 130 nodes and 484 edges (connections to other genes). Using the DEGs and the PPI, 10 hub genes were identified through Cytoscape. A Kaplan-Meier analysis of the hub genes showed that overexpression of STAT3 is associated negatively with the patients, decreasing the survival rate significantly. Hence, STAT3 may be a key gene in GBM, whose functions may be integral in the tumor progression [10]. Signal Transducer and Activator of Transcription 3 (STAT3) genes is a cytoplasmic transcription factor regulated by cytokine and growth factor receptor, with a location of 17q21.2. The gene promotes transcription of multiple genes contributing to the cancer, including angiogenesis, anti-apoptosis, invasion, and cell cycle progression. It is proven to be found at a high regulation in many tumors, including GBM, and has been identified to be crucial in tumor progression.
The results of this study suggest that the Pathways and other processes identified through gene ontology and KEGG pathway analysis may be in close relation with the occurrence of GBM and its progression. STAT3 is found to be a key gene that can be associated with the prognosis of the tumor.
Due to its crucial role in the tumor progression and the poor survival rate when the gene is excessively expressed, STAT3 gene can be used as a prognostic biomarker with an upregulation being a sign. Additionally, identification of the upregulation may be helpful in identifying GBM cells. This gene can be used for therapeutic purposes and can be used in targeted therapy for the tumor by attacking the cells that have a high expression of the STAT3 gene. Further research is needed to evaluate STAT3 as a GBM biomarker and potential applications of pathways in the treatment of the tumor.
[Crossref] [Googlescholar] [Indexed]
[Crossref] [Googlescholar] [Indexed]
[Crossref] [Googlescholar] [Indexed]
[Crossref] [Googlescholar] [Indexed]
[Crossref] [Googlescholar] [Indexed]
[Crossref] [Googlescholar] [Indexed]
[Crossref] [Googlescholar] [Indexed]
[Crossref] [Googlescholar] [Indexed]
[Crossref] [Googlescholar] [Indexed]
[Crossref] [Googlescholar] [Indexed]
Citation: Kumari AS (2023) Identification and Analysis of Molecular Pathways and Key Candidate Biomarkers in Glioblastoma Multiforme. J Clin Trials. 13:525.
Received: 12-Oct-2022, Manuscript No. JCTR-22-19561; Editor assigned: 17-Oct-2022, Pre QC No. JCTR-22-19561 (PQ); Reviewed: 01-Nov-2022, QC No. JCTR-22-19561; Revised: 31-Jan-2023, Manuscript No. JCTR-22-19561 (R); Published: 07-Feb-2023 , DOI: 10.35248/2167-0870.23.13.525
Copyright: © 2023 Kumari AS. This is an open-access article distributed under the terms of the Creative Commons Attribution License, which permits unrestricted use, distribution, and reproduction in any medium, provided the original author and source are credited.