
Journal of Clinical Trials
Open Access
ISSN: 2167-0870

ISSN: 2167-0870
Research Article - (2022)
Background: This work investigates the use of methylation driven biomarkers for diagnosis and prognosis in Colorectal Cancer (CRC) by mining DNA methylation and gene expression data from The Cancer Genome Atlas (TCGA), the Genotype-Tissue Expression project (GTEx), and the Gene Expression Omnibus (GEO).
Methods: The Differentially Expressed Genes (DEGs) and Differentially Methylated Genes (DMGs) were screened using mRNA expression and DNA methylation data from TCGA, respectively. The Methylation Driven Genes (MDGs) of CRC were further identified using the MethylMix R package. Subsequently, the MDGs were analyzed with Random Forest (RF), Support Vector Machine (SVM), and Logistic Regression (LR) algorithms to establish diagnosis prediction models as independent indicators using mRNA expression data from TCGA and GTEx. The RF algorithm was determined to be the most suitable and used to construct the diagnostic model with the combined MDGs, which was then validated by GSE39582 from GEO. Prognostic biomarkers were used to establish the risk score model, which was generated by univariate and multivariate Cox regression analyses. Moreover, we constructed and validated a nomogram that integrated the risk score and clinical information, including age, gender, and tumor stage.
Results: 9 out of 10 MDGs performed well as independent diagnostic predictors, and STK33 and EPHX4 were also found to be associated with Overall Survival (OS). The results of the nomogram suggest that it is a better predictive model for prognosis than the risk score model.
Conclusion: Our findings suggest that the identified MDGs could be biomarkers for diagnosis and prognosis of CRC.
Colorectal cancer; Methylation driven genes; Diagnosis biomarkers; Prognosis biomarkers
CRC is one of the most prevalent malignant tumors and the second leading cause of mortality worldwide [1]. Despite the progress made in diagnosis and therapy, CRC patients usually develop recurrence and metastasis, leading to dramatic decreases in the 5-year survival rate [2]. Therefore, there is an urgent need to improve the diagnosis, treatment, and prognosis for patients with CRC.
Molecular characterization has great potential for improving understanding of tumor development and is extensively utilized to predict tumor diagnosis, treatment, and prognosis [3,4]. Using bioinformatics methods and machine learning, various types of biomarkers have been found to be related to the diagnosis and prognosis of tumors, including microRNAs [5,6], long non-coding RNAs [7,8], DEGs [9], DNA methylation [10,11] and others.
DNA methylation as an important regulator of gene expression has been researched in various cancers, such as endometrial cancer [12], prostate cancer [13], and hepatocellular carcinoma [14]. Although the mechanism of DNA methylation is not fully understood, it is assumed that DNA methylation could affect the binding of the transcription factors to their DNA targets sites, and then alter the expression of downstream genes [15-17], which may promote oncogenesis [15,18]. MethylMix, a R package that can identify MDGs through integrative analysis of DNA methylation and gene expression data from normal samples and tumor samples [19,20], was used to investigate the relationship between MDGs and the prognosis of CRC patients [21,22]. However, no studies have reported whether MDGs could be used as diagnostic indicators for CRC.
The public databases, especially TCGA and GEO, provide convenient access to systematic collections of sequencing data with detailed clinical and pathological information which have been applied in malignant tumor research. Meanwhile, the GTEx database contains a large number of gene expression samples of normal human patients that have been integrated with TCGA or GEO in various studies [23-25].
Based on existing literature data, we carried out studies to identify a set of MDGs using DNA methylation and gene expression data from TCGA, GEO, and the GTEx, and construct an independent diagnosis model using RF, SVM, and LR algorithms. Additionally, the MDGs, the presumed potential prognostic indicators, were analyzed using univariate and multivariate Cox regression analyses. Our findings may suggest that the potential methylation driven biomarkers could prompt more individualized diagnoses and therapies for CRC.
TCGA and GTEx data acquisition
The mRNA expression (RNA-seq data from Illumina platform) and DNA methylation data (Illumina Human Methylation 450) of CRC from TCGA and the mRNA expression of normal samples from the GTEx were downloaded from the UCSC Xena platform (https://xenabrowser.net/datapages/). Subsequently, the samples from TCGA were divided into the normal group and the tumor group. 667 samples (51 normal and 616 tumor) were selected for DEG analysis and MDG analysis was performed on 433 samples (45 normal and 388 tumor), detailed information is shown in Table 1. We selected 307 normal samples (123 females and 184 males) of mRNA expression data of colon tissue from the GTEx to provide supplementary data for normal samples from TCGA.
| Sample details for DEGs from TCGA | Sample details for DMGs from TCGA | GSE39582 for validation | |||||||
|---|---|---|---|---|---|---|---|---|---|
| Tumor | Normal | Overall | Tumor | Normal | Overall | Tumor | Normal | Overall | |
| (N=616) | (N=51) | (N=667) | (N=388) | (N=45) | (N=433) | (N=566) | (N=19) | (N=585) | |
| Gender | |||||||||
| Female | 288 (46.8%) | 28 (54.9%) | 316 (47.4%) | 179 (46.1%) | 21 (46.7%) | 200 (46.2%) | 256 (45.2%) | 7 (36.8%) | 263 (45.0%) |
| Male | 328 (53.2%) | 23 (45.1%) | 351 (52.6%) | 209 (53.9%) | 24 (53.3%) | 233 (53.8%) | 310 (54.8%) | 12 (63.2%) | 322 (55.0%) |
| Age | |||||||||
| <=60 | 192 (31.2%) | 14 (27.5%) | 206 (30.9%) | 148 (38.1%) | 11 (24.4%) | 159 (36.7%) | 157 (27.7%) | 3 (15.8%) | 160 (27.4%) |
| >60 | 424 (68.8%) | 37 (72.5%) | 461 (69.1%) | 240 (61.9%) | 34 (75.6%) | 274 (63.3%) | 409 (72.3%) | 16 (84.2%) | 425 (72.6%) |
| Pathologic stage | |||||||||
| I | 103 (16.7%) | 8 (15.7%) | 111 (16.6%) | 53 (13.7%) | 5 (11.1%) | 58 (13.4%) | 33 (5.8%) | 5 (26.3%) | 38 (6.5%) |
| II | 228 (37.0%) | 24 (47.1%) | 252 (37.8%) | 144 (37.1%) | 21 (46.7%) | 165 (38.1%) | 264 (46.6%) | 7 (36.8%) | 271 (46.3%) |
| III | 178 (28.9%) | 9 (17.6%) | 187 (28.0%) | 119 (30.7%) | 10 (22.2%) | 129 (29.8%) | 205 (36.2%) | 5 (26.3%) | 210 (35.9%) |
| IV | 86 (14.0%) | 9 (17.6%) | 95 (14.2%) | 52 (13.4%) | 9 (20.0%) | 61 (14.1%) | 60 (10.6%) | 0 (0%) | 60 (10.3%) |
| Missing | 21 (3.4%) | 1 (2.0%) | 22 (3.3%) | 20 (5.2%) | 0 (0%) | 20 (4.6%) | 4 (0.7%) | 2 (10.5%) | 6 (1.0%) |
| AJCC-T | |||||||||
| T1 | 19 (3.1%) | 2 (3.9%) | 21 (3.1%) | 10 (2.6%) | 0 (0%) | 10 (2.3%) | 11 (1.9%) | 1 (5.3%) | 12 (2.1%) |
| T2 | 104 (16.9%) | 7 (13.7%) | 111 (16.6%) | 54 (13.9%) | 5 (11.1%) | 59 (13.6%) | 45 (8.0%) | 4 (21.1%) | 49 (8.4%) |
| T3 | 421 (68.3%) | 36 (70.6%) | 457 (68.5%) | 271 (69.8%) | 37 (82.2%) | 308 (71.1%) | 367 (64.8%) | 12 (63.2%) | 379 (64.8%) |
| T4 | 69 (11.2%) | 6 (11.8%) | 75 (11.2%) | 50 (12.9%) | 3 (6.7%) | 53 (12.2%) | 119 (21.0%) | 0 (0%) | 119 (20.3%) |
| Missing | 3 (0.5%) | 0 (0%) | 3 (0.4%) | 3 (0.8%) | 0 (0%) | 3 (0.7%) | 24 (4.2%) | 2 (10.5%) | 26 (4.4%) |
| AJCC-M | |||||||||
| M0 | 455 (73.9%) | 35 (68.6%) | 490 (73.5%) | 263 (67.8%) | 27 (60.0%) | 290 (67.0%) | 482 (85.2%) | 17 (89.5%) | 499 (85.3%) |
| M1 | 85 (13.8%) | 9 (17.6%) | 94 (14.1%) | 51 (13.1%) | 9 (20.0%) | 60 (13.9%) | 61 (10.8%) | 0 (0%) | 61 (10.4%) |
| MX | 66 (10.7%) | 6 (11.8%) | 72 (10.8%) | 66 (17.0%) | 8 (17.8%) | 74 (17.1%) | 3 (0.5%) | 0 (0%) | 3 (0.5%) |
| Missing | 10 (1.6%) | 1 (2.0%) | 11 (1.6%) | 8 (2.1%) | 1 (2.2%) | 9 (2.1%) | 20 (3.5%) | 2 (10.5%) | 22 (3.8%) |
| AJCC-N | |||||||||
| N0 | 349 (56.7%) | 34 (66.7%) | 383 (57.4%) | 211 (54.4%) | 28 (62.2%) | 239 (55.2%) | 302 (53.4%) | 12 (63.2%) | 314 (53.7%) |
| N1 | 147 (23.9%) | 8 (15.7%) | 155 (23.2%) | 101 (26.0%) | 10 (22.2%) | 111 (25.6%) | 134 (23.7%) | 3 (15.8%) | 137 (23.4%) |
| N2 | 116 (18.8%) | 9 (17.6%) | 125 (18.7%) | 72 (18.6%) | 7 (15.6%) | 79 (18.2%) | 98 (17.3%) | 2 (10.5%) | 100 (17.1%) |
| Missing | 4 (0.6%) | 0 (0%) | 4 (0.6%) | 4 (1.0%) | 0 (0%) | 4 (0.9%) | 32 (5.7%) | 2 (10.5%) | 34 (5.8%) |
Table 1: Clinical information of TCGA and GEO dataset.
GEO data acquisition
We downloaded gene expression data by array (GSE21815, GSE28000, GSE39582, and GSE44076) and methylation data by genome tilling array (GSE48684, GSE53051, GSE77718, and GSE101764) from the GEO database (https://www.ncbi.nlm.nih.gov/geo/), and the sample size of each dataset can be found in Figure 1. Among them, GSE39582 has detailed clinical and phenotypic information, with a total of 566 tumor and 19 normal samples in Table 1.
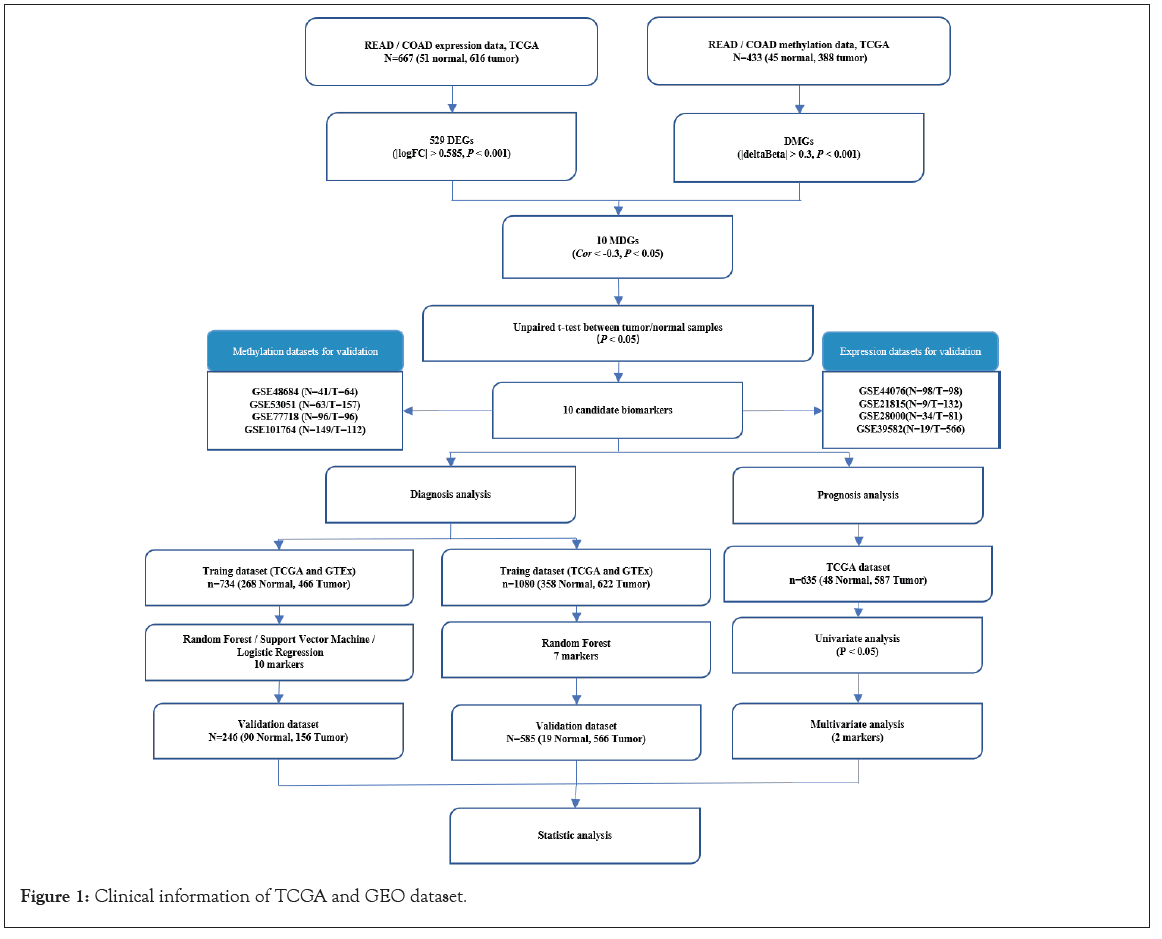
Figure 1: Clinical information of TCGA and GEO dataset.
Screening DEGs, DMGs and MDGs
We filtered out the genes with a read count of less than 10 in more than 50% of all the samples. The DEGs were identified by comparing the tumor group with the normal groups using the limma R package [26], with the cutoff criteria defined as | log 2 Fold Change (FC)| >0.585 and adjusted P-value <0.001. In addition, the probe with the highest absolute value of delta Beta and adjusted P-value less than 0.001 was selected as the representative of gene methylation level using the ChAMP R package [27], and |deltaBeta| >0.3 was used to screen DMGs.
Subsequently, the tumor methylation matrix, the normal methylation matrix, and the tumor expression matrix with overlapping DEGs and DMGs were constructed to identify MDGs using the R package MethylMix [19,20]. Significant methylation events were filtered using the correlation coefficient <-0.3 and P-value <0.05 as the cutoff criteria, and the correlation of the MDGs was visualized by the corrplot R package. The unpaired t test statistically analyzed the differences of the MDGs between the tumor samples and the normal samples.
Validation of MDGs using GEO datasets
To validate the MDGs, the gene expression profiling datasets (GSE21815, GSE28000, GSE39582, and GSE44076) were separately analyzed by the online software GEO2R (http://www.ncbi.nlm.nih.gov/geo/geo2r/), and the expression value of each MDG was obtained. The methylation value of each MDG in the gene methylation profiling datasets (GSE48684, GSE53051, GSE77718, GSE101764) was calculated using the ChAMP R package.
Identification and validation of diagnosis biomarkers
The mRNA expression datasets from TCGA and the GTEx were integrated and randomly divided into a training dataset and a validation dataset with a 3:1 ratio in tumor samples and normal samples; Principal Component Analysis (PCA) investigated the distribution of the combined samples of TCGA and the GTEx. To choose the optimal algorithm to build the diagnosis model, three different algorithms were used to evaluate the accuracy of the 10 MDGs as an independent predictor with default parameters and calculate the P-value of each MDG. The chosen algorithm was used to further evaluate the combined indicator for diagnosis of CRC. The GSE39582 dataset, containing 7 of the MDGs, was analyzed as a validation dataset in combination with training datasets from TCGA and the GTEx, the Receiver Operating Characteristic (ROC) curve was utilized to depict the sensitivity and specificity of the diagnosis models using independent MDGs or the combined MDGs panel.
Identification and evaluation of prognosis biomarkers
The mRNA expression data with OS information was selected to determine the prognostic biomarkers. The univariable Cox proportional hazards regression model was produced using the Survival R package, with the P-value cutoff of 0.05. Subsequently, Kaplan-Meier survival and multivariate Cox regression analyses were performed to determine independent prognostic factors; the coefficient of the MDGs was obtained from the multivariate Cox results. The risk score based on the signature of each CRC patient was calculated using the following formula:
MDGs risk score=ΣCox coefficient of gene χi ×Scale expression value of gene χi
To further evaluate the predictive efficiency of the constructed MDGs risk score model, we used the ROC curve to reflect the sensitivity and specificity of survival prediction and quantified the Area Under the Curve (AUC) using the survival ROC R package. The optimal cutoff risk score was designated at the turning point of the ROC curve, where the difference between true positive and false positive is the most significant. The patients above the cutoff value were in the high-risk group, while the patients below it was in the low-risk group. In addition, Kaplan-Meier curves were plotted to distinguish the two groups using the survminer R package.
Construction and validation of the nomogram model
To improve the accuracy of the prognostic model, we constructed a nomogram that visualized the prognostic value of different patients’ characteristics by integrating risk score and clinical information, including age, gender, and tumor stage. This analysis was performed using the rms R package to plot calibration curves to evaluate the predicted probabilities in comparison with the ideal predictive line. In addition, a forest plot based on univariable Cox analysis illustrated the relationship between clinical information and OS. Moreover, the Concordance index (C-index) indicated the predictive accuracy of the nomogram.
Identification of MDGs as candidate diagnostic and prognostic biomarkers
The data generation and analysis workflow are shown in Figure 1. After merging the expression datasets and methylation datasets of Colon Adenocarcinoma (COAD) and Rectum Adenocarcinoma (READ) from TCGA, and expression datasets from TCGA and the GTEx, respectively, PCA showed that the normal samples and the tumor samples were well separated. The samples of READ and COAD, TCGA, and the GTEx were randomly distributed, which indicated that the merged data sets could be used for further analysis (Figure S1A and S1B). Expression and DNA methylation data from TCGA were separately analyzed to screen DEGs and DMGs by comparing normal samples and tumor samples. As a result, 522 DEGs (266 upregulated and 256 downregulated) were identified (Figure 2A and Table S1), and the detailed information about DMGs was shown in Table S2.
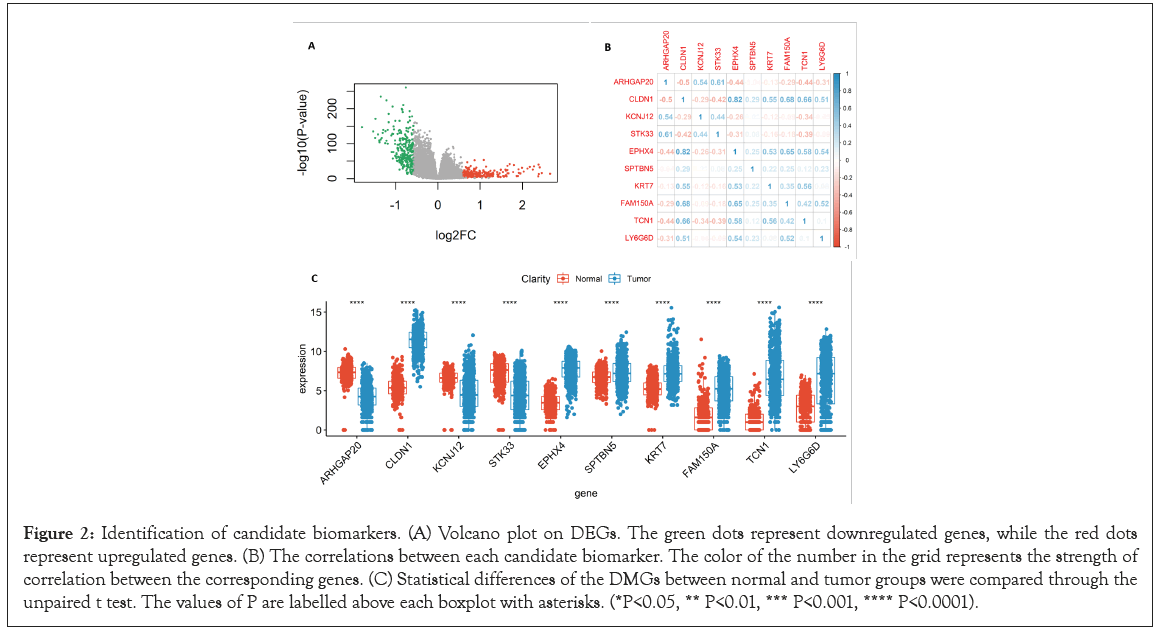
Figure 2: Identification of candidate biomarkers. (A) Volcano plot on DEGs. The green dots represent downregulated genes, while the red dots represent upregulated genes. (B) The correlations between each candidate biomarker. The color of the number in the grid represents the strength of correlation between the corresponding genes. (C) Statistical differences of the DMGs between normal and tumor groups were compared through the unpaired t test. The values of P are labelled above each boxplot with asterisks. (*P<0.05, ** P<0.01, *** P<0.001, **** P<0.0001).
Subsequently, R package MethylMix was used for identifying MDGs with a filter criterion set as Cor <-0.3, | deltaBeta | >0.3 and adjusted P-value <0.001, and 10 MDGs were identified as candidate diagnostic and prognostic biomarkers. Pearson’s correlation test statistically analyzed the correlations between methylation degree and gene expression of the MDGs using the cor.test function of the R language (https://www.r-project.org/) (Figure 3) and found that the methylation degree of those 10 MDGs was negatively correlated with their expression. The higher the methylation degree was, the lower the gene expression, and the detailed information of the MDGs is shown in Table 2. The correlations between each candidate biomarker, which may help us choose the optimal independent gene set for the diagnosis of CRC, were investigated using the corrplot R package (Figure 2B). In addition, the unpaired t test was conducted to quantify the difference of each candidate biomarker between the normal samples and the tumor samples; significant difference was found in all the candidate biomarkers (Figure 2C).
| Gene name | Tumor_AVG1 | Normal_AVG2 | deltaBeta | P.Value | Cor3 | Cor p-value4 |
|---|---|---|---|---|---|---|
| ARHGAP20 | 0.56 | 0.13 | -0.44 | 6.90E-17 | -0.3423 | 3.02E-12 |
| CLDN1 | 0.47 | 0.91 | 0.44 | 1.66E-33 | -0.4262 | 8.90E-19 |
| EPHX4 | 0.61 | 0.97 | 0.36 | 1.08E-19 | -0.4539 | 2.26E-21 |
| FAM150A | 0.55 | 0.25 | -0.34 | 4.76E-16 | -0.4362 | 1.09E-19 |
| KCNJ12 | 0.33 | 0.02 | -0.31 | 1.21E-17 | -0.4154 | 8.02E-18 |
| KRT7 | 0.73 | 0.31 | -0.51 | 1.59E-38 | -0.454 | 2.20E-21 |
| LY6G6D | 0.40 | 0.76 | 0.32 | 4.07E-36 | -0.3857 | 2.17E-15 |
| SPTBN5 | 0.61 | 0.91 | 0.31 | 1.40E-28 | -0.3836 | 3.16E-15 |
| STK33 | 0.46 | 0.11 | -0.36 | 9.67E-17 | -0.5458 | 6.91E-32 |
| TCN1 | 0.44 | 0.81 | 0.36 | 2.94E-26 | -0.4672 | 1.07E-22 |
Table 2: The information of MDGs.
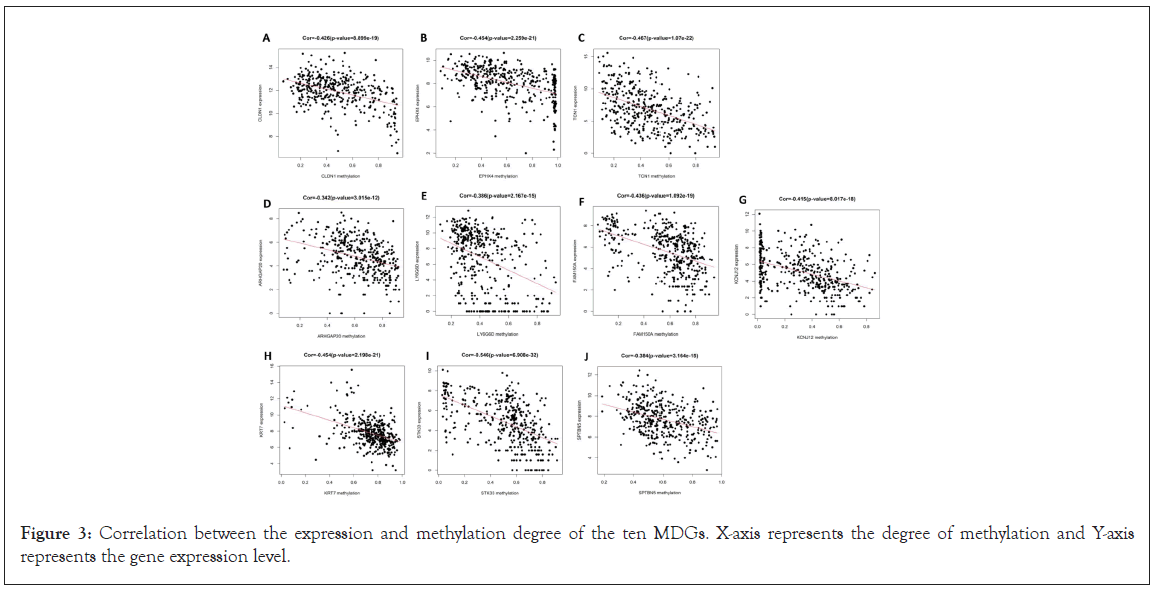
Figure 3: Correlation between the expression and methylation degree of the ten MDGs. X-axis represents the degree of methylation and Y-axis represents the gene expression level.
Moreover, we verified the gene differences and methylation differences of these MDGs in other datasets (4 expression GEO datasets and 4 methylation GEO datasets) and found that the trend was consistent. The significant differences of gene expression and methylation of these MDGs were verified in at least one other dataset in Table 3. The DEGs of each GEO dataset is shown in Figure S1C-S1F.
| Gene name | Expression datasets | ||||
|---|---|---|---|---|---|
| Dataset for discovery | Datasets for validation | ||||
| TCGA(READ and COAD) | GSE44076 | GSE21815 | GSE28000 | GSE39582 | |
| ARHGAP20 | -0.75 | -0.76 | -1.74 | -0.84 | -0.90 |
| KCNJ12 | -0.61 | -0.32 | -1.17 | -1.04 | / |
| STK33 | -0.59 | -0.01 | -0.44 | -1.29 | -0.19 |
| KRT7 | 0.60 | 1.22 | 0.58 | 0.24 | 0.70 |
| SPTBN5 | 0.60 | 0.18 | 1.67 | 0.50 | 0.34 |
| CLDN1 | 0.77 | 4.92 | 5.06 | 3.14 | 3.98 |
| EPHX4 | 1.11 | 2.80 | 4.50 | 1.82 | 2.45 |
| FAM150A | 1.16 | 1.40 | 1.63 | 1.69 | / |
| LY6G6D | 1.48 | 3.84 | / | / | / |
| TCN1 | 1.56 | 1.91 | 3.42 | 2.20 | 1.61 |
| Gene name | Methylation datasets | ||||
| Dataset for discovery | Datasets for validation | ||||
| TCGA | GSE48684 | GSE53051 | GSE77718 | GSE101764 | |
| KRT7 | -0.51 | -0.38 | -0.30 | -0.34 | -0.32 |
| ARHGAP20 | -0.44 | -0.38 | -0.29 | -0.38 | -0.31 |
| STK33 | -0.36 | -0.36 | -0.25 | -0.37 | -0.26 |
| FAM150A | -0.34 | -0.34 | -0.25 | -0.34 | -0.26 |
| KCNJ12 | -0.31 | -0.25 | -0.23 | -0.33 | -0.23 |
| SPTBN5 | 0.31 | 0.30 | 0.22 | 0.21 | 0.23 |
| LY6G6D | 0.32 | 0.17 | 0.27 | 0.19 | 0.23 |
| TCN1 | 0.36 | 0.25 | 0.29 | 0.26 | 0.23 |
| EPHX4 | 0.36 | 0.22 | 0.20 | 0.14 | 0.21 |
| CLDN1 | 0.44 | 0.22 | 0.35 | 0.23 | 0.31 |
Table 3: Statistical information of expression and methylation values in MDGs.
Evaluation of the MDGs as candidate diagnostic biomarkers
We used three different algorithms to evaluate the performance of MDGs in establishing prognosis models. Among them, SVM algorithms performed the worst (Figure S2); RF and LR algorithms had similar results, which can be seen in Figure 4 and Figure S3, respectively. However, when using the LR algorithm to construct prediction models with joint MDGs, the algorithm does not aggregate; using the RF algorithm, the calculated P-value of each MDG is less than 0.0001, while in the other two algorithms, the P-value of SPTBN5 is greater than 0.0001 (Table 4). Therefore, the RF algorithm was selected to further build the diagnostic model of the joint MDGs. When using MDGs to build prediction models with the RF algorithm, 9 out of 10 MDGs revealed excellent performance as independent diagnostic predictors, where the Area Under the Curve (AUC) of CLDN1 is 0.988, EPHX4 is 0.971, TCN1 is 0.966, ARHGAP20 is 0.921, LY6G6D is 0.886, FAM150A is 0.869, KCNJ12 is 0.857, KRT7 is 0.860, and STK33 is 0.842 (Figure 4 A-4I). Additionally, the performances of the combined MDGs were further assessed in samples from TCGA-GTEx and GEO and the outcome of the AUC was 1.0 and 0.996, respectively (Figure 4 K and 4L). The importance of each predictor for the combined predictive model is shown in Table 5. The larger the number of Mean Decrease Accuracy and Mean Decrease Gini, the more important the predictor for the model. It was found that the numbers of Mean Decrease Accuracy and Mean Decrease Gini were positively correlated with the AUC of the predictive model of the predictor. Moreover, unsupervised hierarchical clustering of the combined panels with ten makers or seven makers indicated that the constructed models could accurately distinguish CRC patients from normal controls (Figure 5A-5D). Collectively, the 10 MDGs could be candidate biomarkers for diagnosis of CRC samples and 9 of them performed well as independent indicators.
| Gene name | RF algorithm | LR algorithm | SVM algorithm | |||
|---|---|---|---|---|---|---|
| AUC | P-value | AUC | P-value | AUC | P-value | |
| CLDN1 | 0.988 | 0 | 0.999 | 0 | 0.978 | 0 |
| EPHX4 | 0.971 | 0 | 0.991 | 0 | 0.959 | 1.55E-246 |
| TCN1 | 0.966 | 1.18E-214 | 0.979 | 0 | 0.932 | 1.56E-129 |
| ARHGAP20 | 0.921 | 2.12E-141 | 0.915 | 1.03E-88 | 0.846 | 9.53E-45 |
| LY6G6D | 0.886 | 2.32E-81 | 0.772 | 2.15E-20 | 0.763 | 3.35E-24 |
| FAM150A | 0.869 | 1.82E-41 | 0.885 | 1.82E-62 | 0.815 | 1.24E-32 |
| KCNJ12 | 0.857 | 5.60E-50 | 0.778 | 1.36E-19 | 0.732 | 3.88E-15 |
| KRT7 | 0.860 | 4.01E-44 | 0.858 | 2.12E-53 | 0.727 | 1.26E-14 |
| STK33 | 0.842 | 1.78E-39 | 0.841 | 1.20E-39 | 0.721 | 2.96E-14 |
| SPTBN5 | 0.678 | 3.19E-07 | 0.596 | 0.007856458 | 0.5 | 1 |
Table 4: The performance of the MDGs as independent indicator using RF, LR and SVM algorithm.
| Predict factor | Normal | Tumor | Mean decrease accuracy | Mean decrease Gini |
|---|---|---|---|---|
| CLDN1 | 0.29 | 0.10 | 0.17 | 115.72 |
| EPHX4 | 0.17 | 0.04 | 0.09 | 87.21 |
| TCN1 | 0.08 | 0.01 | 0.04 | 49.64 |
| ARHGAP20 | 0.12 | 0.03 | 0.07 | 41.59 |
| FAM150A | 0.01 | 0.01 | 0.01 | 14.79 |
| LY6G6D | 0.05 | 0.00 | 0.02 | 10.32 |
| KRT7 | 0.02 | 0.00 | 0.01 | 6.76 |
| STK33 | 0.04 | 0.01 | 0.02 | 6.65 |
| KCNJ12 | 0.06 | 0.00 | 0.02 | 6.58 |
| SPTBN5 | 0.00 | 0.00 | 0.00 | 0.72 |
Table 5: The importance of diagnostic biomarkers.
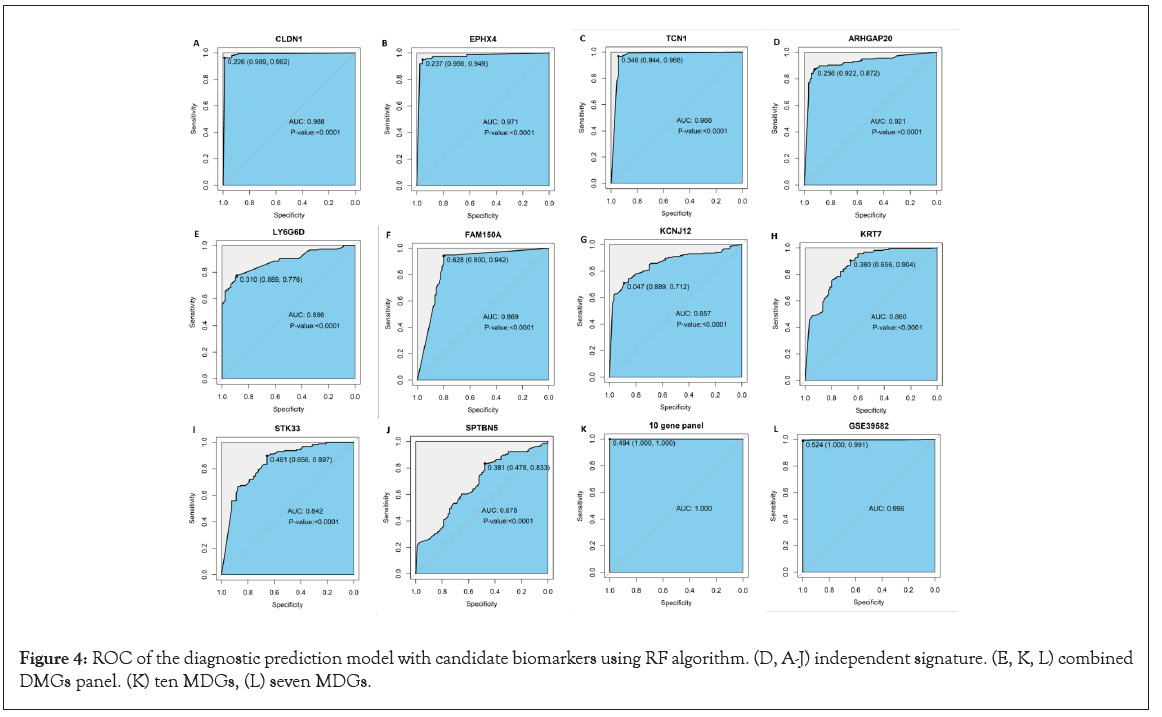
Figure 4: ROC of the diagnostic prediction model with candidate biomarkers using RF algorithm. (D, A-J) independent signature. (E, K, L) combined DMGs panel. (K) ten MDGs, (L) seven MDGs.
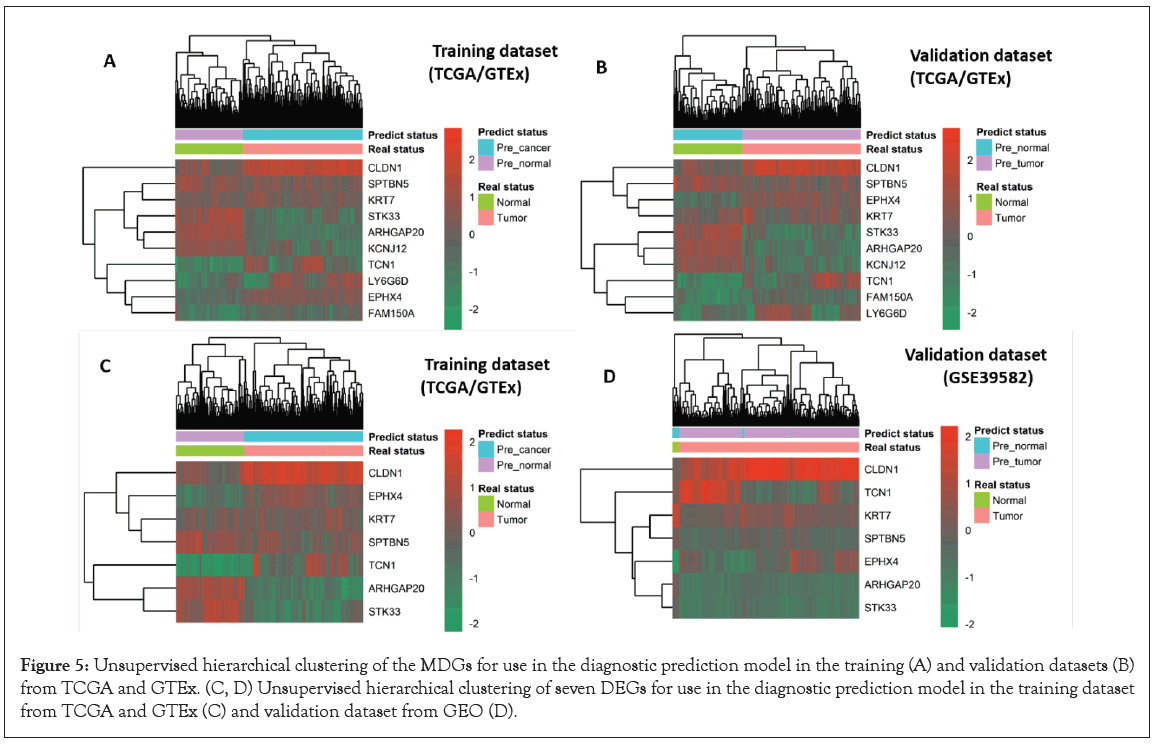
Figure 5: Unsupervised hierarchical clustering of the MDGs for use in the diagnostic prediction model in the training (A) and validation datasets (B) from TCGA and GTEx. (C, D) Unsupervised hierarchical clustering of seven DEGs for use in the diagnostic prediction model in the training dataset from TCGA and GTEx (C) and validation dataset from GEO (D).
Construction and evaluation of MDGs related prognostic model in CRC patients
Univariate Cox regression analysis revealed that 2 of the 10 MDGs were independent prognostic indicators of OS, as the hazard ratio of STK33 was 1.09 (95% CI: 1.01-1.17, P=0.021) and EPHX4 was 0.91 (CI: 0.83-0.99, P=0.032) (Figure 6A). Subsequently, Kaplan- Meier analyses and log-rank tests using STK33 and EPHX4 as independent prognostic indicators indicated that patients with high-risk scores suffered poor OS, with the P-value of 0.008 and 0.047, respectively (Figure 6B and 6C). We calculated the risk score of each CRC patient using the formula as follows: (1.09 × STK33)+(0.91 × EPHX4); then CRC patients (n=635) were categorized into the high-risk score group or the low-risk score group, according to the optimal cut-off value of the risk score obtained from the survminer R package. The results also indicated that high-risk score patients had a worse OS rate than low-risk score patients (P<0.0001) (Figure 6D). The prognostic accuracy of the risk score model was investigated as a continuous variable (Figure 6E). The AUC of the prognostic model for OS was 0.569 at 3 years, 0.633 at 4 years, and 0.626 at 5 years.
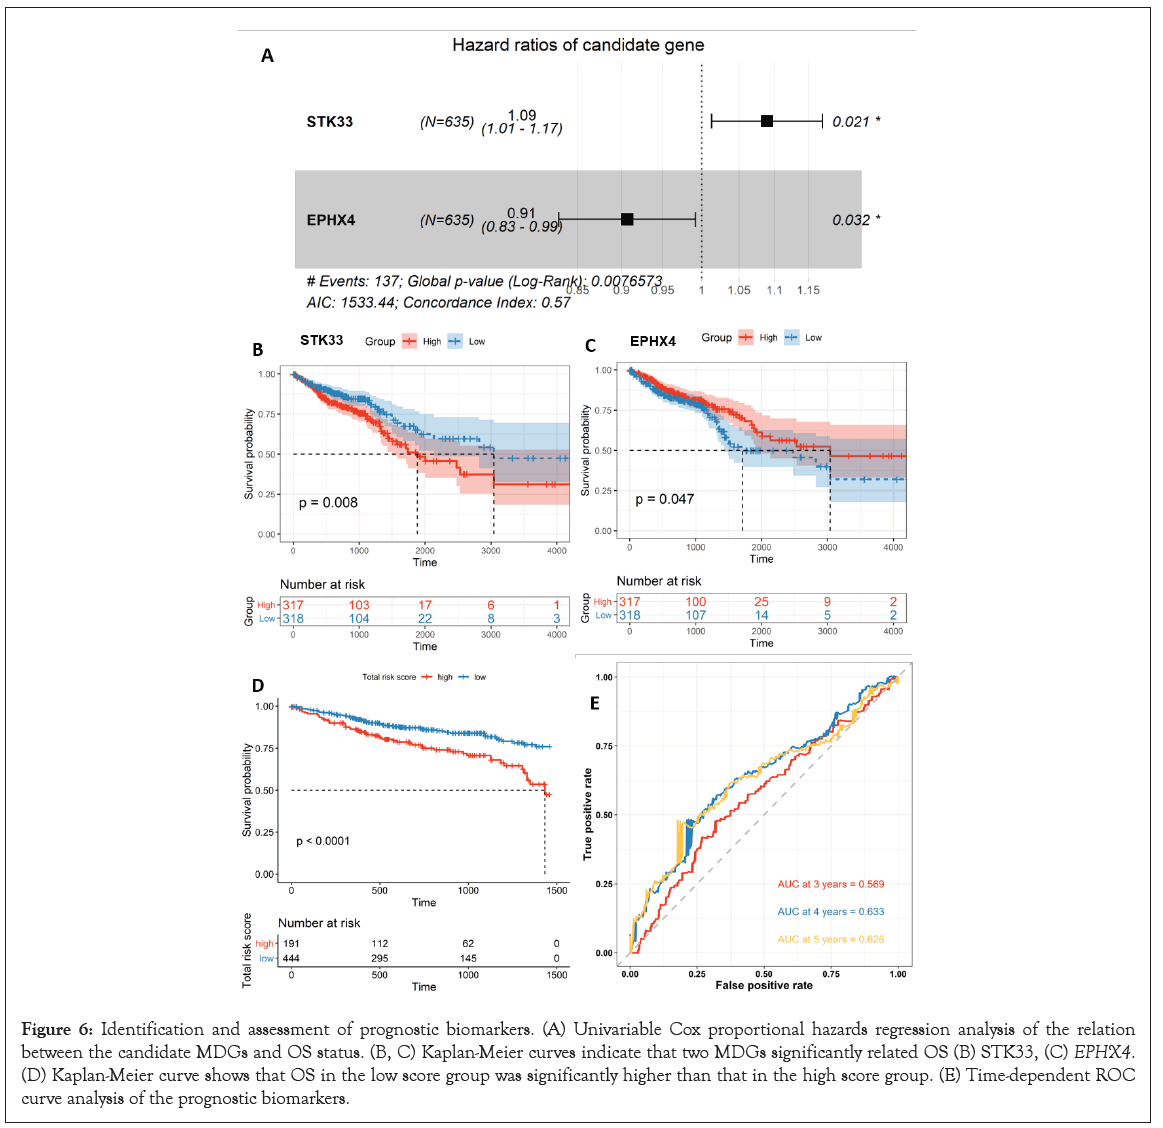
Figure 6: Identification and assessment of prognostic biomarkers. (A) Univariable Cox proportional hazards regression analysis of the relation between the candidate MDGs and OS status. (B, C) Kaplan-Meier curves indicate that two MDGs significantly related OS (B) STK33, (C) EPHX4. (D) Kaplan-Meier curve shows that OS in the low score group was significantly higher than that in the high score group. (E) Time-dependent ROC curve analysis of the prognostic biomarkers.
Construction and validation of the nomogram model
In the nomogram the score for each variable can be found on the point scale, then used to estimate the probability of survival at 1, 3, and 5 years by calculating the total score (Figure 7A). The forest plot shows that patient characteristics, including age (>60), tumor stage (III and IV), and risk score are associated with OS (P-value<0.001) (Figure 7B).
To validate the nomogram’s performance, we plotted the calibration curves and observed that the predictive curves were close to the ideal curve (Figure 7C-7E), which indicates good performance. Furthermore, the predictive accuracy of this nomogram (C-index: 0.72) was higher than the risk score model (C-index: 0.57).
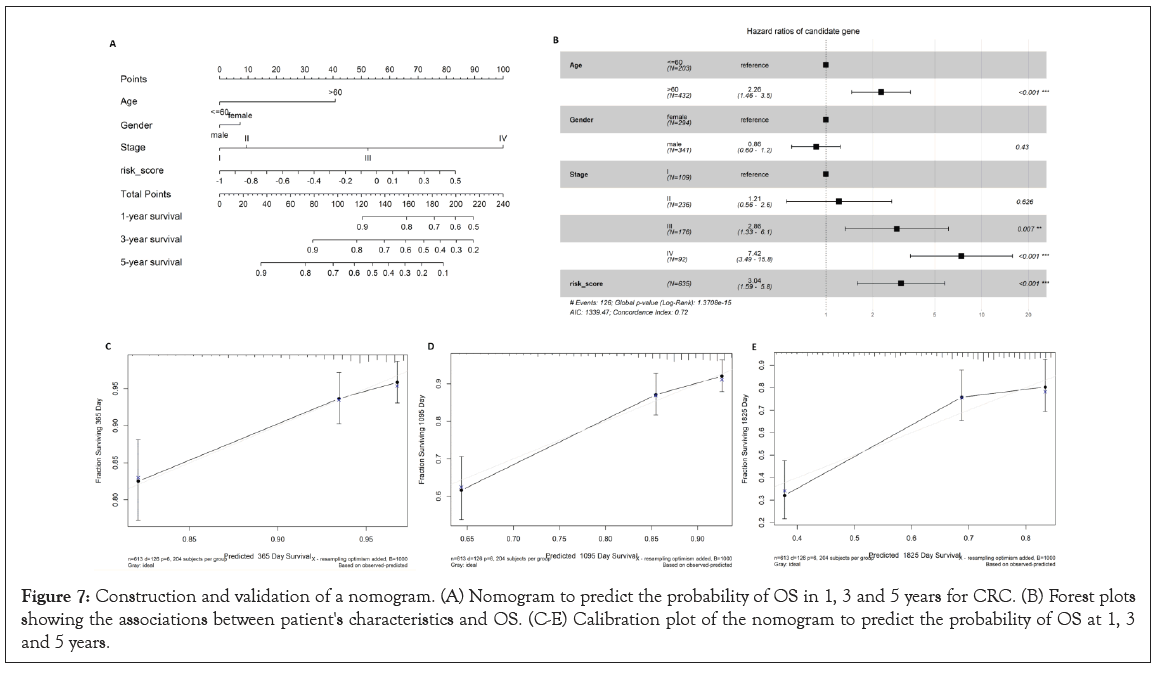
Figure 7: Construction and validation of a nomogram. (A) Nomogram to predict the probability of OS in 1, 3 and 5 years for CRC. (B) Forest plots showing the associations between patient's characteristics and OS. (C-E) Calibration plot of the nomogram to predict the probability of OS at 1, 3 and 5 years.
Many previous studies have reported that DMGs and DEGs can be used as prognostic and diagnostic biomarkers for CRC [11,28-30]. A previous study also reported that MDGs can assist with determining the prognosis of CRC patients [21]. However, no studies researched the relationship between MDGs and the diagnoses of CRC patients. In this study, we investigated the interplay between DMGs and DEGs and chose the genes with negative and high correlation, namely MDGs, as candidate predictors for the prognosis and diagnosis of CRC. We identified 10 MDGs that could be considered as potential diagnostic and prognostic predictors for CRC patients: CLDN1, EPHX4, TCN1, LY6G6D, FAM150A, KRT7, STK33, ARHGAP20, KCNJ12 and SPTBN5. Among them, STK33 and EPHX4 were correlated with both diagnosis and prognosis of colorectal cancer, while the others only performed well as diagnostic indicators of colorectal cancer. Consistent with our findings, various studies have demonstrated that STK33 is overexpressed in hypopharyngeal squamous cell carcinoma [31], hepatocellular carcinoma [32], and human large cell lung cancer [33]. STK33 hypermethylation may be a biomarker for the diagnosis, prognosis, and suitable treatment of CRC [34]. Previous studies demonstrated that EPHX4 was significantly upregulated in rectal cancer [35] and pseudomyxoma peritonei [36]. However, the pathological role and clinical significance of EPHX4 for CRC have rarely been reported. As a member of the claudin family and tight junction-related proteins, CLDN1 was demonstrated to be associated with dysfunction or abnormal expression in various tumors [37,38]. In addition, a previous study revealed that aberrant expression of CLDN1 regulated the AMPK/ STAT1/ULK1 signaling pathways, leading to the promotion of proliferation and metastasis in esophageal squamous cancer [39]. CLDN1 was experimentally demonstrated to be remarkably upregulated in CRC patients and could be considered as a methylated diagnostic biomarker in CRC patients and normal control groups [40]. A growing number of studies have verified that the overexpression of TCN1 is associated with tumor invasion and metastasis in CRC [41,42] and experimentally demonstrated that TCN1 was significantly overexpressed in colon cancer tissues compared with normal controls at the mRNA and protein level, and could be considered as potential prognostic biomarker of colon cancer [43]. A previous study showed that KRT7 plays a significant role in tumor metastasis and is considered as a prognostic biomarker and potential target for therapeutic prevention of metastasis [44]. In addition, KRT7 was down-regulated and hypermethylated in CRC tissues compared with adjacent normal tissues and may lead to the occurrence of CRC [45]. Y6G6D belongs to a cluster of leukocyte antigen-6 genes, which was conspicuously overexpressed (around 15-fold) and considered a promising biomarker of immunotherapy for microsatellite stable CRC [46]. FAM150A can Activate Lymphoma Kinase (ALK) by binding to its extracellular domain [47,48]; ALK has been used as an effective biomarker in various human cancers, such as neuroblastoma and non-small cell lung cancer [49]. Additionally, the DNA methylation status of FAM150A was indicated to be a diagnostic and prognostic indicator for clear cell Renal Cell Carcinoma (ccRCC) using the high-performance liquid chromatography method [50]. However, no studies found that FAM150A was associated with CRC. To the best of our knowledge, there is still a lack of research about the relationship between ARHGAP20, KCNJ12, and SPTBN5 and oncogenesis, which may represent novel predictive biomarkers.
The ROC curves were conducted to evaluate the diagnostic performance of each MDG as an independent indicator, and the results showed that the MDGs had relatively high diagnostic values for CRC, except SPTBN5 (set cutoff of AUC as 0.7). The AUC of SPTBN5 as a diagnostic indicator was 0.679 (P-value=3.19E-07) using the RF algorithm, 0.596 (P-value=0.000786) using the LR algorithm, and 0.5 (P-value=1) using the SVM algorithm. A previous study integrated and analyzed the expression data of CRC from the GEO and TCGA databases and constructed the diagnostic model using 10 hub genes; the AUC of the 10 genes were 0.900, 0.927, 0.869, 0.863, 0.980, 0.682, 0.903, 0.790, 0.995, and 0.989 for CCL19, CXCL1, CXCL5, CXCL11, CXCL12, GNG4, INSL5, NMU, PYY, and SST [51]. The results showed that the performance of the two models is similar, and our model integrates the GTEx dataset, which has a relatively large sample size and has been verified with the GEO dataset. The Kaplan-Meier curve of the 10 MDGs showed that STK33 and EPHX4 were significantly related to the prognosis of CRC patients. The AUC of the prognostic model was 0.569 for 3 years, 0.633 for 4 years, and 0.626 for 5 years. A previous study established an immune-related prognostic model for CRC using 9 genes, the AUC of which is 0.627 for 3 years, 0.632 for 4 years, and 0.630 for 5 years [52]. Although our prognostic model is relatively poor, it was built based on fewer genes. Furthermore, we constructed a nomogram based on the multivariable Cox regression coefficients of risk score, age, gender, and tumor stage to further validate our findings. The C-index of the nomogram was significantly higher than the C-index of the risk score model, which was remarkably associated with OS, suggesting that the two MDGs could be used as prognostic indicators.
We identified 10 MDGs that could be used as potential biomarkers for CRC, of which 9 performed well as independent diagnostic predictors and 2 could be used as prognostic indicators.
Our findings suggest that the identified MDGs could be biomarkers for diagnosis and prognosis of CRC.
Additional file 1: Table S1-Detailed information of DEGs.
Additional file 2: Table S2-Detailed information of DMGs
The data that support the findings of this study are openly available in TCGA and GTEx from the UCSC Xena (https://xenabrowser. net/datapages/) and GEO with accession numbers GSE21815, GSE28000, GSE39582, GSE44076, GSE48684, GSE53051, GSE77718, and GSE101764.
This work was supported by a grant from the Key Science and Technology Program of Shaanxi Province (2019ZDLSF02-05) and National Natural Scientific Foundation of China (81974378 and 82003115).
[Cross ref] [Google scholar] [Pubmed]
[Cross ref] [Google scholar] [Pubmed]
[Cross ref] [Google scholar] [Pubmed]
[Cross ref] [Google scholar] [Pubmed]
[Cross ref] [Google scholar] [Pubmed]
[Cross ref] [Google scholar] [Pubmed]
[Cross ref] [Google scholar] [Pubmed]
[Cross ref] [Google scholar] [Pubmed]
[Cross ref] [Google scholar] [Pubmed]
[Cross ref] [Google scholar] [Pubmed]
[Cross ref] [Google scholar] [Pubmed]
[Cross ref] [Google scholar] [Pubmed]
[Google scholar] [Pubmed]
[Cross ref] [Google scholar] [Pubmed]
[Cross ref] [Google scholar] [Pubmed]
[Cross ref] [Google scholar] [Pubmed]
[Cross ref] [Google scholar] [Pubmed]
[Cross ref] [Google scholar] [Pubmed]
[Cross ref] [Google scholar] [Pubmed]
[Cross ref] [Google scholar] [Pubmed]
[Cross ref] [Google scholar] [Pubmed]
[Cross ref] [Google scholar] [Pubmed]
[Cross ref] [Google scholar] [Pubmed]
[Cross ref] [Google scholar] [Pubmed]
[Cross ref] [Google scholar] [Pubmed]
[Cross ref] [Google scholar] [Pubmed]
[Cross ref] [Google scholar] [Pub Med]
[Cross ref] [Google scholar] [Pub Med]
[Cross ref] [Google scholar] [Pub Med]
[Cross ref] [Google scholar] [Pub Med]
[Cross ref] [Google scholar] [Pub Med]
[Cross ref] [Google scholar] [Pub Med]
[Cross ref] [Google scholar] [Pub Med]
[Cross ref] [Google scholar] [Pub Med]
[Cross ref] [Google scholar] [Pub Med]
[Cross ref] [Google scholar] [Pub Med]
[Cross ref] [Google scholar] [Pub Med]
[Cross ref] [Google scholar] [Pub Med]
[Cross ref] [Google scholar] [Pub Med]
[Cross ref] [Google scholar] [Pub Med]
[Cross ref] [Google scholar] [Pub Med]
[Cross ref] [Google scholar] [Pub Med]
[Cross ref] [Google scholar] [Pub Med]
[Cross ref] [Google scholar] [Pub Med]
[Cross ref] [Google scholar] [Pub Med]
[Cross ref] [Google scholar] [Pub Med]
[Cross ref] [Google scholar] [Pub Med]
[Cross ref] [Google scholar] [Pub Med]
[Cross ref] [Google scholar] [Pub Med]
[Cross ref] [Google scholar] [Pub Med]
[Cross ref] [Google scholar] [Pub Med]
[Cross ref] [Google scholar] [Pub Med]
Citation: Cao L, Ba Y, Yang J, Zhang H (2022) Identification of Methylation Driven Biomarkers for Diagnosis and Prognosis in Colorectal Cancer by Integrative Analysis of TCGA, GTEx, and GEO Database. J Clin Trials. S16:003.
Received: 02-Mar-2022, Manuscript No. JCTR-22-16060; Editor assigned: 04-Mar-2022, Pre QC No. JCTR-22-16060(PQ); Reviewed: 17-Mar-2022, QC No. JCTR-22-16060; Revised: 21-Mar-2022, Manuscript No. JCTR-22-16060(R); Published: 28-Mar-2022 , DOI: 10.35248/2167-0870.22.S16.003
Copyright: © 2022 Cao L, et al. This is an open access article distributed under the terms of the Creative Commons Attribution License, which permits unrestricted use, distribution, and reproduction in any medium, provided the original author and source are credited.