Journal of Horticulture
Open Access
ISSN: 2376-0354
ISSN: 2376-0354
Research Article - (2014) Volume 1, Issue 3
Two experiments, one in Open Field (OF) and the other inside a Greenhouse (GH), were conducted at Al-Jubeha Agricultural Research Station –The University of Jordan, to study the effect of Treated Wastewater (TWW) on soil chemical and physical properties. It was also intended to find the effect of TWW on spike quality of gladiolus. Five water treatments were used for both experiments, T1:100% Potable Water (PW); T2:100%TWW; T3:25%PW+75%TWW; T4:50%PW+50%TWW; and T5:75%PW+25%TWW. The design for both experiments was Randomized Complete Block Design (RCBD). The results in both experiments showed high accumulation of salts in soils for all treatments with the highest accumulation values in soil T2. Soil organic matter (OM) and N were reduced after planting for all treatments in the GH treatments, but OM remained almost the same in the OF treatments. There was an increase in Zn, Pb, and Cu microelements in soils for all treatments. Soil physical properties such as aggregate stability was reduced for all treatments significantly after planting by about 40% for the GH treatments, and non-significantly by about 3-12% for the OF treatments. Soil water retention curve and pore size distribution did not significantly change after planting for the soil for all treatments in both experiments. Plant properties, from both experiments, were affected by TWW irrigation. Parameters such as: spike length, spike diameter, corm size, number of florets per spike, and the number of cormels per corm were found to be affected by water treatments.
It gave the worst quality for plants that irrigated with 100% TWW for both experiments. Based on results obtained from both experiments, it was found that soils were affected negatively by TWW irrigation for their chemical and physical properties. Use of TWW when mixed with some PW for irrigation of non-edible plants such as cut flowers gave better results than using PW alone.
<Keywords: Treated wastewater; Potable water; Aggregate stability; Soil water retention curve; Pore size distribution curve; Gladiolus; Spikes; Corms; Cormels
The Hashemite Kingdom of Jordan is an arid to semi-arid country, with a land area of approximately 89 thousand km2. Jordan has been experiencing an imbalance in the population-water resources equation. The greatest environmental challenge that Jordan faces today is considered to be the scarcity of water. Whereas water resources in Jordan have fluctuated around a stationary average, the country's population has continued to rise due to the sudden influx of immigrants from neighboring countries due to wars. Current use of water in Jordan already exceeds renewable supply. The deficit is covered by the unsustainable practice of over drawing from the highland aquifers, resulting in lowering water tables and declining quality [1]. Approximately, seventy percent of world water use including all the water diverted from rivers and pumped from underground is used for irrigation, so that the reuse of Treated Municipal Wastewater (TWW) for purposes such as agricultural and landscape irrigation reduces the amount of water that needs to be extracted from natural water sources as well as reducing discharge of WW to the environment [2]. The reuse of treated wastewater for irrigation is a valuable strategy to maximize available water resources, but the quality of this water can present agricultural challenges [3].
Varieties of crops are grown using irrigated wastewater including citrus, vegetables, field crops, bananas and cut flowers. The global flower industry is currently an important sector in the world's economy. The Jordanian cut flower industry even with its small size has several advantages from its geographical location to the environment aspects. This sector is relatively new and continues to develop.
Gladiolus of the iridaceae is represented by 180 species. It is found throughout Africa and the Mediterranean area, with the greatest concentration in southern Africa [4]. They are used as landscape plants at home garden, as specimen for exhibition, and mainly as cut flowers. The gladiolus corm lives for one year only, but a new corm is formed each year on top of the old one. Little research was done in production of cut flower using TWW irrigation. However, reuse of TWW may potentially have adverse impacts on the environment and the public health depending on TWW characteristics. Moreover, it is important to evaluate the effects of reuse of TWW on soil properties. Rusan et al. [5] evaluated the effect of TWW irrigation of cut flower on plant growth and soil and plant quality parameters. The plants were irrigated with Fresh Water (FW) or with TWW at three irrigation frequencies. The EC values for FW and TWW were 1.05 dS/m and 3.27 dS/m, respectively. Also, Na content was 200 ppm for FW and 434 ppm for TWW. The results indicated variation in soil salinity and other chemical properties with TWW irrigation. Yield responded positively to the TWW irrigation with no negative impact on the quality of the produce. Roses have tolerated the salinity induced by the highest TWW rates and produced a good yield with an acceptable quality level. Nirit et al. [6] investigated the effect of irrigation with TWW on roses yields and quality cultivated in two soil-less medium, perlite, an inert mineral medium and choir (coconut fibers), an organic medium of high ion absorption capacity. Water treatments used in the experiment were Potable Water (PW) and TWW. The EC for water treatments are 1.15 dS/m and 2.5 dS/m respectively. During 12 months of irrigation using TWW, the visible appearance of the plants, their growth, the quantity and size of the flowering stems were not affected by the irrigation treatments. Friedman et al. [7] also examined the effects of two types of irrigation water on the chemical composition of soil and leaves, flower yield and postharvest performance. They used PW and TWW with EC equal to 0.6 dS/m for PW and 7.8 dS/m for TWW. Also, TWW used in the experiment contained 450 ppm Cl, 300ppm Na. The results demonstrated a higher accumulation of Cl, Na, B, and NO3- in soils irrigated with effluents as compared to PW. Also, the results demonstrated that in both types of flowers, boron accumulated to higher levels in leaves of plants irrigated with effluents. Al-Hamaiedeh and Bino [8] studied the impact of treated Grey Water (GW) reuse for irrigation on some chemical properties of the irrigated soil and plants. Water had EC ranged from 1.46 to 1.91 dS/m and total N ranged from 8 to 14 ppm. The results showed that after exposing the soil to GW irrigation for about six months months, salinity, and Sodium Adsorption Ratio (SAR), of soil had increased as a function of time for about 1.83 dS/m and 3.04, respectively. So, this research evaluates the short-term influence of TWW on some soil chemical and physical properties. Also, the research intends to study the yield and quality of Gladiolus communis, a high value cut flower, under irrigation with TWW.
Experiments site
The experiments were conducted at Al-Jubeha Agricultural Research Station that located at the campus of the University of Jordan, Amman, Jordan. The location has an elevation of 991 m above sea level, and it is at 35.873o E longitude and at 32.012o N latitude. The location is characterized by semi-arid climate with warm summers and cold winters with long-term mean annual precipitation about 492.8 mm. Amman has moderate summers with high temperatures, ranging from 25°C to 33°C usually with low humidity. The winter season in Amman is relatively short (December - Febuary) and cold.
Experimental design
The experiments were conducted in two sites inside the Greenhouse (GH) and at the Open Field (OF). The experimental design in both sites was Randomized Complete Block Design (RCBD). In the GH experiment (winter season), the corms were planted in pots with 35 cm height, 30 cm upper diameter, and 20 cm the lower diameter. Ten pots were used for each treatment in each block. In the OF experiment (summer season), the field was divided into three blocks where each block represented a replicate with dimension of 3.60 m by 1.35 m. In each block, there were five rows representing five water quality treatments. Each row is 1.35 m long and 20 cm width. Planting space between corms was 15 cm. So, each row in each block had 10 corms. The replicates were 1.0 m away from each other. Each treatment was 50 cm away from the other treatment within the same block. Five water quality treatments were used in the experiment conducted as follows: 100% Potable water (T1); 100% Treated wastewater (T2); Mixing 25% PW+75%TWW (T3); Mixing 50% PW +50% TWW (T4); Mixing 75% PW+25% TWW (T5).
Preparing the soil before planting
For GH experiment, all pots were filled with soil from Al-Jubeha Agricultural Research Station and distributed randomly in the greenhouse. For OF experiment, the land was prepared firstly by primary and secondary tillage. Then, boundary of the field that would be used was defined. The soil was saturated with fresh water and let to filtrate for 48 hrs in order to fix the moisture content of the soil. After that, the rows were prepared with 20 cm width and 1.35 m length. The distance between rows was 50 cm and between blocks was 1.0 m. The rows then were covered with black plastic mulch. Soil samples were randomly collected from the OF and GH for physical and chemical analysis.
Irrigation method
The soil water content was controlled in both experiments by monitoring soil moisture with Hydra Probe soil sensor (Stevens hydra probe II, Water Monitoring System, Inc.). The probe was inserted in each treatment row in each block at a depth from 0-10 cm and the moisture level was measured directly as an average of three readings for each treatment. Soil moisture was kept at Field Capacity (F.C). So, daily measurements of water content were taken. The irrigation frequency were twice a week at GH experiment (winter season), and three times in a week at OF experiment (summer season). The F.C was estimated before planting by saturating the soil at different pots for the GH experiment, and different locations in each block in the OF, then, by letting it to drain for 24 hours, and then measuring the moisture content at 10 cm average depth. Water content at F.C and other soil physical properties for both experiments are shown in Table 1.
| Experimental | GH experiment | OF experiment |
|---|---|---|
| location | ( winter season) | ( summer season) |
| θ F.C (cm3/cm3) | 0.48 | 0.44 |
| Sand (%) | 13.8 | 33 |
| Silt (%) | 48 | 29.3 |
| Clay (%) | 38.2 | 37.7 |
| Bulk density (g/cm3) | 1.19 | 1 |
Table 1: Soil moisture content at F.C and other soil physical properties
for both locations.
The volume of water needed for irrigation was measured by subtracting the current water content from water content at F.C and multiplying it by the soil volume as follows:
Planting
The corms that were used in the experiments were brought from the available cultivars in the market. White Purity cultivar for both experiments was used. The average diameter of ten corms was measured by Vernier caliper before planting in order to compare the newly produced corms from the experiments which were 2.86 cm. a corm, for each pot used. The corms were planted at depths equal to twice of its height, (at a depth of 8 cm). Planting date for the GH experiment (winter season) was on October 18, 2011. The plants took 4 months to produce flowers. Planting date for the OF experiment (summer season) was on April 9, 2012. The plants took 3 months to produce flowers.
Water analyses
The TWW was brought from Baqa′a wastewater treatment plant which is wastewater treated through biological filters, and maturation ponds, thus allowing for effluent reuse. TWW was stored in a storage tank for both experiments. The mixing of TWW with PW was manually, and then the mixed water was stored in containers. The mixture was shaken before each irrigation event. Water analyses were done to determine their effects on soil properties and plants production and quality. Average BOD concentration of the treated wastewater was brought from the treatment plant and it was 32 mg/l in the bringing time. This value is exceed the allowable limit for flower planting Water samples were analyzed for the following parameters since there are many literatures that discuss the effects of these parameters on flower growth and quality: pH, EC, Ca, Mg, Cl, Na, K, N, P, Fe, Zn, Cd, Mn, Pb and Cu. The pH and EC were measured directly by pH/mV meter (UB-10, Denver instrument. Ultra Basic) and professional Benchtop Conductivity meter (BC3020) .Ca and Mg were measured by titration using EDTA method. Sodium and K were measured directly by Flame Photometer (JENWAY PFP7). Chloride was determined by titration with silver nitrate. N determination was done by Kjeldahl method. Total P was determined by ascorbic acid spectrophotometric method (Spectro 2000 spectrophotometer. Labomed.inc.). Zn, Cd, Pb, Fe, Mn, and Cu were determined by Atomic Absorption Spectrometer (AAnalyst 700, Perkin Elmer instruments). All water analyses were done according to Clesceri et al. [9].
Soil analyses before and after planting
The following properties were determined for the soil before and after irrigation with TWW for both locations: pH, EC, organic matter content, aggregate stability, and pore size distribution. Also, the macro and micro elements contents determined in the soil were: N, P, K, Mg, Na, Ca, Cu, Cd, Fe, Zn, and Mn. Soil water characteristic curve was determined to monitor the effects of TWW on pore size distribution. Soil texture was measured by pipette method according to Day, (1965) [10,11]. Bulk density was measured by core method (in pots that not planted) for the soil after saturated for 24 hours with water according to Blake [6]. It was measured at a depth of 15 cm from the surface. Aggregate stability was measured by wet sieving method to determine Mean Weight Diameter (MWD) by Angers and Mehuys [12]. Soil moisture characteristic curve was estimated for the soil by using ceramic plate extractor (CAT. #1500) according to Richards [13]. Pores were classified according to their size to: macropores with size greater than 1000 μm, mesopores with size between 10-1000 μm; and micropores with size less than 10 μm [14]. Pore size distribution curve was constructed by firstly measuring the slopes at soil moisture versus soil moisture tension, and then plotted the reciprocal of the slope as a function of pore radius. Preparation of soil paste extract for chemical analysis was done. The extract was saved for the determination of soluble cations, anions, pH, and electrical conductivity. pH was measured directly by pH/mV meter (UB-10. Denver instrument. Ultra Basic) according to Peech [15], and EC by Professional Benchtop Conductivity meter (BC3020) according to Bower and Wilcox [16]. Sodium and, potassium were measured directly by flame photometer (JENWAY PFP7) according to Pratt [17]. Chloride was determined by titration with silver nitrate according to Adriano and Doner [18]. Total N determination was done by Kjeldahl method according to Bremner [19]. Available P was determined by ascorbic acid spectrophotometric method (Spectro 2000 spectrophotometer. Labomed.inc.) according to Olsen et al. [20]. Organic matter in the soil was determined by wet combustion method as described in Nelson and Sommers [21]. Microelements contents were determined by Atomic Absorption Spectrophotometer (AAnalyst 700, Perkin Elmer instruments) according to Liang and Karamanos [22].
Yield and quality parameters data analyses
Flower production (spikes) and quality were tested in these two experiments. To test the effect of TWW on flower production, total yield represented by the number of spikes per corm was recorded at harvest. Samples of spikes were taken in order to measure the effect of TWW on flower quality. Three random samples were collected from each treatment. In order to fix the place of cutting the spike, each spike was cut from below the fourth leaf, so each spike had 4 leaves for the nutrition of the newly formed corm. Different quality parameters were measured in these samples such as: spike length, spike diameters, floret length, floret diameters, floret number for each spike, shelf life of spikes, floret color, floret shape, new corms diameter and the number of newly formed cormels per corm. Spike and floret length were measured directly by using the ruler. The spike length was measured from the bottom to the top of the spike. Measurement for floret length was taken on the floret that shows color. Spike, floret and new corm diameter were measured by using Vernier caliper. Spike diameter was measured from three places and the average of the three readings for each spike was taken. The measures were taken from the bottom, below the first floret, and the upper portion of the spike. The measurement of floret diameter was taken in the middle of the floret that was showing color. Floret number per spike and the number of newly formed cormels were measured by direct counting. Shelf life of the spike was measured by taking the spike and placing it in flasks filled with tap water and counting the days needed for the spike to wilt. In order to fix this parameter, the period from the cutting time until no floret would be opened was measured. Floret color and shape were measured by direct observation, and differences in color and shape between treatments as compared to control, were studied.
Data Statistical Analyses
Both experiments were RCBD design. Three blocks (replicates) were used. Each block contains all treatments used in both experiments. For soil analysis, the 3 replicates (blocks) were taken, and statistically analyzed using SPSS program. For plant analysis, 3 replicates (blocks) were taken, and statistically analyzed using SPSS plate form (IBM SPSS Statistics 21). The comparisons among treatments were based on Duncan Multiple Range Test (DMRT) for the 0.05 p level.
Water analyses
The results of water analyses throughout both seasons are presented in Table 3.Water treatments analyses showed that water treatments differ in EC, Na+, K+, Cl-, N, and total P contents. This was expected since treated wastewater had higher concentration of salts, N, and P. Therefore; any change in plant quality parameters or soil properties will be attributed to these properties. Technical regulation for reusing of TWW in agriculture was used to compare with the quality of used TWW in the experiments and it was as follows: pH changes with time and ranged between 7 and 8 for all treatments. EC varied from 1 to 2 dS/m and it is within the acceptable range. Ca, Mg, and total N concentrations were lower than the highest acceptable values. Na, Cl, and total P concentration were higher in T2 treatment than the highest acceptable value. K was higher in T2 treatment, it reached to 42 mg/l. All microelements content were lower than the higher values that are acceptable except for Cd which was higher than the acceptable value. All standard values obtained from The Institution for Standards and Metrology, Water- Reclaimed domestic wastewater, Technical Regulation, 3rd edition, JS 893/2006 [23]. Average BOD value was 32 mg/l and it is higher than the acceptable value which is 15 mg/l. In the GH experiment, the planting date was in winter, so, less evapotranspiration is expected. Also, the experiment was conducted at GH, so, temperature and moisture were controlled. In the OF experiment, planting date was in summer, more evapotranspiration was expected. Higher temperature, less humidity, and wind effect, all increased water requirement by plants. Growth stage had played a role in determination of water requirement for both experiments. Initial stage consumed less water than other stage since plant was too small. For development and harvesting stage, water consumption by plant increased rapidly. For late stage, irrigation was reduced and stopped for the last two weeks to dry plant and to collect corms.
| GH experiment | OF experiment | ||
|---|---|---|---|
| Months | Amount of water (liter/plant) | Months | Amount of water (liter/plant) |
| October | 1.8 | April | 1.92 |
| November | 2.94 | May | 3.8 |
| December | 3.62 | Jun | 7.77 |
| January | 6.4 | July | 6 |
| February | 2 | ||
| Total | 16.76 | Total | 19.49 |
Table 2: Average amounts of water consumed by each plant in both experiments. BOD level during the experiment = 30-35 mg/L.
| Treatments | pH | EC | Ca+2 | Mg +2 | Na + | K+ | Cl - | N | P-Total | Zn | Fe | Cd | Mn | Cu | Pb |
|---|---|---|---|---|---|---|---|---|---|---|---|---|---|---|---|
| T1 (PW) | 8.1 | 1.032 | 52 | 29 | 143 | 11 | 248 | 3 | 2 | 0.33 | 0.37 | 0.03 | 0.05 | 0.03 | 0.07 |
| T2 (TWW) | 7.7 | 1.952 | 55 | 34 | 292 | 42 | 447 | 9.7 | 235 | 0.97 | 0.17 | 0.05 | 0.09 | 0.06 | 0.14 |
| T3 (0.25PW+0.75TWW) | 7.7 | 1.724 | 54 | 32 | 258 | 37 | 375 | 6.3 | 176 | 0.67 | 0.19 | 0.04 | 0.07 | 0.05 | 0.12 |
| T4 (0.50PW+0.50TWW) | 7.6 | 1.505 | 53 | 34 | 222 | 30 | 345 | 4.2 | 108 | 0.62 | 0.25 | 0.04 | 0.06 | 0.04 | 0.12 |
| T5 (0.75PW+0.25TWW) | 7.8 | 1.269 | 55 | 30 | 183 | 22 | 300 | 5.2 | 47 | 0.46 | 0.29 | 0.04 | 0.06 | 0.04 | 0.1 |
| *Standard values | 41799 | - | 230 | 100 | 230 | - | 400 | 70 | 30 | 5 | 5 | 0.01 | 0.2 | 0.2 | 0.2 |
Table 3: Average water treatments quality data for both experiments. *All standards values are presented in the institution for standards and metrology, Water Reclaimed domestic wastewater No.893/200.
Soil physical properties
Soil used in GH experiment was silty clay loam, whereas for OF, it was clay loam. Many soil physical properties have changed due to the different water treatments which had affected them. Change in aggregate stability before and after planting for GH and OF experiments is shown in Figure 1. Aggregate stability was changed at both experiments. No significant differences in aggregate stability was observed among treatments in the OF treatments. Whereas aggregate stability was reduced by 40% in all treatments after planting in the GH experiment. Reduction in soil OM would deteriorate the soil structure, since OM acts as a cementing agent in the soil, and leads to soil aggregate formation. So, as result, soil aggregate stability would be reduced for all treatments in GH experiment since OM reduced for all treatments. In OF experiment, OM was slightly and not significantly changed in the soils from all treatments. So, aggregate stability would not be changed significantly. These results obtained were agreed with who they found that reduction in soil organic matters reduce aggregate stability in soils [24]. Increasing Na content of the soil would increase SAR of the soil to about 7.3 in GH experiment, and for about 6 in OF experiment. This leads also to deterioration of the soil structure and aggregate stability. Since Na had relatively large size, single electrical charge, and hydration status, it tends to cause dispersion of soil particles. Since we have single effect of Na in the soil structure stability in OF experiment, aggregate stability was reduced in OF experiment lesser than GH experiment, whereas in GH experiment, it has lead to higher SAR and OM reduction. Results from this study agreed with findings from Nikos et al. [25]. Ca and Mg had significantly accumulated in the soil for all treatments, with the largest accumulation for T2 treatment. Ca: Mg ratio was slightly increased for all treatments. Ca has a flocculation effect in the soil whereas Mg has an inverse effect. So, increasing Ca:Mg ratio improves soil structure and aggregate stability [26]. Results from this study show dispersion of the soil since Na accumulate greater than Ca.
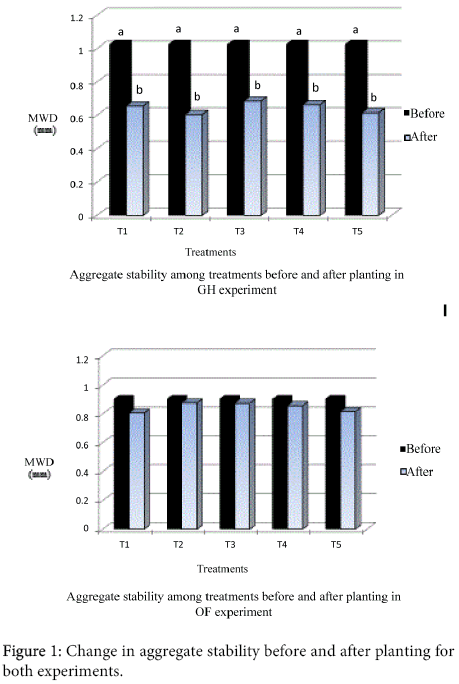
Figure 1: Change in aggregate stability before and after planting for both experiments.
Change in soil moisture characteristic curve before and after planting for GH and OF experiments is shown in Figure 2. Soil moisture characteristic curve is affected by many factors such as texture, structure, clay content, and organic matter content in the soil, as described in Lipsius [27]. The presence of organic matter contributes to the retention in soil water and it increases it [28]. Na content in soil also affects soil water retention. Increase of Na content in soil would increase dispersion of the soil and would decrease soil moisture retention of the soil. No significant differences in soil water retention curve after planting was found to occur between treatments for both experiments. Pore size distribution curve for GH and OF experiments were plotted in Figure 3. Pore size distribution curve were not changed significantly between treatments. Pore size was mainly at the micropores range, before and after planting, for all treatment in both experiments. It showed a maximum distribution at r = 0.0973 µm and less.
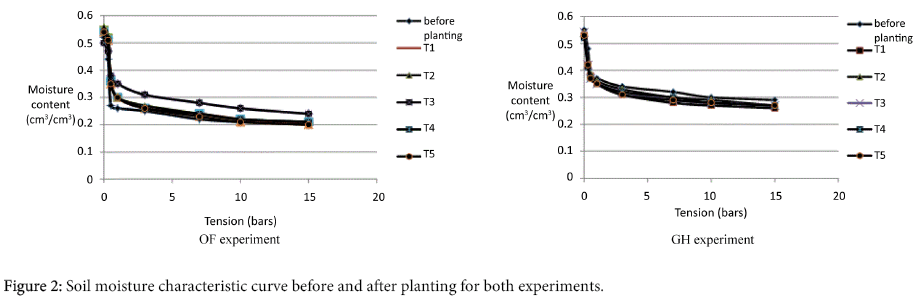
Figure 2: Soil moisture characteristic curve before and after planting for both experiments.
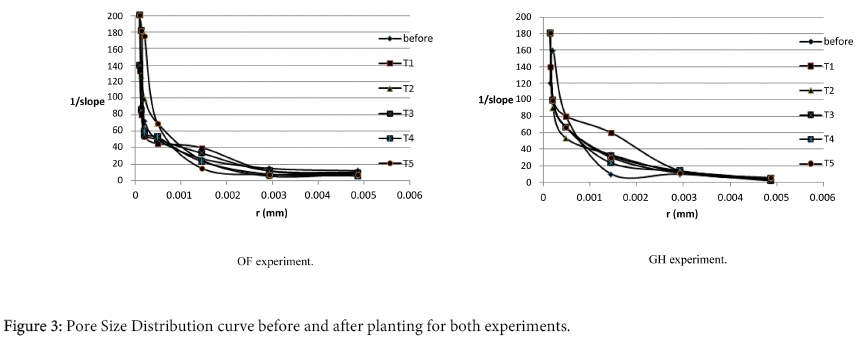
Figure 3: Pore Size Distribution curve before and after planting for both experiments.
Soil chemical properties
Soil chemical properties before and after planting are presented in Table 4 for GH and OF experiments. Soil microelements content before and after planting was presented in Table 5, for GH and OF experiments. Soil salinity increased significantly for all treatments for both experiments after planting with the highest value for TWW treatment. This was expected since TWW had high salts content .As a result, soil Na, Ca, Mg, and K increased for all treatments with the highest concentration for TWW irrigation treatments.
| GH experiment | |||||||||||
|---|---|---|---|---|---|---|---|---|---|---|---|
| Treatments | OM (%) | N (%) | P (mg/kg soil) | pH | EC (dS/m) | (mg/100 g soil) | |||||
| Ca+2 | Mg+2 | Na+ | K+ | Cl - | SAR | ||||||
| Before planting | 1.86 a | 0.93a | 4.70 c | 7.7 | 0.99 d | 5.96 d | 1.76 c | 02.30 d | 0.36 bc | 20.41 d | 1.07d |
| T1(control) | 1.53b | 0.48 b | 7.41 abc | 7.4 | 3.96 c | 18.92 c | 6.16 b | 16.06 c | 0.24 c | 75.34 c | 4.15c |
| T2 | 1.53b | 0.54b | 9.69 a | 7.3 | 9.50 a | 46.07 a | 10.59 a | 42.72 a | 0.60 a | 156.60 a | 7.31a |
| T3 | 1.51 b | 0.53 b | 8.64 ab | 7.5 | 8.24 a | 39.52 a | 9.06 a | 40.23 a | 0.52 ab | 145.61 ab | 7.43a |
| T4 | 1.50 b | 0.49 b | 6.70 abc | 7.3 | 6.23 b | 30.39 b | 6.25 b | 27.50 b | 0.33 c | 111.94 bc | 5.85b |
| T5 | 1.49 b | 0.60 b | 5.92 bc | 7.5 | 4.25 c | 20.53 c | 5.04 b | 17.90 c | 0.27 c | 81.22 c | 4.56c |
| OF experiment | |||||||||||
| Before planting | 2.39 | 0.52 a | 27.28 c | 7.4 | 0.718 c | 03.31 b | 2.09 | 1.52 d | 0.66 b | 14.59 b | |
| T1(control) | 2.47 | 0.19 b | 161.24 b | 7.7 | 2.34 b | 08.49 ab | 3.5 | 6.83 b | 1.81 a | 32.59 a | 4.04 b |
| T2 | 2.43 | 0.19 b | 265.85 a | 7.7 | 4.68 a | 12.70 a | 5.12 | 10.87 a | 2.43 a | 38.20 a | 6.45 a |
| T3 | 2.92 | 0.19 b | 206.55 b | 7.6 | 3.64 a | 11.08 a | 3.44 | 9.53 b | 2.29 a | 35.80 a | 5.61 b |
| T4 | 2.52 | 0.23 b | 186.56 b | 7.6 | 3.80 a | 12.67 a | 3.84 | 10.49 bc | 2.26 a | 35.27 a | 5.23 bc |
| T5 | 2.51 | 0.15 b | 168.57 b | 7.6 | 3.43 ab | 12.67 a | 4.31 | 9.14 c | 2.12 a | 31.14 a | 4.35 c |
Table 4: Soil chemical properties before and after planting for both experiments. Along columns, means followed by the same letter are not significantly different at 0.05 p level, as obtained from DMRT.
| GH experiment | OF experiment | |||||||||||
|---|---|---|---|---|---|---|---|---|---|---|---|---|
| Concentration (ppm) | ||||||||||||
| Treatment | Zn | Mn | Cd | Pb | Fe | Cu | Zn | Mn | Cd | Pb | Fe | Cu |
| Before planting | 1.50 c | 2.53 a | 0.15 b | 0.00 b | 1.68 | 1.46 c | 3.34 | 4.11 a | 0.23 | 0.00 b | 1.96 | 1.31 b |
| T1(control) | 3.80 a | 1.46 bc | 0.21ab | 0.85 a | 1.6 | 1.71 a | 3.92 | 2.23 c | 0.25 | 0.67 a | 2.22 | 1.78 a |
| T2 | 2.66 b | 1.88 abc | 0.23 a | 0.90 a | 1.44 | 1.59 ab | 3.4 | 3.24 bc | 0.25 | 0.81 a | 2.17 | 1.99 a |
| T3 | 3.14 ab | 2.29 ab | 0.24 a | 0.96 a | 1.39 | 1.56 bc | 3.85 | 2.79 bc | 0.24 | 0.74 a | 2.29 | 1.97 a |
| T4 | 2.75 b | 1.16 c | 0.23 a | 0.91 a | 1.41 | 1.45 c | 3.72 | 2.74 bc | 0.26 | 0.81 a | 2.36 | 1.94 a |
| T5 | 2.51 b | 1.14 c | 0.24 a | 0.98 a | 1.37 | 1.54bc | 4.03 | 3.38 ab | 0.27 | 0.90 a | 2.61 | 1.94 a |
Table 5: Soil micro elements content before and after planting for both experiments. Along columns, means followed by the same letter are not significantly different at 0.05 p level, as obtained from DMRT.
Soils from T2 treatments in GH and OF experiments became saline soils. Classification of soils to saline or sodic soils was reported in Troeh et al. [29]. Soil from T2 treatment is significantly differing in Na contents for both experiments. Soils from all treatments were significantly different in K, Ca, Mg, and Cl- content in GH experiment and give the largest value for soil T2, but it did not significantly differ in OF experiment. All accumulations were expected since the amount of water applied in the time of irrigation was measured to reach F.C of the soil. So, no excessive amount of water was applied, and thus, water was not leached below the root zone.
Soil moisture was kept at F.C in order to study the maximum accumulation of salts in the soil. Also, the increasing percentage of salinity in GH experiment was greater than OF experiment, and this was because in GH experiment, the volume of soil was limited and each plant was isolated in pot from other plant in the same treatment, so, overlapping did not occur for applied water. But in OF experiment, all plants were planted in the same row, so, overlapping occurred which led to little leaching. As results, accumulation of salts in GH experiment was greater than OF experiment. Galavi et al. [30], Parvan and Danesh [31], Rusan et al. [32], Klay et al. [33], Herpin et al. [34], Arienzo et al. [35], and Kiziloglu et al. [36] found that application of TWW for irrigation would increase salts content and Ca, Mg, Na, K, and Cl content in the soil and therefore, results from this study agreed with their findings. There was a reduction in soil organic matter and N% among all treatments in GH experiment after planting. This was expected since no fertilizers were added to the soil. Application of TWW and the conditions such as temperature and humidity in GH encouraged microbial activity for N mineralization causing significant decrease of soil OM [34]. But in OF experiment, there was no change in soil organic matter and reduction in soil N percentage. This result agreed with Jueschke et al. [37], and did not agree with Rusan et al. [32], Kiziloglu et al. [36], and Galavi et al. [30]. P increased after planting in GH experiment but it was not significant. In OF experiment, it was significantly increased. This is expected also, since TWW has higher concentration of P than in the PW. Accumulation of P was greater in OF experiment and this may resulted from Ca and Mg accumulation since P was fixed by Ca and Mg carbonate in the soil. Accumulation of Ca and Mg in GH experiment was greater than OF experiment, P may have fixed by Ca and Mg carbonate in GH experiment. Ahmad and Al-Hajri, [38], Galavi et al. [30], Parvan and Danesh [31] found the same results. Results in soil microelements analyses for GH experiment showed that there were significant increases in Zn, Mn, Cd, Pb, and Cu among all treatments, but no change in Fe concentration among treatments. Results in soil microelements analyses for OF experiment showed that significant increases in Mn, Pb, and Cu. These results were expected since TWW had certain concentrations of these elements as described in Table 3. Water and soil pH would limit the availability of microelements and will reduce accumulation in the soil. The same results were reported in Koupai et al. [39]. Zn, Fe, Cd, Mn, and Pb were not significantly changed. In OF experiment, all results are more variable than GH experiment, and this is attributed to spatial variability in the field which is not present in GH experiment.
Plant analyses
Spike quality parameters are presented in Table 6 for GH and OF experiments. Spike quality parameters were studied in order to measure the effect of TWW on their quality. Production did not change for all treatments; each corm gave one spike for all treatments in both experiments. Spike length for both experiments gave the lowest value for T2 (TWW). Salt content in water could have effects on the development of Gladiolus. The presence of high Na and Cl in water could have affected plant development. It is known that Gladiolus is sensitive to salt. High concentration of salts delayed root growth because it reduces plant ability to absorb water, and this could have affected spike length later. Also, the presence of K in water and its accumulation in soils could have also an effect on spike length. There was accumulation of K in soils after TWW irrigation, but it reduces the length of the spike. K may increase the length of spikes to a certain level then it reduces it. P affected spike length also. Increasing P content would increase spike length for the flower to a certain limit. These results agree with (Lehri et al. [40], Yousif and Mahmoud [41] and Butt [42]. Some microelements content could have an effect on spike length. Zn and Cu in GH experiment had increased significantly and may have increased spike length. The results agree with Halder et al., [43]. Spike diameters for both experiments were also affected by water treatments. T2 gave the lowest one. Corm size was affected by the presence of microelements content. Increasing Zn, and Cu increased corm size significantly, and this agreed with Singh et al. [44] and Halder et al. [45]. Floret number per spike was affected significantly by water treatment for OF experiment. The number of florets was affected by many parameters such as N, P, K, and Zn. N deficiency may reduce the number of floret. Increasing P reduce the number of floret which is not agreed with Lehri et al. [40] and Zubair et al. [46]. Zn application to the soil would increase the number of floret per spike and this agreed with Halder et al. [45]. Numbers of cormels per corm also were affected significantly for both experiments. T2 gave the least number of cormels per corm for both experiments. Increasing K and P would increase the average number of cormels per corm. Zubair et al. [47,48] in two expirements, Lehri et al. [40], and Yousif and Mahmoud [41], were agreed with obtained results. Some microelements content also have an effect to the number of cormels per corm, they are expected to increase the number cormels to certain limit then decrease it. Increasing Zn, Fe, and Cu would increase the number of cormels per corm. Singh et al. [44] and Halder et al. [45] in two experiments were agreed with results obtained. Floret color and shape measured in this study by direct observation and found no differences in floret color and shape between treatments for both experiment. Other quality parameters such as shelf life, floret length, and floret diameter were not changed significantly for both experiments.
| GH experiment | ||||||||
|---|---|---|---|---|---|---|---|---|
| Treatment | Spike length (cm) | Spike diameter (mm) | Spike shelf life (days) | Floret number/spike | Floret length (cm) | Floret diameter (cm) | Newly formed corms size (cm) | Number of cormels/corm |
| T1(control) | 104.9 bc | 8.23 a | 9 | 13 | 1.24 | 1.24 | 4.99 a | 53 b |
| T2 | 102.7 c | 7.60 c | 10 | 13 | 1.26 | 1.26 | 4.76 b | 53 b |
| T3 | 108.7 ab | 8.00 ab | 10 | 13 | 1.28 | 1.28 | 4.77 b | 72 a |
| T4 | 106.1 bc | 7.87 bc | 10 | 13 | 1.28 | 1.28 | 4.96 a | 65 a |
| T5 | 111.9 a | 8.10 ab | 9 | 13 | 1.26 | 1.26 | 4.98 a | 63 ab |
| OF experiment | ||||||||
| T1(control) | 86.63 a | 8.00 a | 7 | 13 a | 6.47 | 1.31 | 2.71 a | 0.291666667 |
| T2 | 71.4 b | 6.90 b | 7 | 11 b | 6.53 | 1.32 | 1.94 b | 2 b |
| T3 | 86.8 a | 8.10 a | 7 | 14 a | 6.5 | 1.37 | 2.69 a | 0.25 |
| T4 | 84.77 a | 7.80 a | 7 | 13 a | 6.33 | 1.32 | 2.56 a | 6 ab |
| T5 | 85.27 a | 7.90 a | 7 | 13 a | 6.57 | 1.38 | 2.55 a | 5 ab |
Table 6: Spike quality parameters for GH and OF experiments. Along columns, means followed by the same letter are not significantly different at 0.05 p level, as obtained from DMRT.
The present study evaluates the effect of TWW on soil physical and chemical properties, and on spikes production and quality parameters. Based on the obtained results, the main conclusions are:
Soils were affected by TWW irrigation chemically and physically since no leaching requirements were added. Ca, Mg, Na, K, and Cl contents were increased when TWW was used. The maximum accumulations occurred for soils that were irrigated with 100% TWW. Soil physical properties such as aggregate stability were affected by TWW irrigation. TWW if mixed with PW in ratios 50%TWW+50%PW, and 25%TWW+75% PW gave results for plants quality better than 100% TWW.
Based on results obtained from both experiments, it is recommended to do the following:
• Use TWW mixed with some PW for irrigated non-edible plants such as cut flowers that have high value crops instead of using PW.
• Since the level of BOD concentration exceeded the maximum allowable limit that was identified in JS 893/2006, it is recommended to use T4 (50% TWW+50%PW), and T5 ( 25%TWW+75%PW) dilutions to reduce the BOD concentration to the allowable limit, which is 15 mg/l.
• More research is needed to define the exact effect and applicability of TWW reuse for high value crops since different WW resources of different properties might lead to different results.
• Further research is recommended to carry out cost/benefit analyses based on production and quality of plants, in addition to the cost of water.