Journal of Pollution Effects & Control
Open Access
ISSN: 2375-4397
ISSN: 2375-4397
Research Article - (2014) Volume 2, Issue 2
This article presents the results on the volatilization of the volatile organic pollutants (VOP) during decontamination process from the soil. The choice of TCE as a volatile organic pollutant is explained by the fact that it is relatively highly soluble in water, compared to other compounds, which excludes any possibility of adsorption of its vapors on the walls of the experimental device during testing. Its saturation vapor pressure very high (≈7700 Pa at 20ºC and nearly 12,000 Pa at 30ºC) facilitates its monitoring using a pressure transducer relatively less accurate and less expensive. The results obtained on the evaporation of TCE show a linear dependence with the pressure. The coefficient of volatilization is 3.2 times greater for an atmospheric pressure of 90 kPa than for a pressure of 100 kPa. This coefficient would be multiplied by 20 when the pressure passes from 100 kPa to 10 kPa.
Keywords: Soil; Volatile organic pollutant; Evaporation; Ambient pressure; Trichloroethylene
m1 Mass of the compound in compartment 1 (kg)
m2 mass of the compound in compartment 2 (kg)
S upper base surface of the sample (m2)
ρv density of the vapor of the compound (kg.m-3)
Mv molecular weight of the vapor of the compound (kg.mol-1)
Pv pressure of the vapor of the compound (Pa)
R ideal gas constant (J.mol-1.K-1)
T temperature of the medium (K)
h1 height of compartment 1 (m)
h2 height of compartment 2 (m)
?g volume fraction (/)
L volatilization coefficient of the compound (kg.K.s.m-5)
Pveq equilibrium vapor pressure of the compound (Pa)
The description of the transfers of Volatile Organic Pollutants in the soil is an essential step for the scientific community concerning the resolution of problems related to environmental sciences [1]. However, the prediction of the phenomena involved in the transfer of a pollutant in soil is very difficult because several processes nonlinear and coupled occur in a multiphase medium which can deform, and where the fluids content can vary with time and space. Accordingly, any model that aims to describe and to predict the dynamic behavior of a VOP in the soil in order to better track its migration during a decontamination process must be preceded by an investigation in laboratory to determine the essential parameters involved in the phenomenon [2].
Recent studies realized on volatile compounds were made and showed that when the liquid content of soil is far from saturation, hygroscopic effects can modify not only the equilibrium between phases, but also the kinetics of phase change so that in these conditions the main parameters to take into account are primarily capillary forces, gravitational forces and the transfers by phase change [3,4]. In such conditions, the description of transfer mechanisms must include phase change in order to better evaluate the evaporation flux of the compound.
One of today’s environmental problems concerns the technologies of remediation of contaminated soils [5]. In soil, the properties of a compound can be modified by the interfaces liquid/gas and liquid/ solid [6]. This change is even greater when the solid phase of soil is fractionated and contains organic matter [7].
The main question in this paper is whether the thermodynamic equilibrium between the liquid phase of a compound and its gas phase are modified in soil? Literature data indicate that Relative Humidity of soil has an important role on sorption of the vapour of any organic compound [1,5,6,8-11] and can reduce about 2 time the sorption capacities [12]. At about 90% of Relative Humidity, Chiou and Shoup [12] show that sorption capacities of organic compounds such benzene, chlorobenzene, p-dichlorobenzene, m-dichlorobenzene, 1,2,4-trichlorobenzene, become comparable to those in aqueous systems.
Many other parameters can influence the volatilization of VOC. Some experiments conducted by INERIS [13] on the triallate reveal that volatilization increases significantly with the speed of wind and also depends on the nature of the soil especially its content in organic matter. Those experiments show that the temperature also affects the volatilization by its effect on the vapor pressure [13]. In conclusion, all the literature data show that volatilization is the result of many processes but no one has been able to establish a mathematical relation between the ambient pressure and volatilization. The objective of this work is to determine the evaporation coefficient of TCE in soil for different values of ambient pressure in order to establish a relation between ambient pressure and the phase change and then show how the ambient pressure can be an important parameter during soil decontamination.
Definition of the system
The system studied in this work is soil containing a liquid phase of TCE. The gas phase is composed of air and vapor. The following assumptions are admitted:
• A1: the solid phase is chemically inert and incompressible,
• A2: the temperature is uniform and constant,
• A3: the gas behaves as an ideal gas mixture,
• A4: there are no chemical reactions in liquid and gas phase. The only physic-chemical phenomenon to be taken into account is the phase change liquid-gas.
Experimental device
The experimental device, called activitymeter is schematized in Figure 1. This device and the associated method are protected by a patent applied for by United States Patent Publication [14], commercial apparatus are supplied by TMI Orion SA, Montpellier, France. The sample (a) is disposed up against a pressure transducer (b) (Druck, PMP4030AB) and a temperature thermocouple (c) (type K). This allows us to record the total pressure of the gas phase, Pg, and its temperature, T, along the process. A piston pump (d) is placed above the sample to impose a gas pressure below the atmospheric pressure. The piston chamber volume is controlled by a screw system (e) with a graduated ruler (f). O-ring gaskets ensure perfect air tightness so that the system can be considered thermodynamically closed. The dimensional characteristics of the device are given in Table 1. The whole device is placed in a thermo-regulated bath to ensure a constant temperature. Because the device is made of stainless steel, its large thermal inertia leads to weak temperature variations and thermal equilibrium is experimentally observed. Data acquisition is performed through a National Instrument DAQ card and analyzed using LabView.
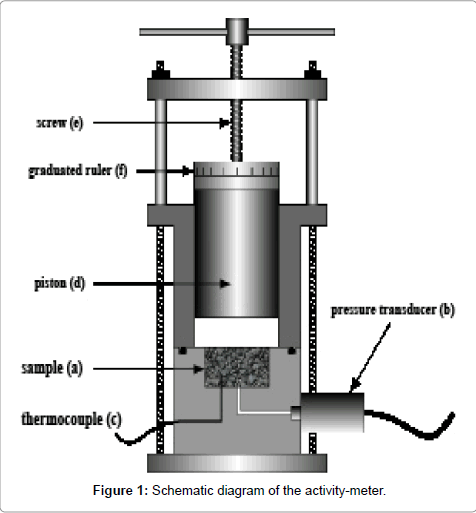
Figure 1: Schematic diagram of the activity-meter.
| Sample diameter | 32 mm |
| Sample height | 15 mm |
| Sample volume | 12.07 cm3 |
| Piston diameter | 74 mm |
| Piston displacement for one rotation | 1.5 mm |
| Volume increment for one rotation | 6.45 cm3 |
Table 1: Dimensional characteristics of the system.
The principle of measuring the coefficient of evaporation is to impose disequilibrium in the system and then observe the response of the system (Figure 2). Initially, the system being in an initial equilibrium, the pressure and temperature are constant over time (state 1).
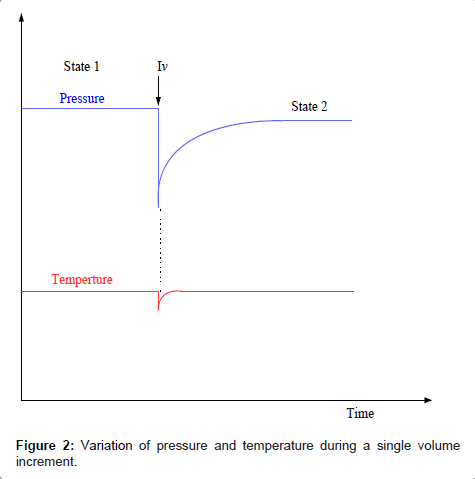
Figure 2: Variation of pressure and temperature during a single volume increment.
A volume increment is applied in Iv, the total pressure drops abruptly and a very small temperature change is occur. The thermodynamic disequilibrium creates a force relating to the jump of the chemical potential between the liquid phase and vapor phase which will trigger the mechanisms of evaporation of the compound. This event is followed by a production of vapor which results in a rise of the total pressure. The system tends toward a new equilibrium state (state 2) where the vapor pressure is lower than that of state 1. When the final equilibrium is reached, the vapor pressure is equal to the equilibrium vapor pressure of the compound.
Experimental profiles of vapor pressure, Pv, and temperature, T
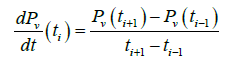
The vapor pressure of TCE,Pv, recorded by the pressure transducer (Figure 3) is used to calculate the evaporation coefficient. It may be noted that the slight temperature variation during the experiment (Figure 4) has practically no effect on the evaporation and hence the only force responsible to the phase change is essentially the thermodynamic force resulting to the difference in chemical potential. As it can be seen, the time of return to equilibrium is relatively long. By using the vapor pressure of TCE given by Figure 3, we determine the derivate dPv/dt. To avoid a strong variation of the derivate resulting on fluctuations of the experimental points, a first smoothing step is performed on the curves using the method of Savitsky-Golay an algorithm of filtering. The approach consists to calculate in each point of a measurement of the signal, a polynomial of order p fixed; reproducing at best a set of n measurements centered on the measure considered and to replace the central measure by the value of the polynomial at this point. This provides a signal that undergoes slow variations with respect to the sampling frequency and which is relatively insensitive to measurement noise. The polynomial degree the most suitable smoothing is 4 [15]. From the fitted curve, the derivate of gas phase pressure at ti is calculated using the finite difference method as given in following equation.
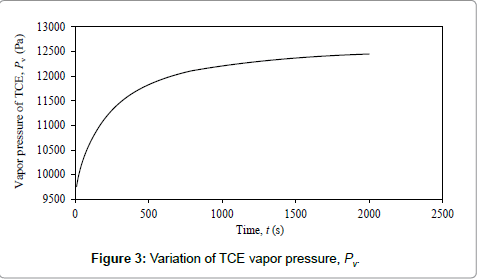
Figure 3: Variation of TCE vapor pressure, Pv.
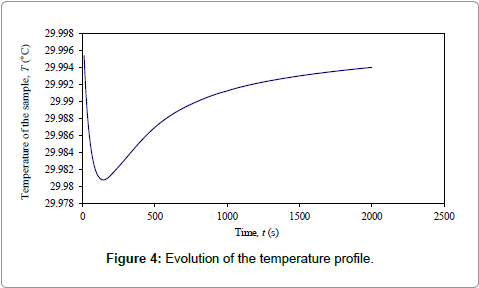
Figure 4: Evolution of the temperature profile.
 (1)
(1)
Method of integration for the calculation of the coefficient of evaporation
This method has been established by Bénet and Jouanna [16] and used by many authors [4,17,18].
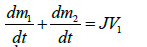
According to the experimental device used in this work, the approach is presented as follow. The soil sample and the air space which is above are presented (Figure 5). A mass balance is performed in the compartments 1 and 2 of respective volumes V1 and V2. Denoting by m1 and m2 respectively the mass of vapor in compartments 1 and 2, and taking into account the change in mass because of evaporation of the liquid, we can write:
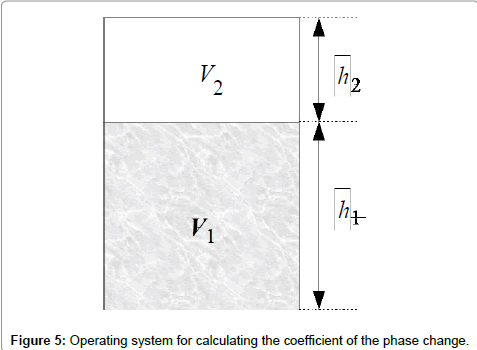
Figure 5: Operating system for calculating the coefficient of the phase change.
 (2)
(2)
where
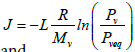 (3)
(3)
and
 (4)
(4)
Moreover, the mass of vapor in compartment 1 is given by:
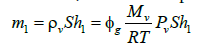 (5)
(5)
And in compartment 2 by:
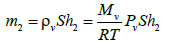 (6)
(6)
According to Eq. (3), (4), (5) and (6), Eq. (2) becomes:
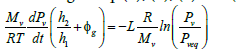 (7)
(7)
By integrating Eq. (7) between the time, t, and a time, teq, which corresponds to the final equilibrium in the system we obtain:
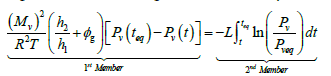 (8)
(8)
The integral of the second member of Eq. (8) is determined using the experimental measurements on pressure. We then plot the curve of variation of the first member as a function of the second member (Figure 6). The slope of the straight line obtained corresponds to the evaporation coefficient, L.
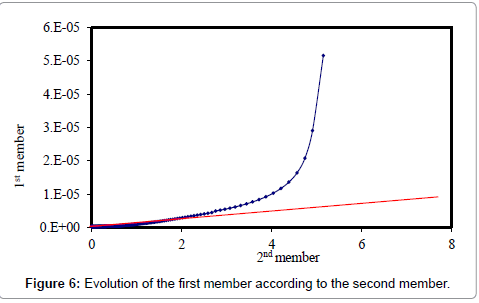
Figure 6: Evolution of the first member according to the second member.
Variation of coefficient of volatilization with gas phase pressure
The experimental results obtained on five values of gas phase pressure allow us to obtain L whose variation as a function of ambient pressure (Pg) is given by Figure 7. We can see that L decreases linearly with Pg, according to the following mathematic relation:
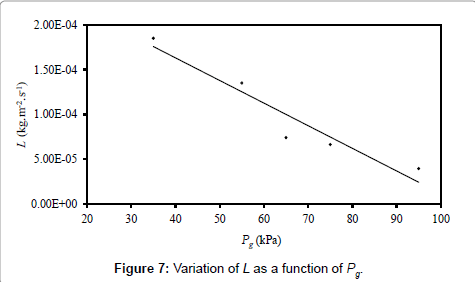
Figure 7: Variation of L as a function of Pg.

For comparison, the coefficient of volatilization is 3.2 times higher for a pressure of 90 kPa than for a pressure of 100 kPa. This coefficient would be multiplied by 20 if the gas pressure passes from 100 kPa to 10 kPa. These results represent a significant advance in the process of remediation of contaminated soils by volatile organic pollutants where the contaminated samples could be exposed in an evacuated enclosure where the pressure is almost zero which would accelerate the extraction process of the pollutant by volatilization.
A study conducted by Scheyer [8] on pesticides shows that the volatilization is proportional to the vapor pressure of the pesticide and the organic matter of the soil what confirms the results presented in our manuscript even if the relation between the organic matter of soil and the volatilization is not explicitly established. Lee concludes that the equations of volatilization of all VOP are similar both for pesticides than for any other organic compound [19]. This means that the conclusions made in the present manuscript for TCE could be applied to other volatile organic pollutants.
At the end of this study on the volatilization of TCE, it appears that the ambient pressure influences considerably the evaporation coefficient. The proportionality law between the coefficient of volatilization and the ambient pressure constitutes an important result in the understanding of the remediation of contaminated soils by VOP because the methods often used for soil decontamination are expensive and sometime very difficult to implement. The approach would consist to place the contaminated samples in an evacuated enclosure where the pressure of the ambient pressure is close to zero. Under these conditions, the volatilization coefficient of the compound can be practically multiplied by a factor more than 20, what would accelerate the decontamination process. However, further studies on different soils and for different compounds would be desirable in order to confirm the results reported in this manuscript.
This work was done within the framework of collaboration between the University Montpellier 2, France and the University of Ouagadougou, Burkina-Faso and supported by the French Ministry of Foreign affairs.