Journal of Tourism & Hospitality
Open Access
ISSN: 2167-0269
ISSN: 2167-0269
Research Article - (2020)Volume 9, Issue 4
Tourism destination attractiveness is the main concept that attracts tourists` to destinations based on tourists perceived value of the destination and its attractions. However, despite this, Ghana, generally andparticularly the West Gonja District (WGD) with iconic and great attractions has not been able to package itself well to attract and give tourists` the best experience. Therefore, the study explored the demand and supply elements of tourism destination attractiveness and sort answers to how those elements have promoted the district`s attractiveness. Using a mixed-method research approach and both probability and non-probability sampling techniques, primary and secondary data were collected and analyzed. The study revealed that the West Gonja district is an attractive tourists` destination perceived as peaceful and safe with the majority of its supply elements deemed satisfactory. The study, therefore, recommends that the facility management, the Mole National Park, hotel and hospitality industry, and local community prioritize the tourism industryand work together to improve and coordinate tourism supply and demand elements to enhance the attractiveness of the district as a tourists` destination.
Tourism destination attractiveness; Tourists perception; Elements of tourism demand and supply; Theory of attractive quality and packaging; West Gonja district
Tourism attractiveness has recently been acknowledged as a way of increasing tourism potential and maximizing its benefits to nations and their citizens. Henkel et al. mentioned that tourist destination attractiveness plays a vital role in influencing tourists’ destination choices, intentions to revisit, hopes of fulfillment, the amount of money spent, and the duration of the stay [1]. The more a destination satisfies and fulfills tourist needs, the more likely it is seen as being attractive, and the most preferred choice by tourists [2]. Therefore, countries like France, USA, and Spain have specialized their tourist sites and made them the most attractive destinations in the world (WTO, 1998), capturing the hearts of many tourists [3].
However, though the tourism industry in Ghana has contributed 6.2 percent to GDP and employed both skilled and unskilled labour, providing about 682,000 total jobs in 2017 (WTTC, 2018), the country has not made conscious efforts to explore and enhance the attractiveness of the tourism industry as compared to Kenya and other countries [4,5]. Particularly, the West Gonja District has not been able to develop and package its attractions as a destination to give tourists the best experience and satisfaction. Ministry of Tourism, Arts and Culture (2015) agreed that though the district is endowed with iconic and amazing tourist sites such as the Larabanga Mosque, Mystery Stone and the Mole Park, poor attention and lack of coordination of the elements of tourism demand and supply including lack of maintenance, beautification and innovative activities over the years, leaves the district attractions in poor conditions [6].
Also, though there are researches on tourism destination attractiveness globally including that of Gearing, et al. (1974), Var, et al. (1977), Ritchie and Zins (1978), Tang and Rochananond (1990), Hu and Ritchie (1993), Kim (1998), Chen and Hsu (2000), Richie, et al. (2001), Morachat (2003), Frimpong-Bonsu (2015) and Pallavicini (2017) [7,8]. Their Investigations concentrated on tourist’s perspectives on destination attractiveness while this study explored deeper into how the elements of tourism demand and supply promote destination attractiveness [9-17].
Theory of attractive quality and packaging
The theory of attractive quality and packaging was propounded by Professor Kano and his co-workers in 1984 to appreciate the diverse ways by which customers evaluate and perceive quality characteristics of a product [18,19]. Harckham, (1989) added that a product quality as long as customers` first impression is concerned is determined by the packaging of the product [20]. The theory is of the assumption that customer satisfaction with a quality attribute can be classified into five categories of perceived quality. Which include ‘attractive quality’, ‘must-be quality’, ‘reverse quality’, ‘onedimensional quality’, and ‘indifferent quality. Attractive quality attributes are regarded as unexpected and enchanted attributes, which provide satisfaction when achieved fully but do not cause dissatisfaction when not fulfilled. It is meant to make things easier and appealing to customers. Kano (2001) has emphasized the importance of this attribute in giving a product a competitive edge over others. Must-be quality attributes are seen as basic and expected by customers [21]. However such attributes are taken for granted when fulfilled but result in dissatisfaction when not fulfilled [20]. For example, no customer cares about a shower working in a hotel room, however, if the shower is broken, it brings about dissatisfaction. The reverse quality looks at having too many achievements, varieties, and high technology which dissatisfies customers, due to customer differences. One-dimensional quality attributes result in satisfaction when fulfilled and result in dissatisfaction when not fulfilled. These attributes are mostly product specifications and content with which companies compete. Indifferent quality refers to attributes that are insignificant and consequently do not result in either customer satisfaction or dissatisfaction [20]. Based on this theory, tourist destinations are seen as products with perceived quality attributes (elements of demand and supply) which must be “packaged” and appropriately displayed for tourists consumption and satisfaction.
This research adopted Kano`s theory of attractive quality and packaging because tourist destinations are like products which value depend on the packaging and perceived quality. Tourists` are attracted to destinations that they perceive to offer quality products and vice versa. Besides, tourists expect destinations to have some basic facilities and services without which they express their dissatisfaction. Tourists are also indifferent to certain destination facilities and services but are happier if destinations provide something unexpected yet enchanting. It is therefore important for the administration of tourist sites to continually improve and provide the needed facilities and services to enhance the perceived quality of destinations in the eyes of the tourists or prioritize attributes that are expected (basic facilities and services) by tourists over the unexpected (luxury).
Concept of tourism destination attractiveness
The term tourism destination attractiveness has become popular over the years as confirmed by studies done by Gearing et al. (1974), Kim (1998), Formica (2002), Kim & Lee (2002), Morachat (2003), Formica & Uysal (2006), Buhalis and Law (2008), Vengesayi (2009), Kresic & Prebezac (2011), Tam (2012) and Ariya et al. (2017) [7,12,15,22-28]. The studies argued that destination attractiveness is the driving force of tourism and without which tourism is likely to be non-existent. Lee et al. (2010) agreed that the more a destination can meet the needs of tourists, the more the destination is in a better position to compete against destinations [29]. Mayo and Jarvis (1981) added that destination attractiveness is a combination of the relative importance of individual benefits and the perceived ability of the destination to deliver such benefits [30]. However, in terms of spatial dimension, destination attractiveness is considered as a place that offers a mixture of tourism products and services with physical and administrative boundaries that define its management, images, and perceptions of market competitiveness [31]. Buhalis (2000) further elaborates that the product and services comprise the entire range of facilities and services offered locally, together with all socio-cultural, environmental resources, and public goods [32]. Kim (1998) however concludes that tourism destination attractiveness is a full package consisting of tourism facilities and services [12].
Factors influencing tourism demand and supply
Crompton stated that tourism demand is influenced by the sociodemographical characteristics of individuals. Such characteristics include cultural (country of origin and social class), social (family roles and responsibilities of the individual), personal (age, gender, marital status, occupation, family size, income and educational level) and purpose of travel [33].
Gray also added that people undertake pleasure travels for wanderlust (desire to leave and search for new experiences and places) and sun lust (search for specific recreational experiences or environments) [34]. Dann describes wanderlust as a push factor that motivates tourists to leave their origins [35]. Sun lust is however seen as a pull factor whereby the characteristics of a tourist destination attract tourists to the place.
Therefore, based on Dann, Gray and Crompton, tourism demand is influenced by different factors including tourists’ characteristics (push factors) and destination attractiveness (pull factors).
Haugland et al. mentioned that the pull factors or the supplyside consist of actors responsible for delivering products and services in the destination area [36]. However, Kresic and Prebezac (2011) stated that the tourism product just like supply consist of six components which consists of attractions, cost/price to the customer, accessibility, facilities, services and reception, activities, and brand and promotion.
This study was carried out between November 2019 to March 2020 at the West Gonja district in the Savannah Region of Ghana. The study used data from both primary and secondary sources. The sample size for the study was 391 tourists, consisting of 40 percent Ghanaian respondents (156) and 60 percent non-Ghanaian respondents (235). The foreign tourists proportion was higher because the research specifically seeks to increase foreign patronage and therefore requires more foreigners to know what attracts them to the district. Both quantitative and qualitative research designs were used to analyze the data. Also, stratified probability and convenient and purposive non-probability sampling techniques were employed for the questionnaire administration to identify tourists who meet the selection criteria of being 18+ and nonnatives of the district.
Figure 1 shows the map of the West Gonja district with the major tourist sites highlighted; Mole National Park, Mystic Stone, and the Larabanga Mosque.
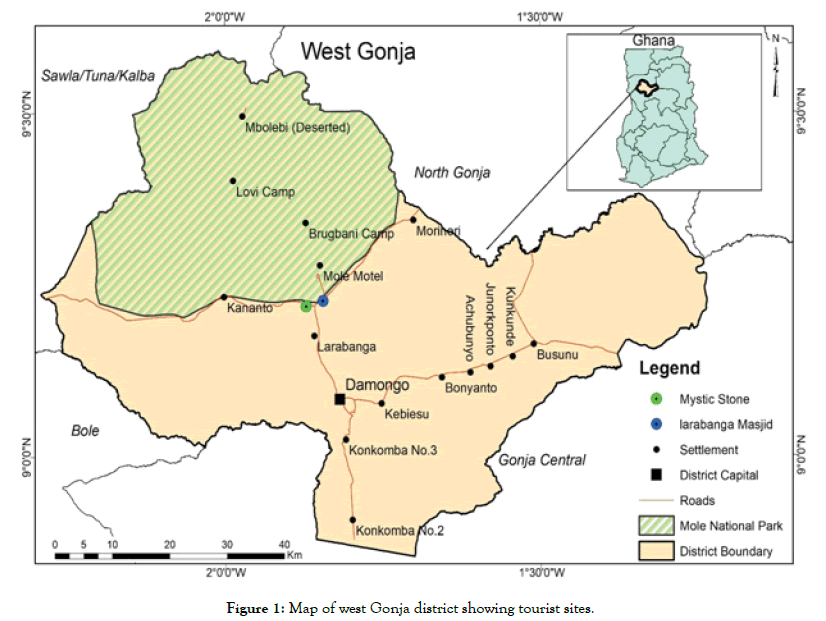
Figure 1: Map of west Gonja district showing tourist sites.
The study discovered that the US (18%) and the Netherlands (11%) were the two major countries that patronize the tourism product in the district with 54% of the foreign tourists being non-African nationals. This finding confirmed with that of Kuuder and Bagson, (2013) in their study of assessing the attractiveness of the Mole National Park, implying that the tourism product in the district is dominated and patronized by non-African nationals, as Africans rarely travel out for leisure activities as indicated in Figure 2 [37].
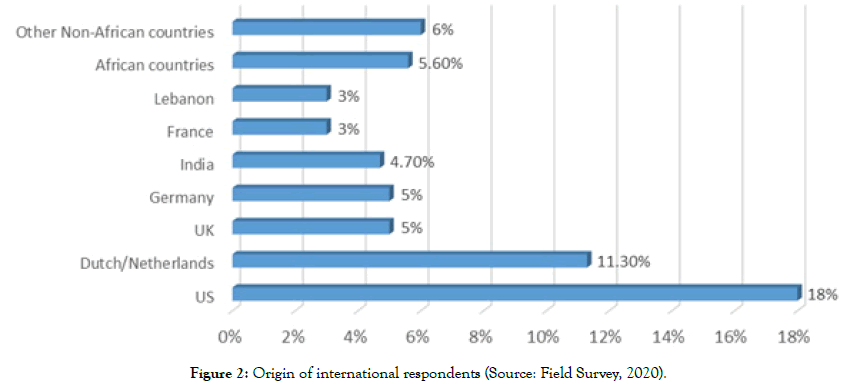
Figure 2: Origin of international respondents (Source: Field Survey, 2020).
However, the number of Ghanaians visiting the district has increased over the years especially from 2011-2019 as seen in Table 1. The percentage of domestic tourists increased from 43% to 69%. While that of the international tourists reduced from 57% to 30% within the same period. The increase in domestic demand can be associated with the construction of the Sawla-Fufulso road in 2012/2013. This made it easy for Ghanaians to access and purchases the tourism product in the district, making accessibility a key supply element influencing tourism demand.
| Year | Domestic arrivals | % of domestic arrivals | Foreign arrivals | % of Foreign arrivals | Total |
|---|---|---|---|---|---|
| 2010 | 6141 | 43 | 8195 | 57 | 14336 |
| 2011 | 7883 | 54 | 6816 | 46 | 14699 |
| 2012 | 7271 | 49.8 | 7303 | 50.1 | 14584 |
| 2013 | 7457 | 53.9 | 6378 | 46.1 | 13,833 |
| 2014 | 7734 | 54.5 | 6455 | 45.4 | 14189 |
| 2015 | 12815 | 72.2 | 4934 | 27.7 | 17749 |
| 2016 | 13076 | 76.6 | 3993 | 23.3 | 17069 |
| 2017 | 13681 | 77 | 4077 | 23 | 17758 |
| 2018 | 12,472 | 67.7 | 5927 | 32.2 | 18399 |
| 2019 | 13088 | 69.8 | 5654 | 30.1 | 18742 |
Source: Mole Park Information Center, (2020)
Table 1: Domestic and international tourist arrivals from 2010-2019 in the WGD.
The study also revealed that 55.4% of the respondents were males and 44.5% being females. Besides, 287 of the respondents (76%) were young and below age 40 with 24% being 51+. The study also found that the demand for tourism among older foreign females, aged 51+(9.5%) increases whiles that of males within the same age reduces (2.3%) as indicated in Table 2. Therefore from the study, young adults (76%), men (55%), and older women aged 51+ representing 9.5% as indicated in (Table 2), are likely to have higher motivation and demand for tourism. However, the number of foreign nationals decreased due to a combination of factors including the inefficiencies of Travel and Tour companies used by foreign tourists, poor marketing, competition from other countries with natural wildlife and inadequaterecreational facilities and activities. Therefore, the district has to work with the Travel and Tour companies, create a variety of recreational activities, and actively market the district attractions to enhance the district attaractiveness and increase foreign patronage [38-39].
| Sex | Age | Total | ||||
| 18-28 | 29-39 | 40-50 | 51-59 | 60+ | ||
| Female-No. and % | 75 | 45 | 17 | 17 | 20 | 174 |
| 19% | 11% | 4.40% | 4.40% | 5% | 44.50% | |
| Male-No. and % | 110 | 70 | 28 | 9 | 0 | 217 |
| 28% | 18% | 7.10% | 2.30% | 0% | 55.40% | |
| Total-No and % | 185 | 115 | 45 | 26 | 20 | 391 |
| 47% | 29% | 12% | 7% | 5% | 100% | |
Source: Field Survey, 2020
Table 2: Age and sex of respondents.
The study further revealed that all respondents were literatesand tertiary students (39%) form a noticeable part of the tourism market in the district. This depicts that literates (100%), tertiary, students and part-time workers together (49%) are likely to have higher and active demand for tourism than illiterates and full-time workers as seen in Table 3. This is because students and part-time workers have the time and motivation to explore, though with limited savings [40-45].
| Educational Status of respondents | Employment status of respondents | Total | ||||
| Employed (full-time) | Employed (part-time) | Unemployed | Retired | Student | ||
| Basic and Secondary -No and % | 9 | 0 | 0 | 0 | 11 | 20 |
| 2.30% | 0% | 0% | 0% | 2.80% | 5.10% | |
| Tertiary-No and % | 146 | 26 | 20 | 27 | 152 | 371 |
| 37.30% | 6.60% | 5.10% | 6.90% | 38.80% | 94.80% | |
| Total- No and % | 155 | 26 | 20 | 27 | 163 | 391 |
| 39.60% | 6.60% | 5.10% | 6.90% | 41.60% | 100% | |
Source: Field Survey, 2020
Table 3: Employment and educational status of respondents.
Also, Figure 3 shows that 64.3% of the respondents were either single, widowed or divorced without any relationship commitment. While 35.5% had relationship commitment and were either married (28%) or living with a significant other (7.4%).
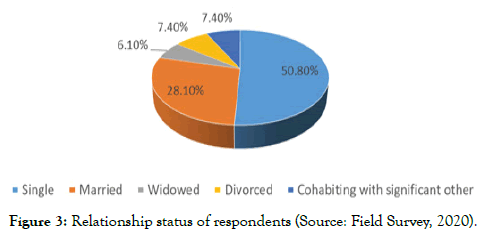
Figure 3: Relationship status of respondents (Source: Field Survey, 2020).
The study discovered that people with no relationship commitment (64.3%) constituted the majority of tourists. This indicates that those in uncommitted relationships (64.3%) are likely to have a higher demand for tourism than those in committed relationships as depicted in Figure 3.
Also, the study discovered that 75% of the tourists in the district were mass tourists hence the district tourism product is highly demanded by mass tourists. Besides, Chart 4.5 shows that 40% of the foreign respondents heard about the district attractions and products from their friends and family, 16% from travel and tour companies, and 4% from social media. Word of mouth (72%) was discovered as the main source of information for tourists in the district which is in line with the studies carried out by Ajake (2015). This means tourist’s satisfaction on the elements of tourism supply is key for positive feedback and reviews [46-49].
The study as indicated in Figure 4 shows that positive reviews and feedback, both oral and written from friends, family, and on social media influence tourists’ final destination choice. This means tourists find and visualize destinations with positive reviews and feedback to be more attractive. Hence tourists’ positive feedback based on the satisfaction derived from the consumption of the tourism product (elements of tourism supply).
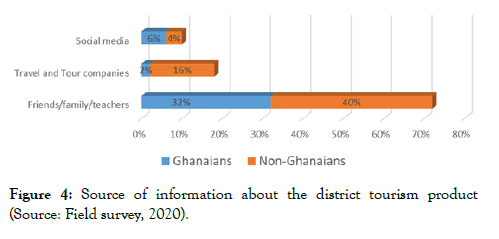
Figure 4: Source of information about the district tourism product (Source: Field survey, 2020).
Elements of tourism demand and supply in the West Gonja District
Tourism demand in the WGD is influenced by both supply and demand factors. The demand factors include the personal characteristics of tourists, which the study discovered to be non- African nationals (54%), young (76%), and students (41%) as found in Table 1 and Figure 3 and Figure 4. It also includes those in a non-committed relationship (64.3%) and males (55%) as found in Figure 3 and Table 2 respectively.
However, the elements of tourism supply discovered in the district include attractions, accessibility, price, facilities, services, reception, image, and promotion as discussed below.
Attractions: The district developed attractions include the Mole National Park, Larabanga Mosque, Mystic Stone and Mognori Ecotourism. The undeveloped attractions include Kparia waterfalls and Konkori caves. The Mole National Park was perceived as a very attractive site with overwhelming scenery by 89% of the respondents. However, 50% and 48% of the respondents were not satisfied with the Mystic Stone and Laribanga Mosque respectively as attractions. According to the respondents, the Mystic stone and Mosque as attractions are not sufficient to satisfy them. This implies that only the Mole Park satisfy and offer tourists the best experience.It is therefore essential to create innovative recreational events and activities at the Mosque and Stone sites to enhance their perceived attractiveness and satisfy tourists. Figure 5 below shows the developed tourist attractions in the district.
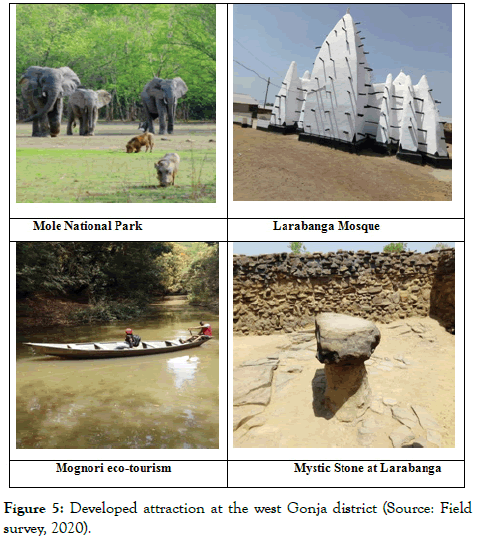
Figure 5: Developed attraction at the west Gonja district (Source: Field survey, 2020).
Accessibility: Attractions are said to be discovered if they are accessible, thus placing accessibility as a necessary supply element. The study revealed that 89.4 % of the respondents were satisfied with the district accessibility. This is due to the good condition of the road network leading to the district and the tourists’ attractions as seen in Figure 6 and 7.
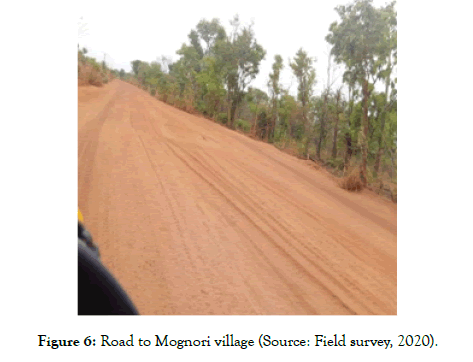
Figure 6: Road to Mognori village (Source: Field survey, 2020).
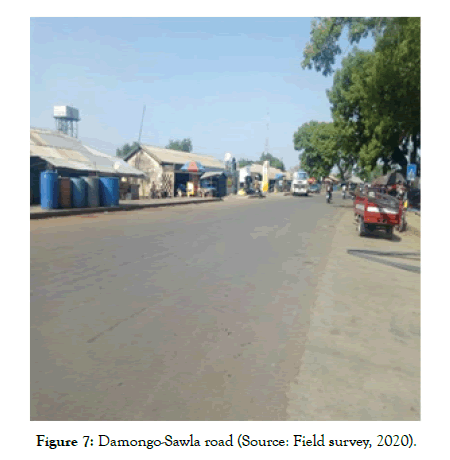
Figure 7: Damongo-Sawla road (Source: Field survey, 2020).
Hence 11% of the respondents expressed their dissatisfaction of accessibility in the district due to the poor condition of the Mognori Eco-village road as seen in plate, and poor services by some travel and tour companies, which the study discovered to be key stakeholders in attracting international tourists to the district. The district improved accessibility has attracted a lot of tourists evidenced by the increase in domestic tourists over the years indicated in Table 1, after the construction of the Fufulso-Sawla road. Therefore the district has to coordinate and partner with the travel and tour companies to enhance the district attractiveness and maintain and improved accessibility (Mognori road) to attract more tourists.
Price: The study discovered that 85% of the respondents were satisfied with the price of the district tourism product, with 15% being unsatisfied. This means the district offers value for money and should continuously improve on its supply elements to attract more tourists.
Facilities and Services: The West Gonja district offers tourists support facilities and services including accommodation and utilities, sanitation, security and health (Mole clinic), communication and network, restaurants, convenience stores, recreation (swimming pool and outdoor view) and reception and services. The accommodation facilities include the Mole Motel, Zaina lodge, Savannah Lodge, Bulu Guest House, Home-Stays at Mognori Village, and Laribanga Library which is sometimes used as accommodation during peak periods (November–January). There are also two accommodation facilities under construction at Laribanga. Figure 8-11 represent the popular accommodation facilities in the district.
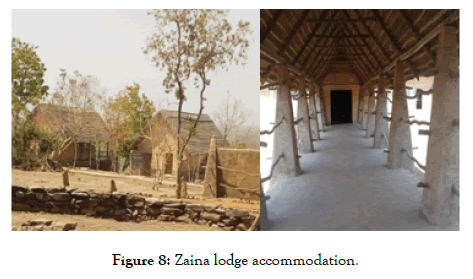
Figure 8: Zaina lodge accommodation.
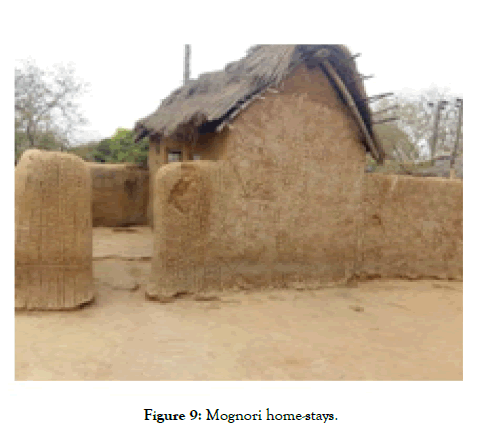
Figure 9: Mognori home-stays.
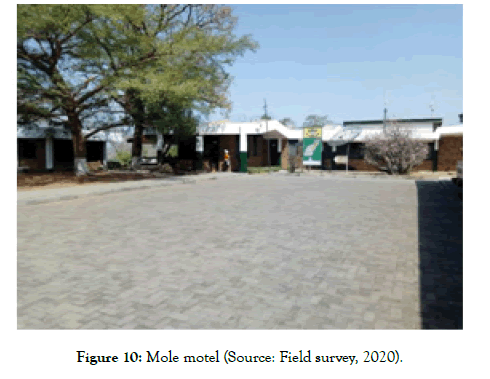
Figure 10: Mole motel (Source: Field survey, 2020).
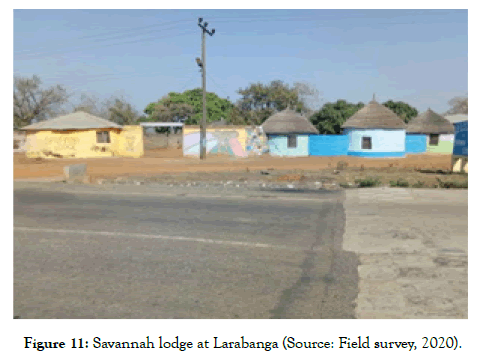
Figure 11: Savannah lodge at Larabanga (Source: Field survey, 2020).
From Table 4, 78% of the respondents expressed their satisfaction with the accommodation facilities. However, 22% of the respondents expressed their dissatisfaction with accommodation facilities because the bathroom shower, water and electricity, fun, and air condition were not working properly at a point in time during their visit. These attributes are referred to as mustbe quality attributes, which tourists expect and take for granted when provided well (78% satisfied with accommodation) but express their dissatisfaction when not provided well as agreed by Kano (2001). Services and reception (customer service) was discovered as a one-dimensional quality attribute which tourists expect and are satisfied when provided well and dissatisfied when poorly done. Also, 100% of the respondents were satisfied with the district communication and network services, and 79% and 64% of the respondents being satisfied with the restaurants and security services respectively. Which means they received quality and good services from such facilities and services. However, 32% and 45% of the respondents were dissatisfied with reception and services and recreation, thus calling for hospitality training services to improve services and reception. However, accommodation facilities, communication and network services, restaurants, and security can attract more tourists to the district via positive reviews and contributed to the district attractiveness. But recreation and reception and services have not effectively contributed to enhancing the district attractiveness. Therefore recreation and services and reception have to be improved to maximize tourists’ satisfaction and enhance the attractiveness of the district.
| Facilities and services/rating | Not Satisfied | Satisfied | Very satisfied |
|---|---|---|---|
| Attractions | 67 (17%) | 241(62%) | 83(21%) |
| Accommodation and utilities | 87(22%) | 261(66.7%) | 43(10.9%) |
| Sanitation | 132(33.7%) | 259(66.2%) | 0 |
| Convenient stores/shopping | 167(42.7) | 224(57.2%) | 0 |
| Restaurants | 81(20.7%) | 254(64.9%) | 56(14.3%) |
| Security | 140 (35.8%) | 251(64.1%) | 0 |
| Communication and Network | 0 | 301(76.9%) | 90(23%) |
| Reception and services | 176(45%) | 208(53.1%) | 7(1.7%) |
| Recreational facilities | 127(32.4%) | 264(67.5%) | 0 |
Source: Field survey, 2020
Table 4: Perceived attractiveness of facilities and services in the WGD.
Brand Promotion and Image: About 53% of the respondents perceived the district brand to be safe and peaceful. Thus referring to the district as a home away from home. This is not different from how tourists according to Mitta et al. (2012), perceived Ghana as a quiet and peaceful destination [39]. Safety and stability matter a lot in the tourism industry and no tourists would visit a destination with chaos and war. Which means, peace lovers are likely to choose the district as a destination choice due to the brand (safe and peaceful), which they find attractive. Therefore, the district`s brand also enhanced its attractiveness as a tourists destination.
Generally, tourist were satisfied with 80% of the supply elements offered at the district which offers good experiences and value for money. This means, the majority of the supply elements of tourism found in the district contributed positively to enhancing the attractiveness of the district as a destination. Hence 75% of the respondents perceive the district as an attractive tourist destination. Thus confirming that elements of demand and supply enhances destination attractiveness and likely to influence revisit and recommendation decisions. This is because tourists’ perceived attractiveness of a destination depends on the totality of experiences of all the supply elements at the destination. Therefore it is necessary for the district to continuously improve its supply elements especially facilities, recreation, services and reception, and attraction (Mosque and Stone) to increase its attractiveness.
The study revealed that 68% of the respondents were willing to revisit the district and 88% were willing to recommend the district to their friends and family of which foreign guests were 54% out of 60%. However, 32% were not willing to revisit the district due to both demand and supply factors like a financial and family obligation, dissatisfaction with the Laribanga Mosque and Mystic stone, limited recreational facilities, and poor services and reception. Implying that revisit decision is influenced by both demand and supply factors as confirmed by Morachat (2003) in his study of destination attractiveness through tourists’ perspectives [15].
The study concluded that young and single people, men and aged women and non-African nationals have a higher tourism demand and motivation to pursue leisure. The study also concluded that the majority of tourism supply elements including accommodation, communication and network services, restaurants, security, attractions, sanitation, and recreational facilities in the West Gonja district were perceived by tourists as attractive, satisfying, affordable, and safe and therefore contributed positively to enhancing the district attractiveness. However, there were significant dissatisfaction with the district reception and services and Mosque and Mystic stone as supply elements. Also, the study concludes that the district has limited accommodation and recreational facilities for tourists during peak seasons. Also, travel and tour companies are essential in attracting international tourists to the district.
The study, therefore, recommended the facility management and tourism authorities in the district to establish a consistent hospitality training for workers and service providers involved in the hospitality industry in the district to improve services and reception. Also, it is essential to create innovative and varied recreational events and activities to complement the Mosque and Mystic Stone as attractions and enhanced their perceived attractiveness to satisfy tourists. Besides, the Mole National Park, facility managements, and hotels/restaurants should collaborate to develop and improve accommodation facilities and partner with the Travel and Tour companieswithin the district, create a variety of recreational activities, and actively market the district attractions to enhance the district attractiveness in the eyes of international tourists.
Citation: Huzeima M and Salia A (2020) Influence of Tourism Supply and Demand Elements in Destination Attractiveness: The Case of The West Gonja District. J Tourism Hospit 9:435. doi: 10.35248/2167-0269.20.9.435
Received: 29-Jun-2020 Accepted: 20-Jul-2020 Published: 27-Jul-2020 , DOI: 10.35248/2167-0269.20.9.435
Copyright: © Huzeima M, et al. This is an open-access article distributed under the terms of the Creative Commons Attribution License, which permits unrestricted use, distribution, and reproduction in any medium, provided the original author and source are credited.