Journal of Geography & Natural Disasters
Open Access
ISSN: 2167-0587
+44-77-2385-9429
ISSN: 2167-0587
+44-77-2385-9429
Research Article - (2023)Volume 10, Issue 3
In contemporary world where technology is just a click away, GIS can prove to be an extremely powerful tool for management and mitigation of disasters. In the study of geography, the spatial dimension describes and compares patterns where environmental factors are located. These patterns are determined by using quantitative and qualitative research to compare areas in relation to a particular variable. The aim of this approach is to amend these factors and create more equity in relation to the variable being studied. In the present study, space is studied with relation to disasters and through the perspective of disaster management. In this research paper an attempt is made to understand the disasters prevailing in different wards of greater Mumbai. The comparison between wards is done to bring forth the spatial patterns and disparities. This would represent the footprints of disasters and its dynamics.
The present research paper aims at carrying out geospatial analysis by collecting baseline data for greater Mumbai using questionnaire surveys and secondary data from government agencies. Hazard mapping, vulnerability index and disaster risk index for greater Mumbai was calculated and mapped ward-wise with an aim of promoting and providing an equitable approach to disaster management for greater Mumbai.
The methodology used for the study includes geospatial analytical techniques and perception analysis using questionnaire surveys. With reference to Kate’s model of hazard perception and response respondents were interviewed adopting stratified random sampling technique for 24 wards of greater Mumbai. Perception of people regarding disasters, its impact, and safety measures adopted by them and how management of disasters was presumed was evaluated. Their idea of safe zones, safe routes, direction and resilience was noted and mental maps were prepared. Levels of communications in-terms of disaster management were confirmed and anomalies if any were taken into account. Expectation of local people in terms of disaster management varies with space and time. Detailed geospatial mapping was carried out and an attempt is made to incorporate the same in a GIS tool as a web map, in-order to build a Disaster Information System (DIS) which would help to disseminate information to local people and build a resilient city in the future. Along with this quantitative and statistical analysis, SWOT analysis is also carried out. This study has led to a deeper understanding of the problem and has led to great discoveries regarding areas, people’s perception and their expectation from future in terms of disaster management and mitigation.
Spatial dimensions; Hazard risk and vulnerability analysis; Disaster management; GIS; Perceptions; Disaster information system
In contemporary information age or digital age the use of information technology is pivotal. This evolution of technology in day to day life in society has led to the fact that the modernization of information and communication processes has become the driving force of social evolution thereby forming knowledge based societies which forms knowledge economies. Occurrence of more and more disasters all over the world, has raised concern as well as an increasing urge to work towards making the world more resilient in future among disaster researchers worldwide. Although, it is evident that the developing nations and third world countries are at a higher risk of natural as well as man-made disasters, due to each continent’s geographic location and unique environment, even developed countries are exposed to disasters every year to a great extent.
The natural hazards in greater Mumbai such as floods and landslides trigger anthropogenic disasters. Road accidents and fire accidents are also the cause of disasters which could be the impact of flooding and landslides. Even health epidemics which occur after the floods or fire accidents in certain pockets of greater Mumbai are majorly caused by human activities. The introduction of Geographic Information System (GIS) as a technique for analysis to build a platform for disaster mitigation is the need of the hour in greater Mumbai. This would ensure inclusive disaster management and bridge the gaps in communication during times of distress.
Previous studies concentrated on selected wards in greater Mumbai, which are prone to flooding and landslide. In this research paper, along with this other disasters especially fire accidents, road accidents and health epidemics are also studied for twenty-four administrative wards of greater Mumbai. This offered an insight into the problems at local level and brought forward new approaches to the study of disaster management for future.
Objectives and research hypothesis
One of the main objectives and research hypothesis of the study is that, “a geospatial analysis based disaster information system can efficiently tackle disasters in the study area in future.”
The methodology adopted for the study area included: Geospatial analysis and perception analysis and recommendation of a Disaster Information System (DIS) viz. a model designed for a mobile GIS app.
The objectives of the research have led to the following study.
• Study of ward-wise pattern of hazard and vulnerability along
with population data in greater Mumbai and comparative
analysis of vulnerability index and disaster risk index by
examining the distribution of hazards and vulnerability in all
the wards of greater Mumbai.
• Study of the road network of greater Mumbai in detail to
analyse the connectivity and accessibility of each ward and
application of geospatial analysis and techniques for better
management and mitigation of disasters.
• Application of Kate’s model of hazard perception and
response by carrying out random stratified questionnaire survey in all the 24 wards of greater Mumbai with a sample
size of 1000 questionnaire to analyse local people’s
perceptions and expectations.
Study area
The study area comprises of greater Mumbai, which is divided into Mumbai city and Mumbai suburb districts. Both the districts are further divided into 24 administrative wards, which are further subdivided 88 census sections. Mumbai, previously known as Bombay, is the economic capital of India. Total population for greater Mumbai is 12,442,343 as per 2011 Census. The city is also having an elongated shape. Due to the geographic location of Mumbai is prone to disasters, both natural as well as man-made. Brihanmumbai Municipal Corporation (BMC) area is divided in two revenue districts viz. Mumbai city district and Mumbai suburban district. Greater Mumbai of Maharashtra is entirely urban. It extends between 18° and 19.20° Northern latitude and between 72° and 73.00° Eastern longitude. It has an East to West extent of about 12 km where it is broadest, and a North-South extent of about 40 km. greater Mumbai’s height is hardly 10 meters to 15 meters above sea level. At some places the height is just above the sea level (Figure 1). Part of Mumbai city district which is called ‘Salsette’ is a reclaimed land on Arabian sea coast (Figure 2). Mumbai city is one of the first four metropolitan areas in India. It has global importance since Mumbai is an international sea port and the international Sahar airport.
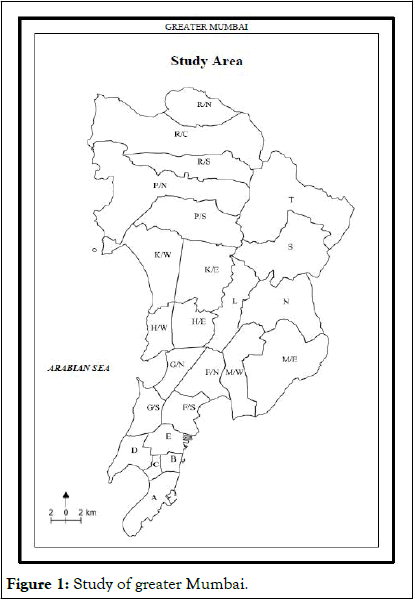
Figure 1: Study of greater Mumbai.
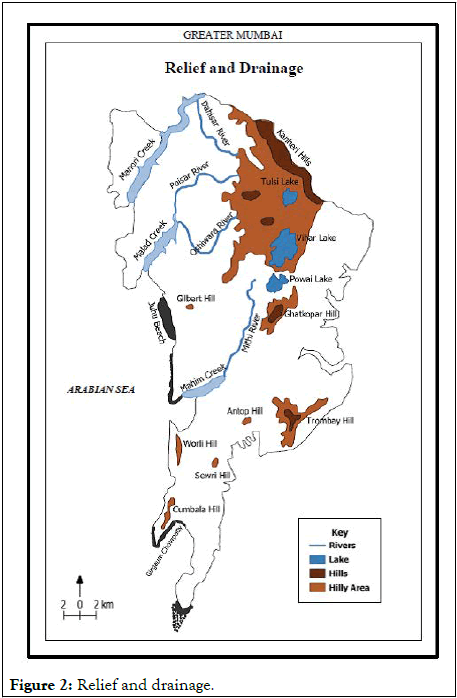
Figure 2: Relief and drainage.
In order to describe the spatial dimensions of disasters in greater Mumbai, patterns of population, hazards, vulnerable areas and key facilities in twenty-four administrative wards of greater Mumbai are described and compared.
Following hazards were identified in the study area, i.e. greater Mumbai:
• Flood.
• Fire accidents.
• Landslide.
• Health epidemic.
• Road accidents.
Using GIS framework, an information system was built for greater Mumbai. Data was represented as virtual map userfriendly GIS web map was the result. SWOT (Strength, Weakness, Opportunity and Threat) analysis for disaster management in greater Mumbai is carried out. The primary aim of building this disaster information system is to give a real-time picture of disasters in the city with respect to all the five hazards and vulnerable areas. However, the most important aspect of this is to suggest two aspects as powerful tools of disaster management.
• Connectivity of key facilities and depiction of vulnerable areas
for mitigation of disasters.
• Optimal route connecting these areas serving as exit routes for
greater Mumbai during times of distress.
The aim of creating disaster information system is to reach out to local citizens of greater Mumbai so that they can be informed and alerted during distress in future and to prepare them to cope with the same. Critical analysis and assessment of the implications of the occurrence of natural or man-made hazards need information comprising of both spatial and non-spatial related to factors influencing the hazards. Such information would be immensely useful for disaster management. Identification of the processes responsible for the hazards and the natural resources and socio-economic parameters associated could be judged. Appropriate planning and preparedness measures could be executed and mitigation could be carried out accordingly. With the advent of satellite remote sensing and GIS technology, the information generation related to disasters has become easier in terms of database generation, storage, retrieval and data analysis. Further, creation of computerized database with net-working facilities has added a new dimension to the dissemination of information, free flow of data and information exchange for speedy implementation of action plans and their monitoring. Risk planning could also be implemented. Spatial modeling, querying and map creation for efficient and effective implementation of Response Action System (RAS) could be generated.
Ability of GIS to quickly and easily manipulate and incorporate geographically referenced data is critical to disaster situation information management. Maps through GIS can be updated quickly to reflect changes in the situation. Status of areas reviewed. Imagery collected from manned or un-manned aerial or space-based remote-sensing platforms can be incorporated as it becomes available to aid in getting a picture of what is happening on the ground during a disaster response.
Disaster information system proposed for the research
Disaster and emergency management system is proposed in the research and developed in order to handle the disaster situation. It consists of administrative, geographic and decision-support information systems. This system is designed, containing the relationships about data and information access, disaster management communication, risk reducing and preparation, visualisation of post-disaster problems.
Data design and organisation of the system
The base files, which were used to create this information system, are described below:
Shapefile data layers were created for these vulnerable areas. The layer database is point data. Locational attributes of these vulnerable shapefile layers are coordinate points with reference to the latitude and longitudinal reference of greater Mumbai.
• Flood prone areas: This is a point data shapefile layer and
comprises of flooding spots and water-logging spots.
• Road accident prone areas: This is a point data shapefile
layer, which comprises of road accident spots.
• Fire prone areas: This point data layer consists of settlements
and areas which are susceptible to fire hazards and accidents.
• Landslide prone areas: This layer comprises of point data
showing landslide prone areas.
The key features which are related to the data are regarding facilities. This data was linked to point of origin of particular disaster so vulnerability could be assessed.
• Open spaces: This layer comprises of gardens, open spaces, plots
etc. which are recognized by BMC (Brihanmumbai
Municipal Corporation) as open space in each ward.
• Temporary shelter/municipal schools: This layer consists of
Municipal Schools in each ward of greater Mumbai.
According to BMCs disaster management plan municipal
schools acts as temporary shelter during disasters.
• Police station.
• Hospitals.
• Fire brigade.
Base data consists of twenty-four ward boundaries and green areas. Green areas are un-encroached polygon areas. Ward boundaries are shapefiles and are linked to the line data of roads, railways and point data of railway stations.
• 24 ward boundaries: This polygon layer comprises of the 24
administrative ward boundaries of greater Mumbai.
• Green area: This polygon layer comprises of gardens, forests
(Mangrove/Sanjay Gandhi national park areas), public gardens
etc.
• Roads: This line layer comprises of road network of greater
Mumbai.
• Railways: This line layer shows the railway network of greater
Mumbai.
• Railway stations: Point layer shows railway stations along the
railway line.
All the layers were represented on an interactive web GIS page, which was further, developed as a mobile APP. This information system created a user friendly interactive interface in which the local people i.e. population affected during times of distress could know their exact location on a map and get information for the routes to be taken during disasters. It will also project the nearest possible safe route and destination.
Entity relationship and organisation of the mobile application
The Entity-Relationship (E-R) diagram is one of the most commonly implemented conceptual data models used with GIS. Entities, attributes, and relationships are used to represent real-world features, what their properties are, and what the relationships are between these entities. Hardware and software issues are not explored in the E-R diagram. These are addressed later in logical and physical data models. This first level of data abstraction is used by geospatial analysts as a starting point when analyzing and assessing the available data and how it fits together (Figures 3 and 4).
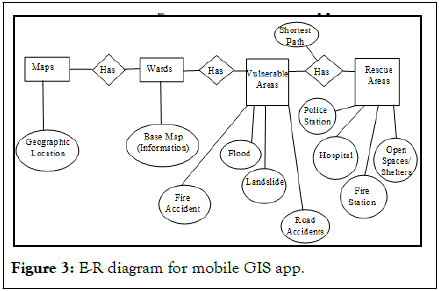
Figure 3: E-R diagram for mobile GIS app.
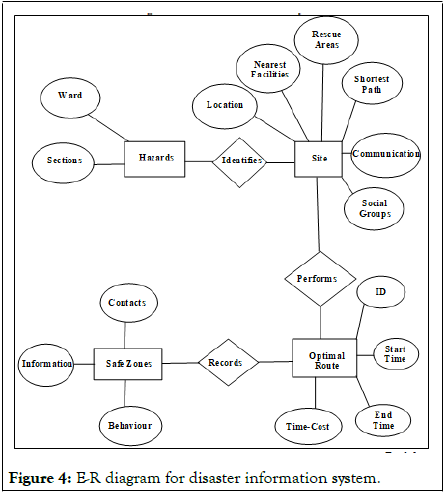
Figure 4: E-R diagram for disaster information system.
• The web based GIS application will have Mumbai map on top
of OSM (Open Street Map) layer.
• On top of the base map (OSM layer), there will be other layers
(shape files converted to GeoJSON)).
• The application uses Google map API to find the shortest
distance to reach the nearest location from users location.
• The application has “identify tool” and layer manager.
Software required:
HTML, Shape file (QGIS), GeoJSON, Google map
Execution of the mobile app
The virtual web map asks for geolocation of the user. The user in the mobile has to click on allow button to enable the application to locate his current location. If the user clicks on deny button all the dataset is displayed with the locations marked along with the layer manager. The user can browse and through info tab see all the areas. In the above map all the shapefiles, which have been converted to GeoJSON files, have been represented on the web map. The base is google map. The web map takes user location as the starting point and indicates the users nearest open space or municipal school and how to reach there using shortest route. Example shows how to reach from point A to B using the shortest distance shown in blue (Figures 5-8).
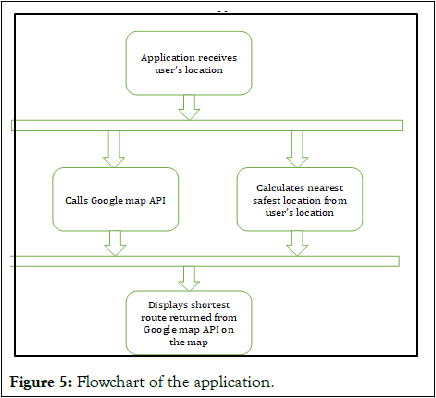
Figure 5: Flowchart of the application.
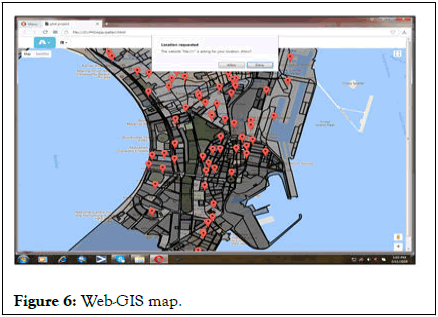
Figure 6: Web-GIS map.
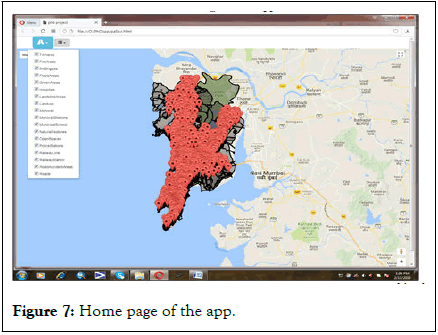
Figure 7: Home page of the app.
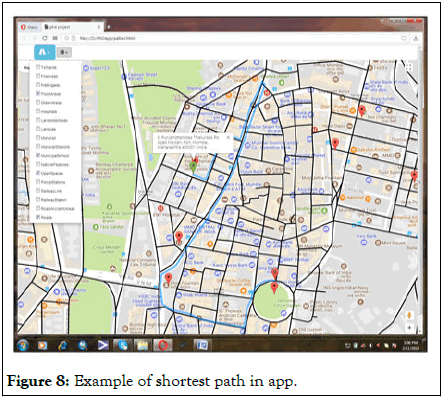
Figure 8: Example of shortest path in app.
This virtual application to build a DIS (Disaster Information System) is crucial for people, which MCGM (Municipal Corporation of Greater Mumbai) should promote to users at no extra cost. The users’ mobile is the equipment and the application could be downloaded if sanctioned by the authority.
A mobile GIS app and first aid at every home will be most economical in times of distress. However, all the other ideas such as local management committee, grouping and training of individuals, better communication etc. are also equally important even though difficult to implement and costly initially for management of disasters in future.
Relevance of SWOT analysis for planning and mitigation of disaster
The SWOT analysis is an efficient method, used in the case of strategy planning, to identify the potentials, the priorities and to create a common vision for the accomplishment of the development strategy. In fact, SWOT analysis must offer the answer to the question: Where are we? This includes the analysis of the internal environment and the general and specific external environment. SWOT represents the acronym of the words: Strengths, weaknesses, opportunities and threats.
The American economist Ken Andrews is regarded, in general, as being the pioneer of SWOT analysis. In 1971 he was one of the first strategy theoreticians who defined formally the concept of strategical concordance between the resources and the potential of a company and the external environment. He stated that this methodology is a healthy approach to determine a recess strategy, the best way for a company to use its strong points to exploit the opportunities, but also the most efficient way to protect its strong and weak points, against various external threats. The SWOT analysis is, in fact, a technique through which the strong and weak points can be identified and the opportunities and threats of a project, action or state of fact can be examined and can be used as element to come to conclusion. That is why it is also extremely useful in the geographical studies, especially in those which refer to the analysis of the socio-economical, environmental factors, population, territory development planning, and in the case of the drawing up of complex geographical studies.
The SWOT analysis of the disaster management domain in greater Mumbai has been carried out on the basis of a comprehensive situational analysis of capacities in the context of five hazards floods, landslides, fires, health epidemics and road accidents in twenty-four wards, across four key components of research, hazard and vulnerability assessment, geospatial technology, public awareness and organizational/institutional development. An attempt has been made to identify factors that help or hinder the broader disaster management agenda. The findings of the SWOT analysis for disaster management in greater Mumbai are comprehensive and spread across the types of hazards, levels of governance, sectors of development, phases of the disaster cycle and range of stakeholders, in alignment with the expected outputs of the training and capacity building. These are considered in the subsequent stages for the development of a DIS (Disaster Information System) in order to make Mumbai more resilient in future. Strength, weakness, opportunity and threat analysis is carried to project the disaster scenario of Mumbai and understand associated factors for disaster management for creation of disaster information system (Figure 9).
Strength: The strength of analysis of disaster in Mumbai is that it focuses more on information, real time data and solutions to tackle the problem of disasters in the city. The approach is simplistic and focuses on local level data with in-depth information and analysis. To tackle the problem of disasters geospatial analysis as well as perception analysis is important. This provides new direction for disaster management more efficiently and effectively by carefully bringing out the gaps and by focusing on micro-level analysis in case of Mumbai and for dissemination of information to people.
Weakness: The weakness exploring disaster in Mumbai is that, due to lack of availability of data temporal analysis of data could not be done, however with the help of real time mapping and by field observation and perception study, this drawback could be overcome to some extent. Secondly, geocoding of data was a difficult job as there is discrepancies in names of facilities like open space, schools etc. To tackle this problem, only those points, which have been exactly geocoded, were made use of.
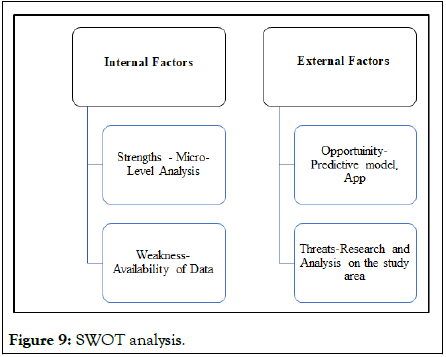
Figure 9: SWOT analysis.
Opportunity: Disaster related information would bring out great opportunities in future as the virtual GIS web map can further be developed into a mobile application. Disaster information system, which can be easily operated by common man without the knowledge and expertise of GIS. This is an embedded GIS App useful for operation and would create awareness among people. Initiatives should be taken by government agencies, NGOs, companies, local bodies etc. to collaborate and tackle the problem of disaster management efficiently in future [1].
Threats: This experiment would give wholesome and best solutions to the problems of disasters in Greater Mumbai, but perspective relevant to idea can be challenged and sometimes the applications proposed might be inoperative which an issue is. Overtime time the issues could be rectified and managed by suggestive measures.
Models and experimentation for establishment of the hypothesis proposed
The outcome of the research was applied through various models. The study related to disaster was conducted two find out the dimensions of disaster in greater Mumbai. The ideas and the process of developing solutions for disasters and their management with reference to Mumbai were examined with the help of models. The research looks at the creative methodology. The study carried out provided spatial dimensions of risks and hazards that can cause an outbreak of disasters in Mumbai, within the framework of these tested models and thereby recommended prototypical preparedness and mitigation for specific locations.
Different models have been proposed for disaster management by researchers and agencies. Despite their efficiency in some locations, disasters are still a fundamental challenge in the way of sustainable development. The purpose of this research is developing a comprehensive conceptual model for disaster management [2].
When it comes to making decisions it is important to not only think about the facts but consider the human side to a decision. Z model is a tool which promotes an understanding of others’ preferences for communicating and operating. It also provides a useful framework to ensure consider all aspects when making decisions [3]. This is frequently called the “Z model” for decision making. Using this model every aspect of a decision making in disaster management is considered.
Based on the questionnaire survey which was carried out, a brainstorming analysis is done to figure out the most important requirement for greater Mumbai in terms of disaster management as per the respondents rating and preferences which were noted. Based on a scale the most efficient and economical parameter is chosen (Table 1).
| Generated idea | Low cost | Easy to implement and is Feasible | Will help other processes | Total |
|---|---|---|---|---|
| Local disaster management committee should be set up | 1 | 3 | 5 | 9 |
| Local residents should be grouped and trained | 1 | 3 | 5 | 9 |
| First aid | 2 | 1 | 1 | 4 |
| Monetary aid | 5 | 4 | 1 | 10 |
| Food/shelter | 5 | 3 | 1 | 9 |
| Better communication | 1 | 4 | 3 | 8 |
| Sanitization | 3 | 5 | 5 | 13 |
| Health facility | 3 | 3 | 3 | 9 |
| Better roads | 4 | 5 | 1 | 10 |
| Mobile app | 1 | 1 | 1 | 3 |
| Dissemination of information/warning | 2 | 2 | 5 | 9 |
| Any other | 1 | 1 | 1 | 3 |
Table 1: Brainstorming to analyse future requirement for disaster management in greater Mumbai.
On a scale of 1 to 5, 1 being the most preferred or easiest and five being the most difficult.
BCG matrix for disaster management in greater Mumbai gives an idea from future perspective that in which sector investments or better management is needed. From the matrix it is observed that capacity to cope up with disasters should be high in-order to make mitigation efficient. VI (Vulnerability Index) and hazards should both be low for the city to be resilient in future. DRI (Disaster Risk Index) can be low only if capacity is high and mitigation measures are efficient (Table 2) [4].
| High | Mitigation (star) | DRI (question mark) | |
| Low | Capacity (cash cow) | VI and Hazard (dogs) | |
| Relative disaster risk | |||
Table 2: BCG (Boston consulting group) matrix for disaster management in greater Mumbai.
• Cash cows: Capacity (It should be invested upon).
• Dogs: Vulnerability and hazard (should be reduced/not
promoted).
• Question mark: Disaster risk index (should invest on this i.e. DRI should be less).
• Star: Mitigation (should invest money on this to make the study area resilient) (Table 3 and Figure 10).
| Zone | Hazard | Capacity | DRI | VI |
|---|---|---|---|---|
| 1 | 18.3 | 15.19 | 17.6 | 15.2 |
| 2 | 17.98 | 19.08 | 16.23 | 19.07 |
| 3 | 18.61 | 19.43 | 20.64 | 19.44 |
| 4 | 13.25 | 13.07 | 15.05 | 13.08 |
| 5 | 17.98 | 21.2 | 16.44 | 21.19 |
| 6 | 13.88 | 12.01 | 14.05 | 12.01 |
Table 3: Parameters for BCG matrix.
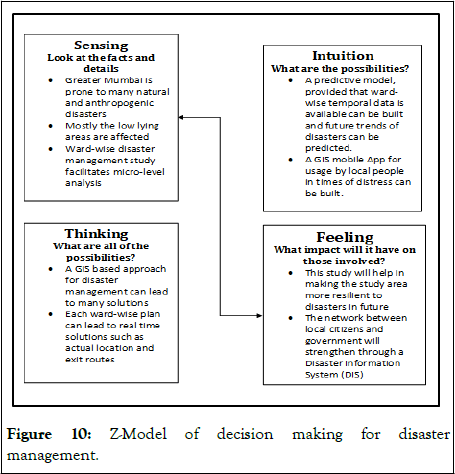
Figure 10: Z-Model of decision making for disaster management.
Compared to few apps for disaster management in the western countries such as NINA app in Germany and Waze app by google, it will be crucial for greater Mumbai to have its own standardized app for disaster management in future. As the app will provide micro-level information along with spatial data, local citizens will be informed and guided properly during emergency situations. Even during the questionnaire survey for perception study which has been carried out for greater Mumbai, it can be observed that people expect a mobile app for disaster management in future, designed and made available by the government [5]. If government introduced a standardized app it will it act as a medium of communication between citizens and the especially disaster management cell of BMC. It will also ensure inclusive disaster management by connecting through the app. A standardized app will eliminate misinformation or redundancy also.
The concept of disaster information can be described as guiding, coordinating and application of all the sources of all organizations and associations for the common purpose of preventing loss and decreasing disaster damage. Hence it is not possible to prevent many of the disasters. Precautions should be taken for preventing disasters or minimizing disaster damage. The communication within and among the institutions is provided by telephones and faxes. Efficient use of electronic environment for the public institutions’ operations, for the coordination within and among institutions and for services designed for the citizens can be done by using internet. Considering that all the information that is used for decision making is collected online this is possible. For fulfilling this a Local Area Network (LAN), to be used for sending data to the centre, and a Wide Area Network (WAN) to be used for exchange of data among the units within the system is designed for the disaster management centre. Foreseeing the fact that the existing communication infrastructure can be damaged during the disaster, wireless communication technologies can be implemented for whole of greater Mumbai. Advantages and disadvantages of the technologies during and after the disaster prevail [6].
From this research it could be concluded that in future greater Mumbai can be made disaster free. Extent of disasters in future could be managed efficiently and effectively if we steer our efforts towards achieving sustainable development. The study presents the scenario of dimensions of disasters and its management and mitigation in a step-by-step manner at ward level so as to facilitate micro-level analysis. Through geospatial techniques many possible solutions to tackle such hazards in future are analysed and presented. Questionnaire survey carried out to acquire perceptions of affected population and mental maps sketches illustrated by e them provided their knowledge about disasters in Mumbai and levels of communications which was analysed. It was observed that prejudice, social networks and knowledge about the locality play a significant role in understanding the disasters and methods to mitigate the same in their neighbourhood. The gaps in levels of communications were also brought forward through analysis.
Suggestions are projected for further improvement of the study of disaster management in greater Mumbai [7]. Based on the research findings it is proposed that, there should be awareness among people regarding disasters in their neighbourhood. There is a need for digitalization of facts and thereby bridge the gap between government and local citizens and strengthen interactions between them. Through embedded GIS a predictive model or mobile app should be developed. Scarcity of data should be reduced. There is a dire need to look beyond floods and landslides. Generation of “exit routes“ in time of disaster in the study area is warranted.
In greater Mumbai green initiatives which promote sustainable growth is being initiated. Some of these include eco-friendly housing projects, promotion and development of green spaces such as parks, open grounds, public gardens, rain-water harvesting, plastic ban etc. As these initiatives are gaining momentum it is necessary to educate and encourage the local citizens to adopt these policies and practices. In terms of disaster management these initiatives will prove to be a boon for the city (Figure 11).
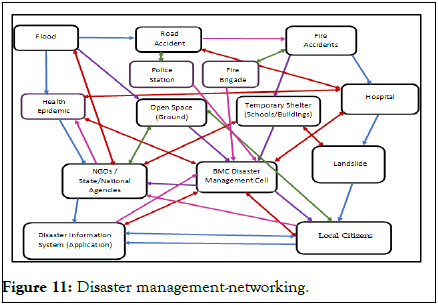
Figure 11: Disaster management-networking.
Disaster networking model for greater Mumbai should have a whole community approach and should be interconnected. According to FEMA (Federal Insurance and Mitigation Administration), “Whole community where residents, emergency management practitioners, organization and community leaders, and government officials can collectively understand and assess the needs of their respective communities when disaster strikes and determine the best ways to organize and strengthen their assets, capacities and interests.”
As per disaster management networking in greater Mumbai, it is proposed that all the stakeholders such as local residents, BMC, NGO's, national and state level agencies should form a strong interconnected network to ensure quick response and action during disasters in the city. The residents especially those who are residing in disaster prone localities should be able to access relief facilities as well as government and private agencies in times of adversity and distress. For example, during floods residents could connect to the disaster information application created and proposed which would guide them to reach out to the nearest open spaces, shelters. Similarly, through the application, BMC could connect with the local citizens and disseminate necessary information to the local citizens. If the network communication is seamless stronger will be the flow of information thereby relief and rescue operation would be accelerated for disaster mitigation, response and recovery would be very effective and successful (Figures 12 and 13) [8].
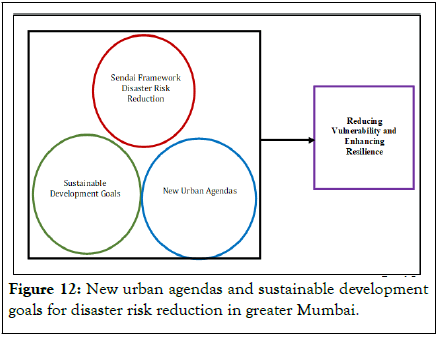
Figure 12: New urban agendas and sustainable development goals for disaster risk reduction in greater Mumbai.
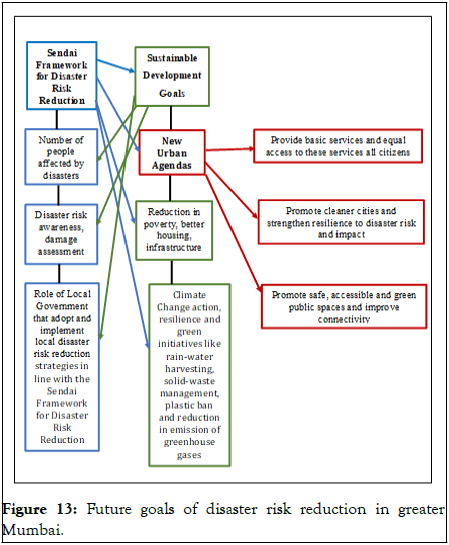
Figure 13: Future goals of disaster risk reduction in greater Mumbai.
Suggestions
Certain suggestions for effective management of disasters in future in greater Mumbai are required.
• Lack of awareness was revealed through questionnaire survey.
It is ascertained that there is general confusion about the
“Wards” term, as per the disaster management plan for the 24
administrative units. Local citizens assume this as electoral
ward or census ward, thus they are not even aware of the BMC
disaster management cell that exists in each of the 24 wards
and are unable to reach out for help. Irrespective of their
background knowledge and education they have a vague idea
about this. Hence in terms of disaster management people
should be made aware of their respective residing wards and
points of contacts in each of the ward.
• Scarcity of data is a crucial hindrance for disaster management
planning and implementation. In order to carry out in-depth
analysis and research, ward-wise disaster data has to be
compiled. However, there is a dearth of the data and only
contemporary data is made available and not for past years.
This research provide justification for requirement of data
bank regarding data related to disasters and suggests
concerned authorities to make temporal data for each and
every disaster available so that some trends can be observed
and analysed and future trends can be predicted using
geographic methods.
• Reaching out to local citizens: The perception analysis made
it very clear that government bodies and other local agencies
should bridge the gap and reach out to local people to
mitigate disasters in future by disseminating information and
educating them in-order to make the city resilient in future.
• Digitalization: There is a need to digitalize data and constantly
update it so that effective management of disasters can be
carried out in future. Virtual representation is important.
• Geographic Information System (GIS): In the upcoming
disaster management plan of greater Mumbai, geospatial
analysis should be made use of, this would enhance the
present plan and help keep informed about resources and
vulnerable areas; it will aid in policy makers to formulate
plans and allocate resources and make use of transport network
for managing disasters.
• Looking beyond floods and landslides: The present research
also emphasizes on the fact that apart from floods and
landslides which are no doubt a matter of great concern in
Mumbai, other disasters such as road accidents, fires and
health epidemics should also be given importance as these
also pose a great threat. Thus it is proposed that the
future disaster management plan should have solutions to
tackle all such disasters.
• Exit routes: This explorative research advocates importance of
exit routes using GIS in times of distress. It is emphasized,
not only during floods, but during other disasters too people
need to know where to go and using which route one has to
reach to a secured location. GIS technology has proved to
be an invaluable tool for integrating different sources of
data. Furthermore, it is recommended that a GIS platform
would describe evacuation and exit routes, including the
nearest locations for evacuation.
• In order to build a predictive model for future data is needed.
Hence the study was an endeavour for real time mapping for
visualisation and analysis of disaster scenario of Mumbai as a
resilient city in future.
• In order to strengthen interaction between various social
networks and the government various age groups, classes,
religious and social groups should get a common platform to
reach out to the government and problems should be tackled
collectively one strong point of contact should be developed
and networks should be strengthened to enable smooth flow of
information for help.
• Maps to apps: This research has brought forth optimal
solutions and challenges and issues using GIS as a
technique for management of disasters. The study can
provide an opportunity to various agencies to collaborate and
develop an app which can be made freely available to local
citizens and keep them alert and informed. Such an app is expected from the government by most of the citizens who
were interviewed for questionnaire survey. Thus it is
proposed that app should be developed which will not only
bring forth the importance of geographical approach and
maps but will also curb unnecessary rumors and
misinformation and deal with disasters more effectively in
future.
Since a long time, disaster researchers have emphasized the role of Geographic Information Systems (GIS) for effective management of disasters. Disasters as it is known are severe, sudden and on a large-scale. During such times response may be quick but recovery takes time. Thus it is vital to focus more on Preparedness and mitigation, as during these phases of disaster management, the magnitude as well as loss occurring can be minimized to a great extent; even though it is not possible to avoid it completely.
Decision support techniques and geospatial analysis would detect the availability of resource in management of disaster affected areas of greater Mumbai. The different aspects and magnitude would aim at assisting in disaster response. Disaster insurance coverage remains surprisingly low even in high-risk areas in greater Mumbai. Private individuals would under-invest in disaster mitigation policies because some of the economic damage in the form of indirect losses would be felt not by individuals directly affected, but by others. Large-scale disasters cause significant collateral damage and macroeconomic distortions impact the wider population. Government exerts a strong influence on disaster costs. Infrastructure such as roads, ports, airports, power lines etc. are built. Governments could thus directly impact the quality of these constructions. Other problems are collective action problems, information asymmetries and myopic behaviour of economic actors. Authorities could step in to correct failures. There could be discouragement or even ban on settlement in particularly high-risk areas of Greater Mumbai viz. proposal for reclamation of land and salt pan lands for development purpose and for provision of affordable housing. They can pass strictly enforce disaster-proof programmers. Policies enacted by authorities in high disaster propensity areas typically cannot fully prevent natural disaster damage in greater Mumbai. Small-scale damage is often unavoidable and essentially random. Damages caused are sometimes due to political and economic reasons. Policies that can mitigate large-scale damage for most of the time have a higher likelihood of experiencing an outlier disaster event with extreme damage.
Some of the future agendas and policies of greater Mumbai should be included on the lines of New Urban Agendas (NUA), Sustainable Development Goals (SDGs) and Disaster Risk Reduction (DDR) of Sendai framework. These policies and agendas ensure macro as well as micro development of cities with special focus of sustainable development. Disaster risk model based on these programmes and policies will ensure safer cities as well as inclusive disaster mitigation practices. Best practices for disaster mitigation and management can be adopted for greater Mumbai by incorporating these agendas and policies. The proposed framework of the three goals such as NUA, SDGs and DDR should be implemented in greater Mumbai.
The future goals for greater Mumbai in terms of disaster risk reduction and management as stated in Figure 13. Emphasise that Mumbai can become a resilient city by 2030 by adopting The Sendai framework for disaster risk reduction, adopted at the third UN world conference on disaster risk reduction, and as the successor instrument to the Hyogo framework for action, is a 15 years, voluntary, non-binding agreement, with seven targets and four priorities for action.
The 2030 agenda for sustainable development recognizes and reaffirms the urgent need to reduce the risk of disasters. In addition to direct references to the outcomes of the third UN conference on DRR (Sendai framework), there are specific opportunities to achieve SDGs (Sustainable Development Goals) through reducing disaster risk. For example, by reducing exposure and vulnerability of the poor to disasters or building resilient infrastructure. There are also several SDGs and targets that can contribute to reducing disaster risk and building resilience, even where disaster risk reduction is not explicit.
According to a study by US based media agency Zenith, smartphone ownership globally will continue to expand in 2018. The agency said that 66 percent of individuals in 52 countries will own a smartphone in 2018 up from 63 percent in 2017. "The increased use of smartphone and other mobile devices means more frequent contact between people. It also gives individuals more opportunities to connect with media content wherever they are, at any time of the day. The study expected that smartphone ownership would rise to 59 percent in 2018 and 62 percent in 2019.
India currently has in between 300 million-400 million smartphone users. There are about 650 million mobile phone users in India, and just over 300 million of them have a smartphone, according to counterpoint research. Two out of three Indian mobile users or roughly 433 million people are planning to upgrade their phones in the next year. The number of internet users in India is expected to reach 450 million-465 million said a recent study from the Internet and Mobile Association of India (IAMAI) and market research firm IMRB (Indian Market Research Bureau) international. The report said overall internet penetration in India is currently around 31 percent.
Mumbai has highest number of internet users in India. 16.4 million people living on this island city access the web. Most of the increased internet usage is seen among lower-income groups of greater Mumbai. Thus in terms of disaster management in greater Mumbai, if a GIS based Disaster Information System (DIS) application is introduced to the local citizens a platform for interaction as well as execution and implementation of action plan during disasters could be carried out. This application would benefit people by and large as it will be a source of standardized information regarding city and neighbourhood.
[Crossref] [Google Scholar] [Pubmed]
Citation: Chande P, Mukherji D (2023) Initiating a Disaster Information System (DIS) to Analyse and Mitigate the Footprints of Disasters in Greater Mumbai. J Geogr Nat Disasters. 13:271.
Received: 22-Feb-2023, Manuscript No. JGND-23-21899; Editor assigned: 24-Feb-2023, Pre QC No. JGND-23-21899 (PQ); Reviewed: 10-Mar-2023, QC No. JGND-23-21899; Revised: 03-May-2023, Manuscript No. JGND-23-21899 (R); Published: 10-May-2023 , DOI: 10.35841/2167-0587.23.13.271
Copyright: © 2023 Chande P, et al. This is an open-access article distributed under the terms of the Creative Commons Attribution License, which permits unrestricted use, distribution, and reproduction in any medium, provided the original author and source are credited.