
Immunotherapy: Open Access
Open Access
ISSN: 2471-9552

ISSN: 2471-9552
Research Article - (2022)Volume 8, Issue 5
Recent studies have indicated the crucial role of the immune system in the pathogenesis and progression of Endometriosis (EM). This study aims to identify the signature of immune cell infiltration and the immune-related diagnostic biomarkers of EM through multi-bioinformatics analysis. Through the xCell algorithm calculating the common dataset of EM, we found that macrophages and neutrophils constitute the most infiltrating immune cells in the endometrium tissue. We identified 816 Differentially Expressed Genes (DEGs) between EM lesions and normal endometrium. We also constructed the Weighted Gene Co-expression Network Analysis (WGCNA) to identify the immune-related hub module. The Venn diagram of the hub module, DEGs, and the immune-related genes identified four immune-related hub genes of EM (TNFSF13B, IL7R, CSF1R, and LEP), which were all significantly up regulated in the lesions of EM than that of controls. Furthermore, we utilized multiple independent datasets to validate our results. The area under the ROC curves (AUC) of those hub genes for disease diagnosis was higher than 0.8. We also find that those hub genes were connectively concerned with the common complication infertility of EM.
Endometriosis; Ectopic lesion; Immune infiltration; Diagnostic biomarker; Bio informatics analysis
Endometriosis (EM) is characterized by the presence of functional endometrial glands and stroma outside the uterine cavity, with the most common locations for the Ectopic Endometria (EC) being the ovaries. About 6 to 10% of women of reproductive age have been suffering from this disease, with a series of annoying symptoms, including dysmenorrhea, chronic pelvic pain, and infertility [1,2]. Despite decades of research, the etiology and pathogenesis of endometriosis remain unclear. Multiple theories exist regarding its etiology, including the retrograde menstruation theory, hormonal conditions, gene profiles, and immune disturbances [3]. Laparoscopy is currently the “gold standard” to diagnose and stage endometriosis. However, the mean latency between the onsets of symptoms to definitive (surgical) diagnosis is 6.7 years [4]. Therefore, we must explore the molecular mechanisms and novel diagnostic biomarkers underlying endometriosis.
Mounting research suggests that disturbed local and systemic immune systems are involved in the poor clearance and persistence of ectopic endometria of EM [1,5,6]. In the ectopic lesions of EM, the immune environment is different from that within normal endometria. For example, abnormalities in various cell types increased levels of activated peritoneal macrophages, abnormal activation of T and B lymphatic cells, and various pro inflammatory and regulatory cytokines [7-9]. Abnormal activated immune cells at and around endometriotic lesion sites can induce the release of a range of proinflammatory mediators and cytokines, which were proved to promote the persistence of lesions [6,10]. What's more, disturbed local and systemic immune systems in women with endometriosis could increase rates of implantation failure and contribute to infertility in women with endometriosis [11].
Over the last decades, with the advancement and availability of high-throughput technologies, microarrays, and RNA sequencing, large-scale transcriptome data could provide a comprehensive understanding of the molecular mechanisms underlying diseases we are concerned with [12,13]. We use the novel gene signature method xCell (http://xCell.ucsf. edu/) to investigate seven types of infiltration immune cells [14]. The weighted gene co-expression network analysis (WGCNA) can screen gene modules closely related to concerned diseases by analyzing the correlation between genomic and clinical information, thus providing more opportunities for further research [15]. The Immunology Database and Analysis Portal (ImmPort) repository, applied in the validation of the methods used in the original studies, leveraging studies for meta-analysis, or generating new hypotheses, is an online database created for better immunology research in the future [16,17]. In this study, we attempt to analyze the novel, for the first time, biomarkers related to immune cell infiltration and explore ectopic endometria of EM patients and explore its clinical characteristic using multi-bioinformatics analysis.
Data collecting
The gene expression microarrays of GSE141549 downloaded from the GEO database, were based on GPL10558 (Illumina HumanHT-12 V4.0 expression beadchip) and GPL13376 (Illumina HumanWG-6 v2.0 expression beadchip) platforms and have been initially corrected to move the batch effects and combined [18]. It included 408 samples obtained from healthy and patient endometrium, peritoneum, and endometriosis lesions. A total of 134 samples, including 102 Ectopic lesions (EC) of Endometriosis (EM) patients and 32 Normal Endometria (NE) of healthy people without hormonal medication, were enrolled for further analysis. The raw data can be availably downloaded and analyzed from NCBI-GEO.
Assessment of immune cell infiltration
The gene expression matrix was uploaded to the online tool named xCell (https://xcell.ucsf.edu/) [14]. We choose the “Rooney signature (N=7)” column to calculate the relative proportions of seven types of infiltration immune cells in EC and NE samples, including B cells, CD4+T cells, CD8+T cells, Dendritic (DC) Cells, macrophages, Natural Killer (NK) cells, and neutrophils. We further use the heat map to display the constitution of immune infiltrated cells in the endometrium tissue.
Construction of the weighted gene co-expression network analysis (WGCNA) and identification of the hub module related to immune cells
The gene co-expression networks of EC samples were constructed by the WGCNA package, and the proportion of immune infiltrated cells was input as WGCNA trait data to identify the hub module [15]. The Pearson test (P<0.05) was used to calculate the correlation between module Eigen genes and immune cells, and the module most relevant to immune cells was selected and defined as the hub module.
Screening of the differentially expressed genes (DEGs)
The downloaded matrix was used to screen the Differentially Expressed Genes (DEGs) of EC samples with the limitation of |log2 fold change (FC)|>1 and an adjusted P-value of <0.05 by the limma package. In addition, the differential expression of those hub genes in EC and NE samples was analyzed by the Wilcoxon test and visualized using the ggplot2 package.
Function enrichment analyses
Search Tool for the Retrieval of Interacting Genes/Proteins (STRING) database (http://string-db.org/) was used to identify the interactions among the genes. Furthermore, Cytoscape 3.8.2 (https://cytoscape.org/) was used to analyze its connectivity degree and visualize the protein-protein interaction (PPI) network [19,20]. Next, the functional analyses including Gene Ontology (GO) terms and Kyoto Encyclopedia of Genes and Genomes (KEGG) pathways were annotated and visualized using the ‘clusterProfiler’, ‘org.Hs.eg.db’, ‘topGO’, ‘pathview’, and ‘ggplot2’ packages of R [21].
Identification of immune infiltration-related biomarkers for EM
The hub genes were recognized using the Venn diagrams of the overlapping genes identified from the hub module, DEGs, and Immune-Related Genes (IRGs). IRGs were downloaded from the ImmPort database, which disseminates data to the public for the future of immunology [17].
Statistical analysis
All statistical analyses were performed using R software (version 4.1.0, https://www.r-project.org). The Wilcoxon rank-sum test was applied to compare the immune signatures and expression of genes between two groups. The Pearson test was used to calculate the correlation. A p-value of <0.05 was considered statistically significant, and statistical p values were all two-side.
Gene expression signatures of the ectopic lesion of endometriosis (EM)
Figure 1A was the flowchart of the analysis procedures in this study. A total of 134 endometrial samples and 19746 genes in the GSE141549 profile were included for further research. The boxplot of this dataset was shown in Figure 1B. A total of 816 Differentially Expressed Genes (DEGs) were identified from Ectopic lesions (EC) of endometriosis (EM) patients and Normal Endometria (NE) samples, consisting of 334 down regulated and 482 up regulated genes (Figure 2A). Gene Ontology (GO) terms and Kyoto Encyclopedia of Genes and Genomes (KEGG) analyses of DEGs indicated that complement and coagulation cascades, cytochrome P450 were significantly enriched (Figures 2B and 2C), which indicated that the dysfunction of the immune system and inflammation were connectively associated with the ectopic lesions of EM.
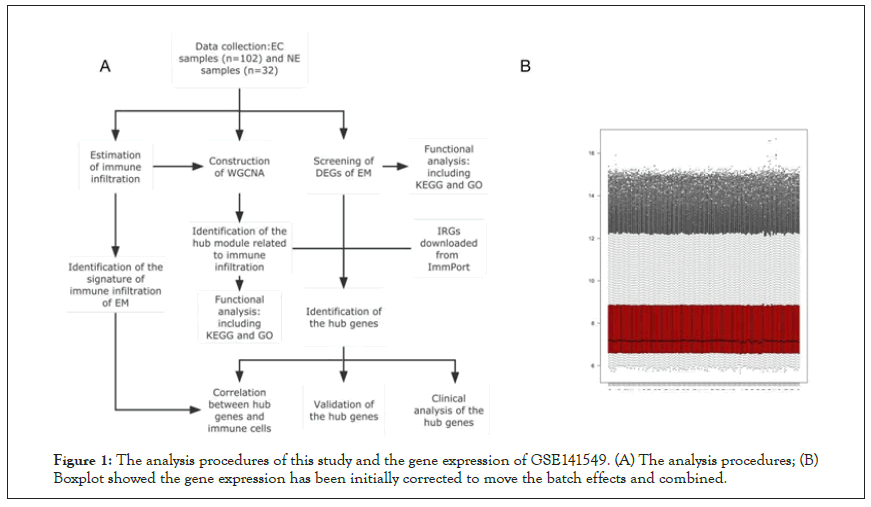
Figure 1: The analysis procedures of this study and the gene expression of GSE141549. (A) The analysis procedures; (B) Boxplot showed the gene expression has been initially corrected to move the batch effects and combined.
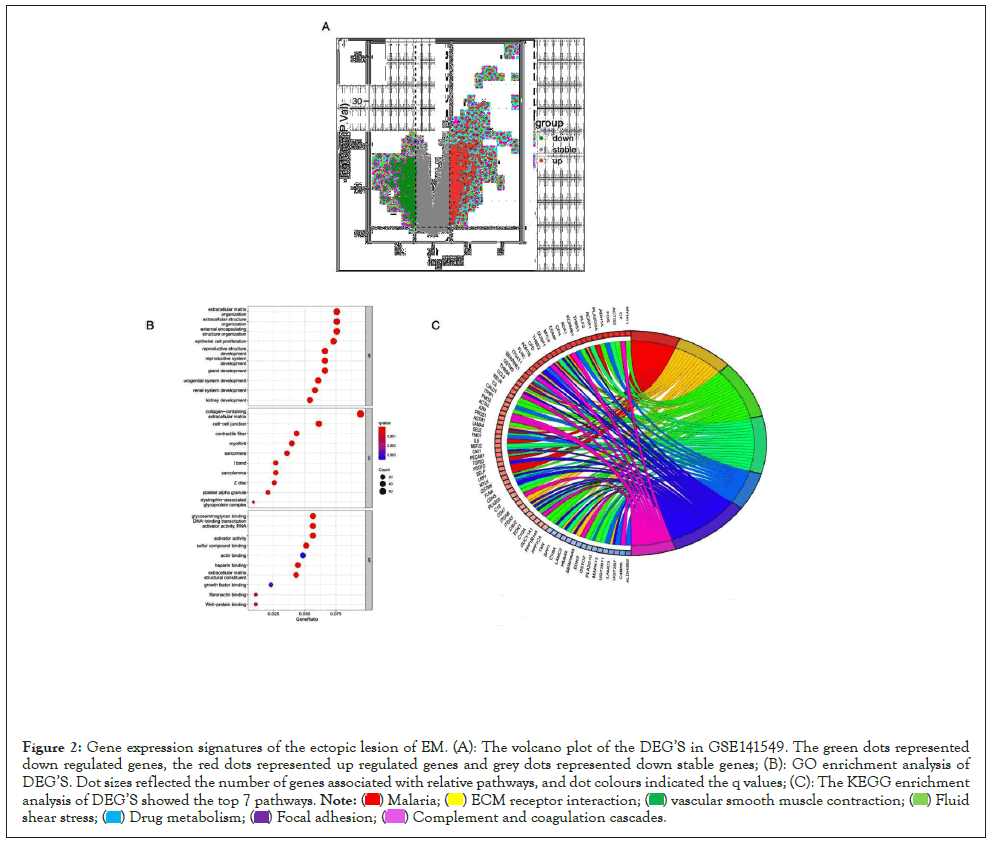
Figure 2: Gene expression signatures of the ectopic lesion of EM. (A): The volcano plot of the DEG’S in GSE141549. The green dots represented down regulated genes, the red dots represented up regulated genes and grey dots represented down stable genes; (B): GO enrichment analysis of DEG’S. Dot sizes reflected the number of genes associated with relative pathways, and dot colours indicated the q values; (C): The KEGG enrichment analysis of DEG’S showed the top 7 pathways.


Signature of the immune infiltration of EM
Seven types of infiltrating immune cells in the endometrium tissue were estimated by the xCell algorithm and shown in the heat map and boxplot. In the heat map of Figure 3A, macrophages and neutrophils constitute the most infiltrating immune cells in the endometrium tissue. In the boxplot of Figure 3B, the composition of CD4+T cells, B cells, macrophages, and neutrophils were significantly higher in EC samples than in NE samples. Notably, NK cells were significantly lower than that of controls. We further use the Pearson test (p<0.05) to evaluate the correlation among seven types of immune cells. Most of the immune cells in the endometrium tissue were highly positively correlated, which indicated that immune infiltration is so interconnected. For example, neutrophils had a significantly high relationship with macrophages (R2=0.76, p<0.05) and B cells (R2=0.57, p<0.05).
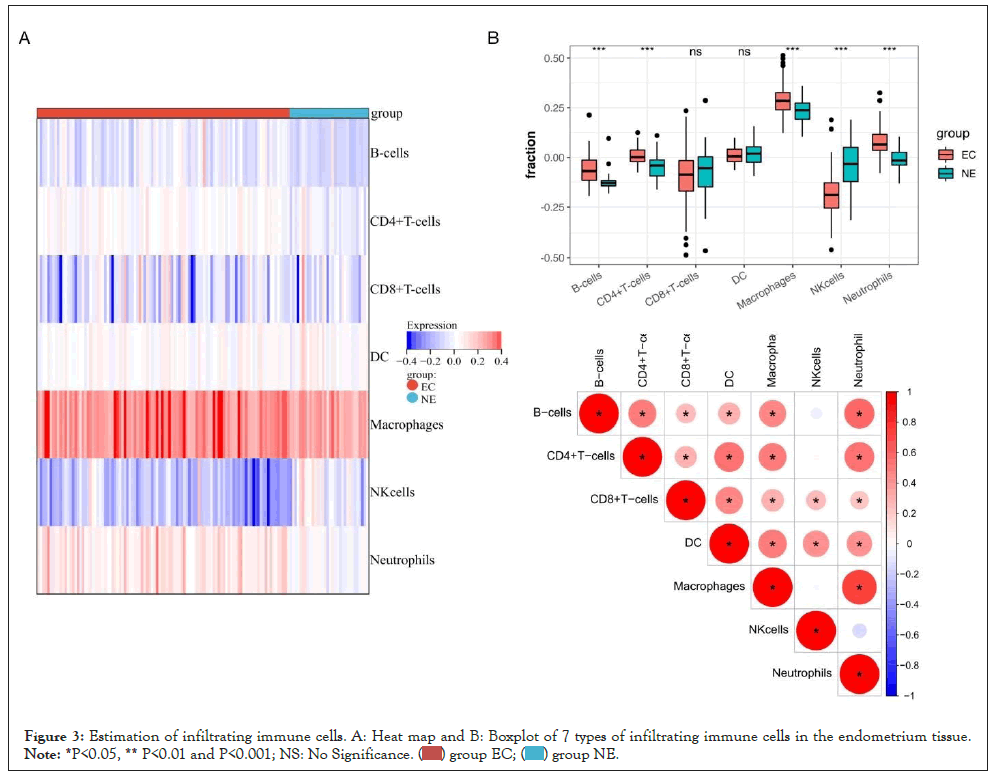
Figure 3: Estimation of infiltrating immune cells. A: Heat map and B: Boxplot of 7 types of infiltrating immune cells in the endometrium tissue. Note: *P<0.05, ** P<0.01 and P<0.001; NS: No Significance. 
Construction of WGCNA and identification of the hub module
The top 30% variation coefficient of genes (5924 genes) in 102 EC samples and the composition of 7 immune infiltrated cells corresponding to 102 EC samples were input to establish the co-expression networks and identify the hub module related to immune cells using the WGCNA package of R (Figure 4A). When the soft-thresholding power was eight, a scale-independent topological network was established (Figure 4B). Genes were classified into different modules using the dynamic hybrid cutting method, and the minimum module size cut-off value was 100. A total of nine gene modules were ultimately identified with the dynamic tree cutting method which was enforced for the construction of a hierarchical clustering tree by splitting the dendrogram at relevant transition points and the modules with a difference of <0.25 were combined (Figure 4C).
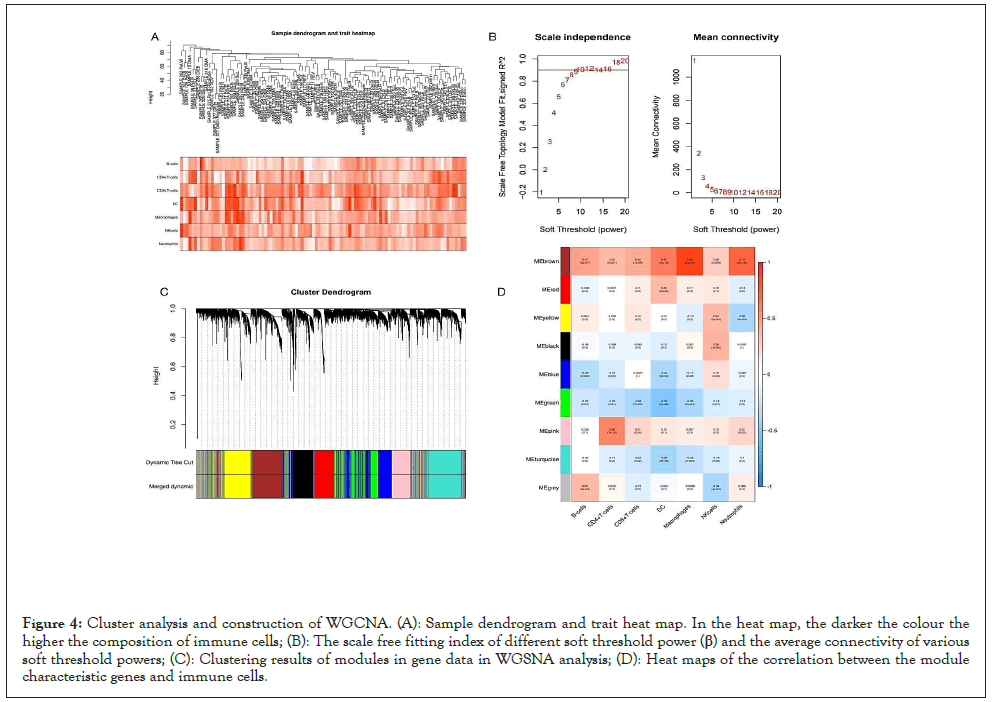
Figure 4: Cluster analysis and construction of WGCNA. (A): Sample dendrogram and trait heat map. In the heat map, the darker the colour the higher the composition of immune cells; (B): The scale free fitting index of different soft threshold power (β) and the average connectivity of various soft threshold powers; (C): Clustering results of modules in gene data in WGSNA analysis; (D): Heat maps of the correlation between the module characteristic genes and immune cells.
To determine the hub module, the correlation between the module and the composition of seven immune cells was calculated using the Pearson test (P<0.05). In nine modules, the brown module, consisting of 803 genes, was highest related to macrophages (R2=0.89, p=5e-36), neutrophils (R2=0.73, p=2e-18), DC cells (R2=0.62, p=5e-12), B cells (R2=0.47,p=5e-07), and CD8+ cells (R2=0.42, p=1e-05) and considered to be the hub module related to immune infiltration (Figure 4D).
Functional analyses of the hub module
We constructed the Protein-Protein Interaction (PPI) network of the hub module and selected 16 central nodes with a connective degree >20 (Figure 5A). Furthermore, the genes of the hub module were annotated for biological functional analysis. According to GO and KEGG analysis, most of the genes were involved in allograft rejection, antigen processing and presentation, cell adhesion molecules, lysosome, and phagosome (Figures 5B and 5C).
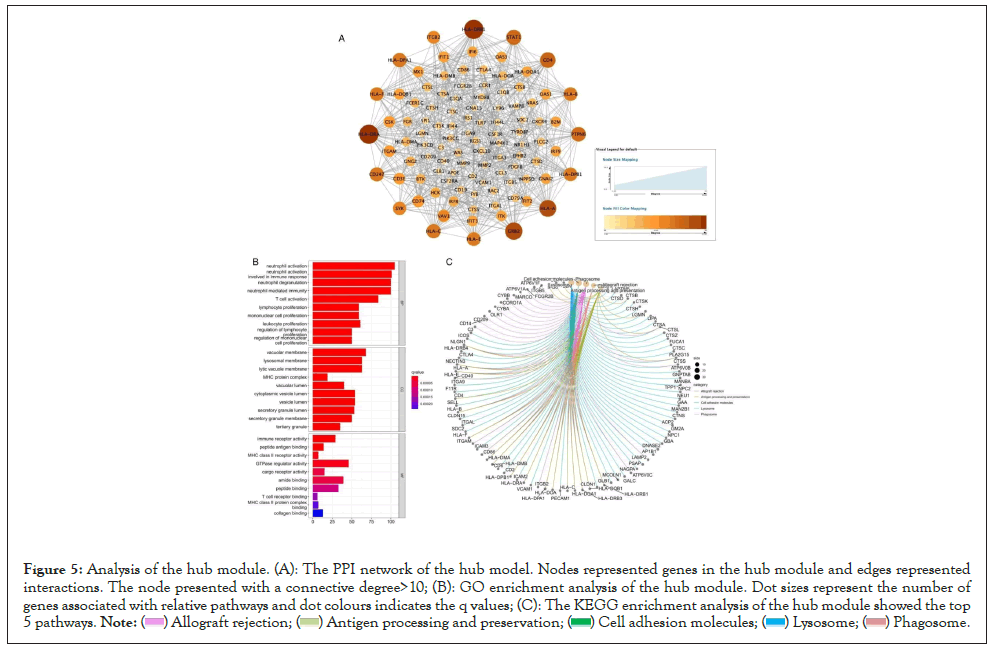
Figure 5: Analysis of the hub module. (A): The PPI network of the hub model. Nodes represented genes in the hub module and edges represented interactions. The node presented with a connective degree>10; (B): GO enrichment analysis of the hub module. Dot sizes represent the number of genes associated with relative pathways and dot colours indicates the q values; (C): The KEGG enrichment analysis of the hub module showed the top 5 pathways. 

Identification and validation of immune infiltration-related biomarkers for EM
There were 1793 Immune-Related Genes (IRGs) downloaded from the ImmPort database. In the Venn diagram of the brown module, DEGs and IRGs mentioned above Figure 6A, seven shared genes (LEP, C3, SLPI, S100A8, TNFSF13B, IL7R, CSF1R) were recognized and put into the string database. Because the immune response is so interconnected, the hub genes were defined as the genes that interacted with each other among the seven shared genes mentioned above, including TNFSF13B, IL7R, CSF1R, and LEP (Figures 6B and 6C). In Figure 6C, the expression of those hub genes in EC was significantly higher than that of controls. The independent validation profiles GSE7305 and GSE23339 were also downloaded from the GEO database and separately contained 10 paired EC and NE samples, 10 EC and 9 NE samples [22,23]. The expression of those 4 hub genes in GSE7305 and GSE23339 was significantly consistent with our results (Supplemental Figures 1A and 1B).
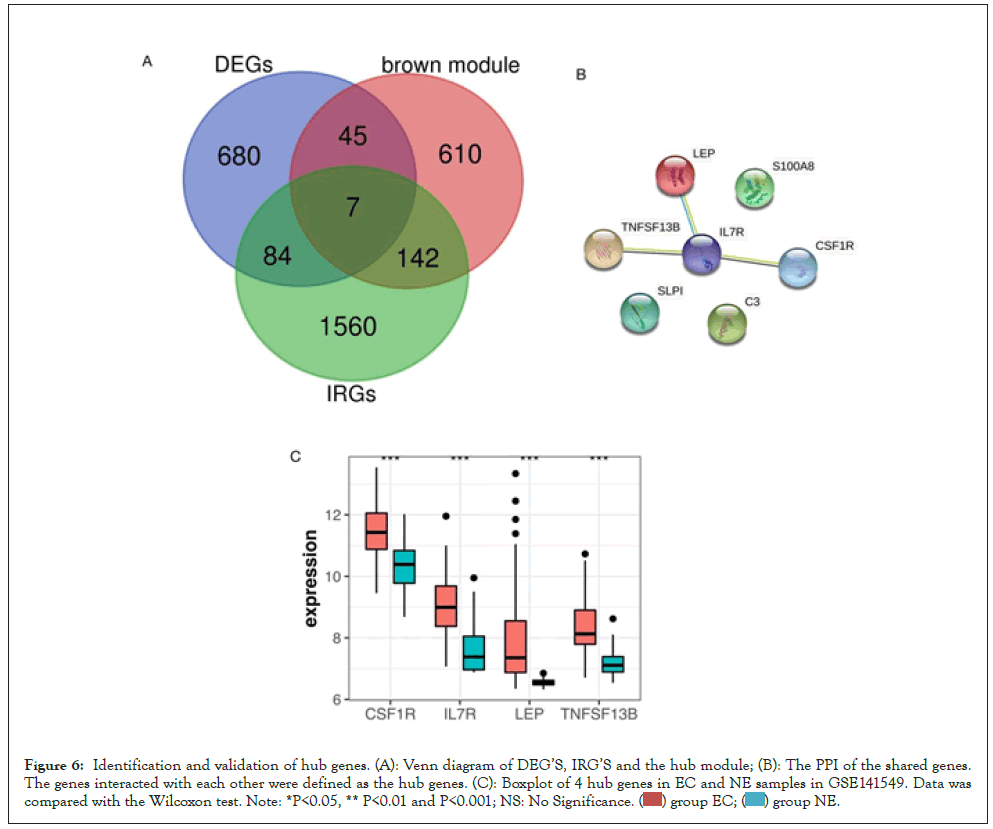
Figure 6: Identification and validation of hub genes. (A): Venn diagram of DEG’S, IRG’S and the hub module; (B): The PPI of the shared genes. The genes interacted with each other were defined as the hub genes. (C): Boxplot of 4 hub genes in EC and NE samples in GSE141549. Data was compared with the Wilcoxon test. Note: *P<0.05, ** P<0.01 and P<0.001; NS: No Significance.
Identification of clinical characteristics of hub genes
Receiver Operating Characteristic (ROC) curves of those hub genes to distinguish between endometriosis patients and normal people were shown in Figure 7A. The area under the ROC curves (AUC) of 4 hub genes for disease diagnosis were higher than 0.8, with LEP being the maximum 0.906 and CSF1R being the minimum 0.834. The independent dataset GSE120103 contained 9 paired eutopic endometrium tissue samples of fertile (EM-F) or infertile (EM-IF) women undergoing endometriosis [24]. As shown in Figure 7B, the expression of TNFSF13B, IL7R, and LEP in EM-IF was significantly higher than that of in EM-F, while CSF1R was much lower. Therefore, we inferred that those four hub genes could also play a crucial role in the common complication infertility of EM.
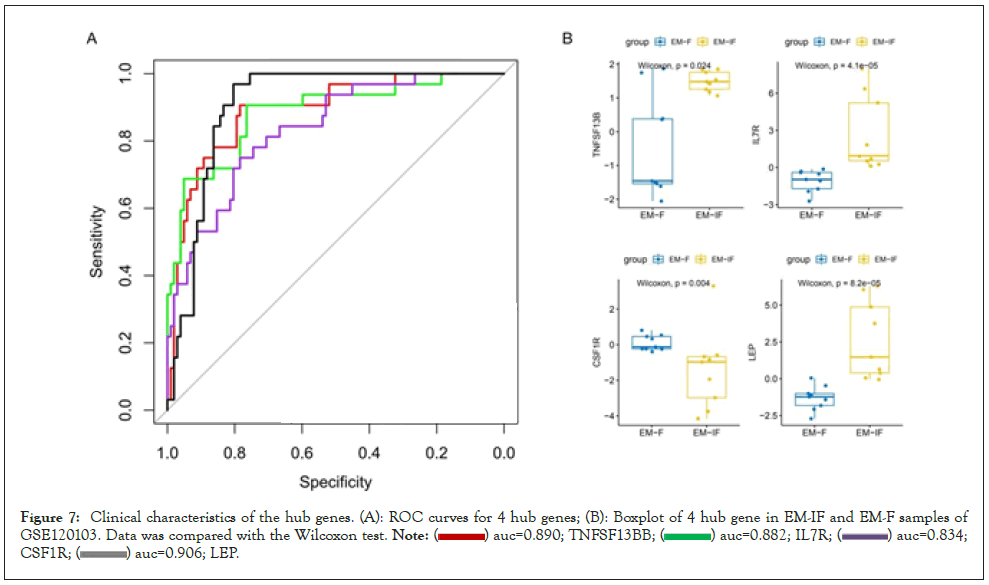
Figure 7: Clinical characteristics of the hub genes. (A): ROC curves for 4 hub genes; (B): Boxplot of 4 hub gene in EM-IF and EM-F samples of GSE120103. Data was compared with the Wilcoxon test.


Correlation between biomarkers and immune infiltrated cells
The correlation among four hub genes (TNFSF13B, IL7R, CSF1R, LEP) and 7 types of immune infiltrated cells (B cells, CD4+T cells, CD8+T cells, DC cells, macrophages, NK cells, neutrophils) was analyzed by the Pearson test and presented in Figure 8A. The hub genes were positively correlated with the composition of immune cells except for NK cells. For example Figures 8B and 8C, TNFSF13B was positively related to B cells (R2=0.60, p<2.2e-16), and CSF1R was positively related to macrophages (R2=0.79, p<2.2e-16).
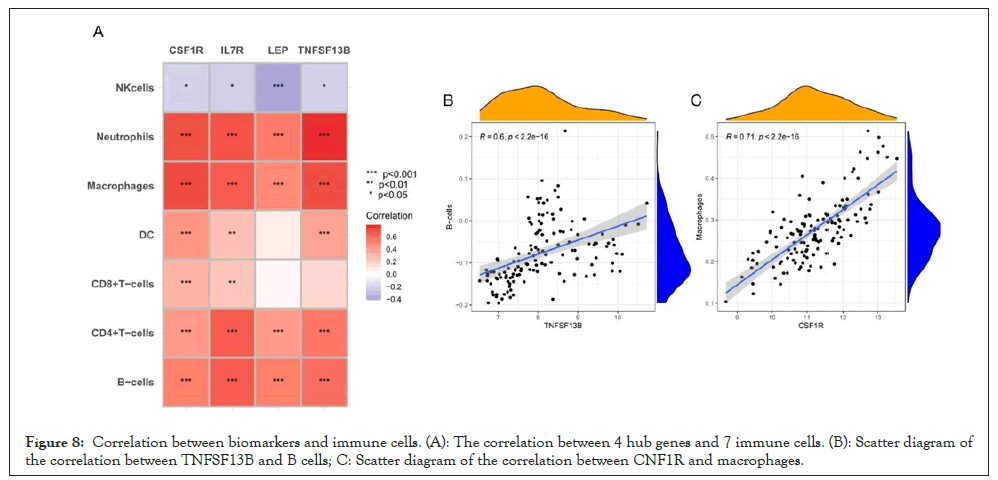
Figure 8: Correlation between biomarkers and immune cells. (A): The correlation between 4 hub genes and 7 immune cells. (B): Scatter diagram of the correlation between TNFSF13B and B cells; C: Scatter diagram of the correlation between CNF1R and macrophages.
Endometriosis is a common gynecological disease whose origin and pathogenesis are yet unknown. Retrograde menstruation theory proposed by Sampson that menstrual debris could pass through the fallopian tubes and implant into the abdominal cavity in a retrograde way is widely accepted. While retrograde menstruation occurs in about 90% of menstruating women, the prevalence of endometriosis is only about 6 to 10% of women of reproductive age [3,25]. It indicated that retrograde menstruation theory does not adequately explain the pathogenesis of this disease. Therefore, there must be other possible explanations for it. A well-functioning immune system could eliminate ectopic endometrial cells from the peritoneal cavity. New findings on the genetics, immunological dysfunction, intrinsic abnormalities, and secreted products of endometriotic lesions are associated with the reduced clearance of endometrial fragments and also could facilitate the persistence of endometriosis lesions [25].
Through comprehensive bioinformatics analyses of the common dataset GSE141549, we compared the immune infiltration between EC and NE samples by the xCell algorithm. The results showed that macrophages and neutrophils were the most infiltrating immune cells in the endometrium tissue, and the composition of CD4+T cells, B cells, macrophages, and neutrophils was significantly higher in EC samples than in NE samples. Notably, NK cells were significantly lower than that of controls. In a further step, we constructed the gene co-expression networks through the 'WGCNA' package and selected the composition of immune infiltrated cells as WGCNA trait data. We identified nine gene modules with the dynamic tree cutting method. The brown module, consisting of 803 genes, was the highest related to most immune cells like macrophages and neutrophils. Limma analysis identified 816 DEGs from EC and NE samples with the limitation of |log2 Fold Change (FC)|>1 and an adjusted P-value of <0.05. It consisted of 334 down regulated genes and 482 up regulated genes.
Through the GO and KEGG functional analysis of DEGs, we found that the dysfunction of the immune system and inflammation contributed a lot to the ectopic lesions of endometriosis. The brown module, DEGs, and IRGs mentioned above were put into the Venn diagram and STRING database. The overlapping genes that interacted with each other were defined as the hub genes related to immune infiltration of EM, including TNFSF13B, IL7R, CSF1R, and LEP. And those hub genes were positively correlated with the composition of most immune cells.
In our study, the expression of those hub genes in EC was significantly higher than that of controls. And the AUC curves of 4 hub genes to distinguish endometriosis patients and controls were all higher than 0.8, with LEP being the maximum 0.906 and CSF1R being the minimum 0.834. Further, we used the independent datasets GSE7305 and GSE23339 to validate the hub genes, and the results were consistent with our results mentioned above. In an independent dataset GSE120103, the expression of TNFSF13B, IL7R, and LEP in EM-IF was significantly higher than that of in EM-F, while CSF1R was much lower. Therefore, we inferred that those four hub genes were also connectively associated with the common complication infertility of EM.
The protein encoded by TNFSF13B is a cytokine that belongs to the Tumor Necrosis Factor (TNF) ligand family. This cytokine, a potent B lymphocyte stimulator (BlyS), is produced by macrophages and is necessary for normal B cell differentiation and proliferation [26]. Notably, high levels of BlyS overstimulate various B cell responses, leading to other conditions such as autoimmune diseases, allergic diseases, infections, and malignancies [27]. It reported that the -817C⁄T in the promoter region of this gene was possibly associated with idiopathic infertility in the Brazilian population [28].
The protein encoded by IL7R is a receptor for interleukin 7 (IL7). IL7 and IL7R are crucial for innate lymphoid cell development and maintenance and are also implicated in autoimmune and chronic inflammatory diseases, as well as in cancer [29]. There are also emerging reports of IL7R signaling contributing to the progression of lymphoid malignancies such as T cell acute lymphoblastic leukemia and its effective anti-IL7R targeting antibody therapies [30]. However, the role of IL7R in endometriosis disease remains unexplored.
The protein encoded by CSF1R is the receptor for Colony-Stimulating Factor 1 (CSF1), a cytokine that controls the production, differentiation, and function of macrophages. This receptor mediates most of the biological effects of this cytokine. CSF1 interaction with CSF1R is associated with the growth, invasion, and metastasis of several types of cancer, including breast and endometrial cancers [31,32]. In our study, the expression of CSF1 was significantly higher in EC than in NE samples. Increased CSF1R levels have been implicated in the pathogenesis of endometriosis. It also suggested that endometrial tissue involved in lesion formation is highly responsive to CSF-1 signaling [33,34].
Leptin (LEP) encodes a protein secreted by white adipocytes into the circulation and plays a crucial role in regulating energy homeostasis. Apart from its metabolic properties, leptin is also involved in the regulation of immune and inflammatory responses, hematopoiesis, angiogenesis, and reproduction [35-37]. Recent studies reported that leptin is increased in peritoneal fluid from primary infertility women with endometriosis. In addition, the correlation between leptin levels and the endometriosis stage is significantly positive [38,39].
There was still a certain degree of limitation in our study. Our study mainly focused on genomic data of EM samples obtained from the GEO databases, while no our own samples to validate our results. Further investigations of these hub genes are necessary to identify the molecular mechanism and validate their immunotherapy effect on EM. These limitations will be conducted in the next step of our research.
Our study found that macrophages and neutrophils were the majority infiltrating immune cells in the endometrium tissue. Through multi-bioinformatics analysis, we identified four immune-related hub genes of EM (TNFSF13B, IL7R, CSF1R, and LEP), which were all significantly up regulated in the lesions of EM than controls. We also utilized multiple independent datasets to validate our results. The AUC curves of those hub genes for disease diagnosis were higher than 0.8. We also inferred that those four hub genes could also play a crucial role in the common complication infertility of EM.
[Crossref][Google scholar][PubMed].
[Crossref][Google scholar][PubMed].
[Crossref][Google scholar][PubMed].
[Crossref] [Google scholar] [PubMed].
[Crossref][Google scholar][PubMed].
[Crossref][Google scholar][PubMed].
[Crossref][Google scholar][PubMed].
[Crossref][Google scholar][PubMed].
[Crossref][Google scholar][PubMed].
[Crossref][Google scholar][PubMed].
[Crossref][Google scholar][PubMed].
[Crossref][Google scholar][PubMed].
[Crossref][Google scholar][PubMed].
[Crossref][Google scholar][PubMed].
[Crossref][Google scholar][PubMed].
[Crossref][Google scholar][PubMed].
[Crossref][Google scholar][PubMed].
[Crossref][Google scholar][PubMed].
[Crossref][Google scholar][PubMed].
[Crossref][Google scholar][PubMed].
[Crossref][Google scholar][PubMed].
[Crossref][Google scholar][PubMed].
[Crossref][Google scholar][PubMed].
[Crossref][Google scholar][PubMed].
[Crossref][Google scholar][PubMed].
[Crossref][Google scholar][PubMed].
[Crossref][Google scholar][PubMed].
[Crossref][Google scholar][PubMed].
[Crossref][Google scholar][PubMed].
[Crossref][Google scholar][PubMed].
[Crossref][Google scholar][PubMed].
[Crossref][Google scholar][PubMed].
[Crossref][Google scholar][PubMed].
[Crossref][Google scholar][PubMed].
[Crossref][Google scholar][PubMed].
[Crossref][Google scholar][PubMed].
[Crossref][Google scholar][PubMed].
Citation: Zhang K, Zou L, Xie X, Jiang H, Guo S (2022) Integrative Analysis of Gene Expression Profiles to Identify Immune Infiltration-Related Biomarkers: In the Lesion of Endometriosis. Immunotherapy (Los Angel). 8:201.
Received: 05-Sep-2022, Manuscript No. IMT-22-18632; Editor assigned: 07-Sep-2022, Pre QC No. IMT-22-18632 (PQ); Reviewed: 22-Sep-2022, QC No. IMT-22-18632; Revised: 29-Sep-2022, Manuscript No. IMT-22-18632 (R); Published: 06-Oct-2022 , DOI: 10.35248/2471-9552.22.08.201
Copyright: © 2022 Zhang K, et al. This is an open-access article distributed under the terms of the Creative Commons Attribution License, which permits unrestricted use, distribution, and reproduction in any medium, provided the original author and source are credited.