Journal of Geography & Natural Disasters
Open Access
ISSN: 2167-0587
ISSN: 2167-0587
Research Article - (2024)Volume 14, Issue 4
The Iranian plateau is one of the most active and seismic areas, which is located in the Alpine-Himalayan seismic belt. This area has experienced many devastating earthquakes. The study of seismic behavior and the occurrence pattern of aftershocks of medium to large earthquakes can be important for this region. Twenty six earthquakes larger than 5 have been selected on the Iranian plateau in the last ten years to investigate their aftershocks behaviour. First the seismic parameters Mc, a and b-value were estimated by using the maximum likelihood estimation method in ZMAP software. Then, events less than Mc were removed from the catalog. The remaining catalog was used to determine the parameters p, c and k in the modified Omori law for each event separately. The average value of p in Alborz and Zagros are obtained 1.08 and 1.05, respectively, while this value is obtained 0.99 for Central Iran. This can be caused by high seismic activity and rapid energy discharge by small earthquakes. Furthermore, in this study, a model for the distribution of the probability function of the waiting time of aftershock sequences of the Iranian plateau has been determined.
Aftershock, Omori law, Iran, Magnitude of completeness, B-value
Each earthquake sequence includes a main earthquake (the largest event) and related events (i.e. foreshocks and aftershocks). The number of aftershocks, spatial distribution and reduction of temporal activity are important parameters (critical parameters) in an earthquake sequence [1]. Of course, some sequences do not have a clear main shock, which is called “earthquake swarm”. Regarding the importance of studying the distribution of aftershocks, we can mention their application in estimating the amount of energy released in most seismic areas, determining the trend of seismic zones, determining the geometry of activated blind faults and the migration trend of aftershocks.
The Iranian plateau is located in the Alpine-Himalayan seismic belt, which is one of the most active and seismic areas. The collision of the Arabian, Indian and Eurasian plates has caused deformation, folding and the occurrence of numerous and destructive earthquakes on the Iranian plateau. Therefore, the study of seismic behavior and the occurrence pattern of aftershocks of moderate to large earthquakes can be important for this region.
The Iranian plateau can be divided into 5 major seismotectonic provinces, including: 1) The continental-continental collision zone of Zagros in southwest Iran; 2) Highly seismic regions of Alborz-Azarbayejan covering north and northwest of Iran, which constitute a part of northern limit of the Alpine-Himalayan orogenic belt; 3) The intraplate environment of Central-East Iran; 4) The continental collision zone of Kopeh Dagh in northeast; 5) The oceanic-continental subduction zone of Makran in southeas as shown in Figure 1. In this study, seismic parameters Mc, a-value and b-value were determined. Then the pattern of aftershocks in these 5 different seismotectonic provinces was determined based on the modified Omori law. In order to better identify all regions and compare them with each other, we tried to cover the data in such a way as to cover most parts of Iran. Also, in this study, earthquakes that have not been investigated in previous studies were considered. Before this, two comprehensive studies have been carried out in this field in the plateau of Iran. Kamranzad et al., investigated the attenuation behavior of 14 moderate to large earthquakes aftershock sequences occurred from 1990 to 2012 [2]. Ommi et al., studied 15 earthquakes from 2002 to 2013 with a similar approach. It is tried to compare the results of this study with previous studies [3].

Figure 1: Location of earthquakes investigated in this study. The boundaries of Iran's seismotectonic provinces are shown with black lines according to Mirzaei et al., [15].
Numerous studies have been performed on the pattern and reduction behavior of aftershocks for different regions and have provided relationships for it [4-8]. The classic Omori law and its modified formula have been used more than any other model [9].
In this model, the number of aftershocks N(t) at time t after the mainshock is written as follows:
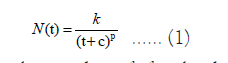
Where k depends on the number of aftershocks in a sequence and p determines the rate of decrease in the number of aftershocks. Parameter c represents the duration of seismic turbulence in the early hours after the occurrence of the main earthquake in the region, after which the decay trend of aftershocks begins. These parameters and essentially the aftershock production rate depend on various properties peculiar to the seismogenic region, such as the tectonic setting, the stress changes along the regional faults, the structural heterogeneities, and the crustal rheology [8-11].
The aftershocks of a seismic sequence must first be extracted. Various temporal and spatial windows have been proposed for this purpose [7,12-14].
In some cases, the decay behavior of aftershocks can be modeled according to equation 1 with a curve and the values of p, c and k (model 1). But we may have one or more secondary sequences and need another p, c, and k in addition to what was determined in model 1, which can be found in three forms: a) One value for p and c, two values for k: in this case, the start and decay rate of the secondary sequence is the same as the primary sequence, but the number of records of the two sequences will be different (model 2); b) One value for c and two values for p and k: In this case, immediately after the occurrence of the main shock, the reduction process is observed, but the rate of decay and the level of seismicity are different during the two sequences (model 3); c) Two values for each of the parameters p, c and k: In this model, the behavior of the two sequences are completely different from each other (model 4). These four models are defined in the ZMAP software and the appropriate model is selected for fitting the aftershocks using the maximum likelihood estimation method. It should be noted that from the mathematical and physical sense, the so-called models 2, 3 and 4 are only to change the parameter combination of the Omori's model represented by formula 1, but it is not to build another model.
Data
More than 100 earthquakes larger than 5 have occurred on the Iranian plateau in the last ten years. Due to the limitation of recorded data and available data, 26 earthquakes were selected from among them to study their aftershocks as shown in Table 1. Of course, in the selection of events, as much as possible, it was tried to cover all areas of the Iranian plateau. One of the most important events is the 2017 Sarpol-e-Zahab earthquake (Iran- Iraq border region) with a magnitude of 7.3, which destroyed structures and killed several people. This event had many terrible aftershocks so that 10 aftershocks with a magnitude of 5 were recorded for it and its biggest aftershock registered a magnitude of 6.4. The epicenter of the earthquakes studied in this study is shown in Figure 1 [15]. As can be seen, most of the earthquakes are located in the Zagros seismotectonic province. The data on the main earthquake and its aftershocks were taken from the Iranian Seismological Center (IRSC).
| Number | Event name | Seismotectonic province | Date | ML | Longitude (ͦ ) | Latitude (ͦ ) | Time window (day) | Spatial window (km) |
|---|---|---|---|---|---|---|---|---|
| 1 | Kaki | Zagros | 09-04-2013 | 6.3 | 51.57 | 28.47 | 725.55 | 57.93 |
| 2 | Khanaqin | Zagros | 22-11-2013 | 5.7 | 45.55 | 34.29 | 343.66 | 48.83 |
| 3 | Khanehzeniyan | Zagros | 27-01-2020 | 5.4 | 52.09 | 29.61 | 236.52 | 44.82 |
| 4 | Arad | Zagros | 09-06-2020 | 5.7 | 53.43 | 27.63 | 343.66 | 48.83 |
| 5 | Bastak | Zagros | 02-01-2014 | 5.5 | 54.47 | 27.16 | 267.89 | 46.12 |
| 6 | Borazjan | Zagros | 28-11-2013 | 5.6 | 51.31 | 29.32 | 303.42 | 47.45 |
| 7 | Jam | Zagros | 26-11-2010 | 5.6 | 52.56 | 28.12 | 303.42 | 47.45 |
| 8 | Sisakht | Zagros | 02-05-2018 | 5.3 | 51.44 | 30.82 | 208.82 | 43.57 |
| 9 | Mormori | Zagros | 18-08-2014 | 6.2 | 47.64 | 32.71 | 640.59 | 56.31 |
| 10 | Sarpolezahab | Zagros | 12-11-2017 | 7.3 | 45.76 | 34.78 | 938.64 | 77.04 |
| 11 | Somar1 | Zagros | 22-08-2014 | 5.3 | 45.77 | 33.74 | 208.82 | 43.57 |
| 12 | Somar2 | Zagros | 11-01-2018 | 5.6 | 45.69 | 33.71 | 303.42 | 47.45 |
| 13 | Sangan | Central-East | 02-01-2020 | 5.8 | 60.3 | 34.03 | 389.24 | 50.24 |
| 14 | Masjedabolfazl | Central-East | 07-09-2018 | 5.7 | 59.46 | 28.16 | 343.66 | 48.83 |
| 15 | Hojedk | Central-East | 01-12-2017 | 6.2 | 57.37 | 30.74 | 640.59 | 56.31 |
| 16 | Mohamadabad | Central-East | 20-12-2010 | 6.5 | 59.15 | 28.44 | 790 | 61 |
| 17 | Negar | Central-East | 31-07-2010 | 5.8 | 56.81 | 29.7 | 389.24 | 50.24 |
| 18 | Zahan | Central-East | 05-12-2012 | 5.6 | 59.54 | 33.49 | 303.42 | 47.45 |
| 19 | Ahar-Varzaghan | Alborz-Azerbayejan | 11-08-2012 | 6.5 | 46.81 | 38.39 | 790 | 61 |
| 20 | Qotor | Alborz-Azerbayejan | 23-02-2020 | 5.7 | 44.52 | 38.45 | 343.66 | 48.83 |
| 21 | Torud | Alborz-Azerbayejan | 27-08-2010 | 5.9 | 54.47 | 35.49 | 440.87 | 51.69 |
| 22 | Torkmanchy | Alborz-Azerbayejan | 07-11-2019 | 5.9 | 47.52 | 37.71 | 440.87 | 51.69 |
| 23 | Neyshabor | Kopeh Dagh | 19-01-2012 | 5.4 | 58.89 | 36.32 | 236.52 | 44.82 |
| 24 | Pishqale | Kopeh Dagh | 13-05-2017 | 5.7 | 57.22 | 37.65 | 343.66 | 48.83 |
| 25 | Sefidsang | Kopeh Dagh | 05-04-2017 | 6 | 60.34 | 35.85 | 510 | 54 |
| 26 | Goharan | Makran | 11-05-2013 | 6.1 | 57.85 | 26.6 | 565.57 | 54.72 |
Table 1: Characteristics of selected earthquakes to investigate their aftershocks.
The aftershocks of a seismic sequence must first be extracted. Various temporal and spatial windows have been proposed for this purpose [7,12-14]. In this study, the Gardner et al., window was used to determine the temporal and spatial range of a seismic sequence [12].
Seismicity parameters (Mc, a, b)
By applying the temporal-spatial window, the aftershocks related to each mainshock were determined. The effect of aftershocks smaller than Mc (Magnitude of completeness) should be removed from the catalog. Wyss et al., proposed a method to estimate Mc by the smallest magnitude at which 90 per cent of the aftershocks can be modelled by the Gutenberg–Richter law [16,17]. This was done by ZMAP software [16]. Figure 2, shows two examples of these diagrams, which are related to A and B earthquakes. The values of a, b (a-value and b-value) and Mc are listed in Table 2. The range of Mc is from 1.5 to 3.3, while the b-value is from 0.65 to 1.13.

Figure 2:Frequency magnitude distribution of the two earthquake. Note: a) Ahar-Varzaghan; b) Khanaqin plotted are both the cumulative (squares) and non-cumulative form (triangles).
| Number | Event name | Mag. | Mc | Mc± | a-value | a-value (annual) | b-value | b-value ± |
|---|---|---|---|---|---|---|---|---|
| 1 | Kaki | 6.3 | 2.9 | 0.44 | 4.57 | 4.33 | 0.65 | 0.02 |
| 2 | Khanaqin | 5.7 | 2.3 | 0.12 | 4.1 | 4.18 | 0.75 | 0.06 |
| 3 | Khanehzeniyan | 5.4 | 2.6 | 0.23 | 4.96 | 5.18 | 1.13 | 0.2 |
| 4 | Arad | 5.7 | 2.9 | 0.01 | 5.12 | 5.19 | 1.06 | 0.14 |
| 5 | Bastak | 5.5 | 3.2 | 0.17 | 5.16 | 5.39 | 1.04 | 0.33 |
| 6 | Borazjan | 5.6 | 2.7 | 0.13 | 4.18 | 4.27 | 0.85 | 0.1 |
| 7 | Jam | 5.6 | 2.7 | 0.09 | 4.63 | 4.8 | 1.05 | 0.16 |
| 8 | Sisakht | 5.3 | 2.3 | 0.18 | 3.33 | 3.58 | 0.7 | 0.22 |
| 9 | Mormori | 6.2 | 2.5 | 0.1 | 4.82 | 4.58 | 0.7 | 0.04 |
| 10 | Sarpolezahab | 7.3 | 2.2 | 0.1 | 4.98 | 5.09 | 0.75 | 0.04 |
| 11 | Somar1 | 5.3 | 2.6 | 0.21 | 4.25 | 4.51 | 0.86 | 0.13 |
| 12 | Somar2 | 5.6 | 2.4 | 0.11 | 4.37 | 4.45 | 0.71 | 0.04 |
| 13 | Sangan | 5.8 | 2.3 | 0.22 | 4.47 | 4.45 | 0.91 | 0.15 |
| 14 | Masjedabolfazl | 5.7 | 2.9 | 0.06 | 4.51 | 4.61 | 1.02 | 0.19 |
| 15 | Hojedk | 6.2 | 2.3 | 0.08 | 4.89 | 4.7 | 0.73 | 0.03 |
| 16 | Mohamadabad | 6.5 | 3.3 | 0.11 | 5.42 | 5.13 | 0.94 | 0.09 |
| 17 | Negar | 5.8 | 2.7 | 0.3 | 4.22 | 4.28 | 1.01 | 0.36 |
| 18 | Zahan | 5.6 | 2 | 0.4 | 3.98 | 4.08 | 1.07 | 0.36 |
| 19 | Ahar-Varzaghan | 6.5 | 1.7 | 0.04 | 4.72 | 4.4 | 0.71 | 0.02 |
| 20 | Qotor | 5.7 | 2.3 | 0.25 | 4.54 | 4.58 | 0.82 | 0.11 |
| 21 | Torud | 5.9 | 1.8 | 0.05 | 4.43 | 4.35 | 0.85 | 0.03 |
| 22 | Torkmanchay | 5.9 | 1.8 | 0.07 | 4.43 | 4.35 | 0.85 | 0.04 |
| 23 | Neyshabor | 5.4 | 1.5 | 0.16 | 3.44 | 3.66 | 0.85 | 0.1 |
| 24 | Pishqale | 5.7 | 1.7 | 0.13 | 3.45 | 3.48 | 0.72 | 0.06 |
| 25 | Sefidsang | 6 | 1.6 | 0.1 | 4.29 | 4.14 | 0.66 | 0.03 |
| 26 | Goharan | 6.1 | 3.2 | 0.22 | 4.46 | 4.61 | 0.66 | 0.08 |
Table 2: a-value, b-value and Mc for each sequence. The standard errors are indicated by ± sign.
The background b-values were also estimated by a similar method in order to compare these values with the values obtained from the sequence of aftershocks. For this purpose, earthquakes data were collected for each event before the occurrence of the investigated events. Figure 2, shows the bar graph of both b-values side by side. Although in most cases, there is not much difference between the values of b (less than 0.1), there is a significant difference in cases such as Ahar-Varzghan, Goharan and Khanehzeniyan. The biggest difference is observed in Ahar-Varzaghan; so that the value of background b-value is estimated to be 1.43, while this value is determined to be 0.71 using aftershock.
Aftershock parameters (p, c, k)
After determining the spatial and temporal ranges of aftershock occurrence for each main shock and extracting the aftershocks, their cumulative graph was drawn and the best fitted model was obtained. Of course, aftershocks smaller than Mc were removed from the catalog so that incomplete data does not affect the calculation process. As mentioned before, 4 models can be considered. As an example, 2 cases of fitted curves on the cumulative aftershocks diagram are shown in Figure 3. The results related to each seismic sequence are listed in Table 3, based on these 4 models (based on above-mentioned four models). 14 seismic sequences (more than half of them) followed model 1 and 8 of them were fitted with model 4. Only 4 sequences can be fitted with models 2 and 3. The range of p and c parameters for Iranian plateau is calculated from 0.75 to 2.7 (average 1.32) and from 0.01 to 3.92 (average 0.57), respectively. The range of changes of parameter k is more than the previous two parameters and it is from 10.0 to 1014.2 with an average of 86.7.

Figure 3: B-value for background seismicity and aftershock sequence.
| Number | Event Name | Mag | Mc | Model | P | C | k |
|---|---|---|---|---|---|---|---|
| 1 | Kaki1 | 6.3 | 2.9 | 4 | p1=1.15, p2=2.70 | c1=0.39, c2=0.64 | k1=87.8, k2=10.0 |
| 2 | Khanaqin | 5.7 | 2.3 | 4 | p1=0.99, p2=2.70 | c1=0.08, c2=0.41 | k1=22.1, k2=10.1 |
| 3 | Khanehzeniyan | 5.4 | 2.6 | 1 | 1 | 0.07 | 12.1 |
| 4 | Arad | 5.7 | 2.9 | 1 | 0.89 | 0.2 | 10 |
| 5 | Bastak | 5.5 | 3.4 | 1 | 1.19 | 1.52 | 10 |
| 6 | Borazjan | 5.6 | 2.7 | 1 | 0.83 | 0.03 | 10.5 |
| 7 | Jam | 5.6 | 2.7 | 1 | 0.98 | 0.12 | 10 |
| 8 | Sisakht | 5.3 | 2.3 | 1 | 0.9 | 1.19 | 10 |
| 9 | Mormori2 | 6.2 | 2.5 | 4 | p1=1.65, p2=0.78 | c1=2.39, c2=0.02 | k1=1014.0, k2=17.2 |
| 10 | Sarpolezahab | 7.3 | 2.2 | 4 | p1=0.82, p2=1.23 | c1=0.66, c2=0.30 | k1=164.4, k2=92.0 |
| 11 | Somar1 | 5.3 | 2.6 | 2 | 1.14 | 0.66 | k1=13.6, k2=10.0 |
| 12 | Somar2 | 5.6 | 2.4 | 3 | p1=1.05, p2=2.70 | 0.44 | k1=115.0, k2=10.0 |
| 13 | Sangan | 5.8 | 2.3 | 1 | 0.75 | 0.01 | 14 |
| 14 | Masjedabolfazl | 5.7 | 2.9 | 1 | 1.32 | 0.3 | 10 |
| 15 | Hojedk | 6.2 | 2.3 | 4 | p1=0.94, p2=2.70 | c1=0.42, c2=0.87 | k1=136.8, k2=17.3 |
| 16 | Mohamadabad | 6.5 | 3.3 | 4 | p1=0.92, p2=1.82 | c1=0.04, c2=0.58 | k1=11.5, k2=39.4 |
| 17 | Negar | 5.8 | 2.7 | 1 | 1.11 | 0.48 | 10 |
| 18 | Zahan | 5.6 | 2 | 1 | 0.89 | 0.01 | 10.1 |
| 19 | Ahar-Varzaghan | 6.5 | 1.7 | 4 | p1=1.04, p2=1.71 | c1=1.74, c2=0.83 | k1=582.7, k2=171.1 |
| 20 | Qotor | 5.7 | 2.3 | 1 | 0.99 | 0.11 | 45.3 |
| 21 | Torud | 5.9 | 1.8 | 1 | 1.19 | 0.14 | 38.8 |
| 22 | Torkmanchy | 5.9 | 1.8 | 3 | p1=1.09, p2=2.70 | 0.41 | k1=134.1, k2=10.0 |
| 23 | Neyshabor | 5.4 | 1.5 | 1 | 1.04 | 0.032 | 15.9 |
| 24 | Pishqale | 5.7 | 1.7 | 1 | 0.85 | 0.015 | 10.3 |
| 25 | Sefidsang | 6 | 1.6 | 4 | p1=1.09, p2=1.07 | c1=0.67, c2=0.04 | k1=304.2, k2=11.1 |
| 26 | Goharan | 6.1 | 3.2 | 2 | 1.33 | 0.86 | k1=66.2, k2=13.2 |
Table 3: Values of p, c and k for each sequence.
Earthquakes that have a secondary sequence have a magnitude greater than or equal to 5.9; Except for the Somar 2 and Khanaqin earthquakes, which registered magnitudes of 5.6 and 5.7, respectively. Mainly, in the secondary sequence, the value of P is greater than the primary part, that is, after the secondary sequence, the decay rate of aftershocks increases and it will reach the background seismicity of that area more quickly.
In this section the relation of K and c parameters with the frequency of events will be investigated. Here, frequency means the number of records in a seismic sequence. In order to better display and compare the changes of these parameters, we normalized them in the range of 0 to 1 and showed them in a bar graph as shown in Figure 4. Normalization was done according to the relation (x-min(x))/(max(x)-min(x)). As can be seen, both k and c parameters have a direct relationship with the frequency of aftershocks. Of course, there are exceptions to this. The earthquakes of Sarpolezahab and Mormori in the diagram related to k and the earthquakes of Bastak, Sisakht, Mormori, etc in the diagram related to c are very different from other events. This relationship between k and c and aftershock frequency are expressed quantitatively by correlation coefficients in Figures 5. Parameter k has a strong relationship with frequency (with R2=0.69), while parameter c has a different behavior (with R2=0.26).

Figure 4: 2 fitted curves on the cumulative aftershocks diagram. Note: a) Khanehzeniyan; b) Mormori.

Figure 5: Diagram of k and c versus frequency of records. Note: a) Frequency values for "k" across various locations; b) Frequency values for "c" across the same locations; c) Relationship between frequency and k (y=0.86x+0.01, R2=0.69); d) Relationship between frequency and c (y=0.54x+0.12, R2=0.26).
Distribution of waiting time
In this part, the waiting time (i.e. the time interval between two successive aftershocks) distribution of the aftershock sequence as one of the temporal characteristics of aftershocks has been investigated. In some studies, a function in the form of gamma distribution has been used:
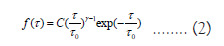
Where, C and τ0 are constant of normalization and scaling parameter, respectively. Also γ characterizes the power-low decay. Michas et al., proposed the q-generalized gamma distribution for nonstationary earthquake time series [18]:
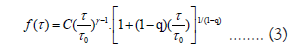
Where the last term of this equation is the function of
q-exponential  This distribution has been widely used in
temporal studies of seismic and aftershock sequences [11,18-22].
To investigate the probability distribution p(τ), the histogram
of waiting times τ is constructed, preferably in logarithmically
spaced bins. Then, p(τ) is estimated by counting the number of τ
that falls in each bin, further normalized with the bin width, and
divided by the total number of counts [11,18]. The diagram of this
distribution for all aftershock sequences is shown in Figure 6. As
can be seen, there is no significant difference in the diagrams of
the 5 seismotectonic provinces. The average of all these lines was
estimated and the best line that can be fitted was determined. The
best fitted line has these values: C=0.039 ± 0.004, τ0=9.2 ± 4.1,
γ=0.87 ± 0.08, q=1.79 ± 0.23.
This distribution has been widely used in
temporal studies of seismic and aftershock sequences [11,18-22].
To investigate the probability distribution p(τ), the histogram
of waiting times τ is constructed, preferably in logarithmically
spaced bins. Then, p(τ) is estimated by counting the number of τ
that falls in each bin, further normalized with the bin width, and
divided by the total number of counts [11,18]. The diagram of this
distribution for all aftershock sequences is shown in Figure 6. As
can be seen, there is no significant difference in the diagrams of
the 5 seismotectonic provinces. The average of all these lines was
estimated and the best line that can be fitted was determined. The
best fitted line has these values: C=0.039 ± 0.004, τ0=9.2 ± 4.1,
γ=0.87 ± 0.08, q=1.79 ± 0.23.

Figure 6: Normalized probability density of waiting time for all aftershock sequences (colored lines) and their best fitted line (black dashed line). The red dotted lines represent two different power-low segment.
Due to the importance of aftershocks in the release of energy and destruction, the decay behavior of some aftershocks of the last decade of the Iranian plateau was investigated. After preparing the required data according to modified Omori law, parameters p, c and k were evaluated. The range of changes of these parameters is compatible with two previous studies on the Iranian plateau. Kamranzad et al., and Ommi et al., studied 14 and 15 seismic sequences, respectively, to study the aftershocks of the Iranian plateau [2,3]. The range of p in these studies was determined from 0.39 to 2.7 and 0.85 to 2.7, respectively, and the range of k was obtained from 10 to 1427.4 and 10 to 441.1, respectively. Likewise, in both studies, the range of c is from 0.01 to 5 [23].
The decay rate of aftershocks, which is shown by parameter p, in this study is well matched with the seismotectonic characteristics of different provinces. Because, the average value of p in Alborz and Zagros are 1.08 and 1.05, respectively, while this value is less than 1 (about 0.99) for Central Iran [24]. This can be caused by high seismic activity and rapid energy discharge by small earthquakes. Alborz and Zagros regions are inter-plate regime; the parameter p in these regions is much larger than the Central Iran which has an intra-plate regime [25].
The trend of changes of k parameter in most cases had a direct relationship with the number of aftershocks in each sequences. Of course, this issue was raised by Reasenberg et al., and Ommi et al., also concluded it for the Iranian plateau earthquakes [3,7].
The probability distribution diagram of the waiting time showed that an average diagram can be used for the entire plateau of Iran, which has the best fit to all sequences of aftershocks. This graph has two segments with two different slopes, which can be due to two different regimes in the amended law. Because about half of the examined sequences do not follow model 1. It should be noted that due to the lack of previous studies in this field (waiting time) on the plateau of Iran, the results of this section cannot be compared with other studies.
I thank the Iranian Seismological Center for providing the data.
Citation: Rostam GG (2024). Investigation of the Reduction Pattern of Aftershocks in the Iranian Plateau. J Geogr Nat Disasters. 14:329.
Received: 20-Nov-2024, Manuscript No. JGND-24-35287; Editor assigned: 25-Nov-2024, Pre QC No. JGND-24-35287 (PQ); Reviewed: 10-Dec-2024, QC No. JGND-24-35287; Revised: 17-Dec-2024, Manuscript No. JGND-24-35287 (R); Published: 24-Dec-2024 , DOI: 10.35841/2167-0587.24.14.329
Copyright: © 2024 Rostam GG. This is an open-access article distributed under the terms of the Creative Commons Attribution License, which permits unrestricted use, distribution, and reproduction in any medium, provided the original author and source are credited.