Fisheries and Aquaculture Journal
Open Access
ISSN: 2150-3508
ISSN: 2150-3508
Research Article - (2015) Volume 6, Issue 1
This paper reports a new result for the isotopic differences between the left and right sagittal otoliths of Pacific halibut Hippoglossus stenolepis, a flatfish with both eyes on the right side. Using microsampling techniques we were able to collect subsamples from the nucleus and the 5th and 8th annulus from 63 pairs of halibut otoliths. Isotopic analyses of δ13C and δ13C showed that there was a significant difference between the left and right side otoliths from the nucleus in both Washington Coast and Puget Sound samples; but no significant difference from the 5th and 8th annuli of the same otoliths. These results were difficult to be explained as the differences in environmental parameters between ocean and estuary, but the mass accumulation from growth bias that was caused by gravitational force. The management implications on the results are clear: when using the nucleus of flatfish samples on stock structure investigations, one should consider the possible isotopic differences between the left and right side otoliths. However, when using the same samples for adult population, one may choose otoliths from both sides.
Keywords: Flatfish; Otolith asymmetry; Isotopic difference; δ13C and δ18C; Pacific halibut
Fish otoliths are laminated aragonite structures that have been used as a proxy of time series for environmental studies. Among the three pairs of otoliths (sagittae, lapilli and asterisci) in teleost fish, sagittae are usually the largest and most commonly used in age determination and subsampling for stable isotope analysis [1-3]. Otoliths begin to form before hatching and grow continuously through the entire life of a fish, thus preserving an uninterrupted record of the internal and external environment of the fish. It was reported that the left and right side sagittal otoliths of most marine fishes were identical and no significant morphological and isotopic differences were found between them [4-6], with an exception of flatfish [7-9]. In particular, Loher et al. [10] reported a significant difference between the left and right side otoliths of Pacific halibut Hippoglossus stenolepis in Sr/Ca, δ13C and δ18C ratios, but not in other trace elements (i.e., Li, Mg, Mn, Fe, Ni, Cu, Zn, Ba, and Pb) in the same analysis. They processed sagittal otoliths of age-2 Pacific halibut collected from the Gulf of Alaska, and used the whole-otolith method for trace element and stable isotope analyses. In view of the interest in comparison between the left and right side otoliths of flatfish, better resolved isotopic sampling warrants further investigation. Pacific halibut is perhaps the best flatfish species for testing the otolith asymmetry and isotopic differences due to biological observations on its early life history. Halibut spawning occurs annually from November to March along the edge of the continental shelf at depths between 100 and 550 m [11]. During the early development, particularly at the post-larva stage (about 4-6 months) [12,13], a distinct transformation or metamorphosis occurs in halibut as the left eye migrates to the right side (left side blind) and their characteristics change from roundfish to flatfish [8]. As adults, the left side otoliths of halibut are distinctly different from the right side otoliths in size, shape, and morphological features [14]. Questions are raised and need to verify: (1) there was no significant difference between the paired left-right otoliths because halibut had roundfish features in their larval stage; and (2) there was significant difference between the paired leftright otoliths in adult stage because the animal had flatfish features. The period before and after metamorphosis is so critical to the halibut’s life and cranial asymmetry that isotopic examinations from larval to adult stages are necessary. Previous studies using whole otoliths [10] cannot answer these questions because they only obtain a mixed isotopic composition for the young halibut. The microsampling techniques, which have been used in fisheries science and management since 1990s [2,15,16], should be capable of separating the larval stage and resolving the short-term isotopic record of the left and right side otoliths of flatfish. In this study we examined the isotopic differences between the left and right side otoliths by separating the larval growth of Pacific halibut just after metamorphosis [12]. First, we collected a large number of halibut otoliths from one area, and analyzed the nucleus (corresponding to the initial 4-6 months in larval growth over the first annulus) and the 5th annulus (young halibut with reduced migration; [17]). Second, we extended the sampling to a distinctly different area or stock [14], and analyzed the otolith nucleus and the 8th annulus (the early maturity age for male halibut; [11]). By compiling the otolith data from two areas with two slightly different sampling protocols we expect to find out if there are true isotopic differences between the left and right side otoliths for larval versus adult (5 or 8 years old) halibut.
Otolith microsampling and isotopic analysis
Thirty-two pairs of Pacific halibut sagittae were collected from commercial fisheries off the Washington Coast in 2013 and kept in dried conditions. After field collection, the otolith pairs were first cleaned in an ultrasonic water bath for about 15 min, and then transferred to a tap-water filled transparent vessel for age determination under a Van-Guard microscope. The surface-aged otolith samples were rinsed with ethanol, and dried at room temperature. The left and right side otoliths were each weighed using a Torbal AGCN balance, with a precision of 0.0001 g. Other morphological features, such as the shape of the otolith (convex or concave) between the left and right side otoliths, were also examined and recorded for comparison The methods for otolith slide preparation, such as resin embedding, cutting, and thin- sectioning, have been reported elsewhere [18]. Microsampling was conducted using the Dremel method as described by Gao [16]. Based on research objectives, two subsamples were carefully taken from each left and right side otolith. One powder sample was taken from the nucleus and extracted 1/3 to 1/2 interval of the first annulus which represents the initial 4-6 months of the larval growth; the other was taken from the 5th annulus because previous studies indicated that age-5 is the time when Pacific halibut typically reduce migration [17]. The microsampling was about 100 μm in resolution and at least 50 μg of aragonite powder were collected for stable isotope analysis. Once a subsample was finished, the powder was carefully tapped on aluminum foil and placed into a metal cup. The otolith slide and the sampling bit were then cleaned using an Aero-Duster gas. Analysis of otolith powder samples was conducted in the Environmental Isotope Laboratory of University of Arizona in Tucson, USA, using Finnigan MAT 252 and Delta-plus mass spectrometers. All the isotope ratio measurements were reported in the standard δ notation (%): δ18C={[(18O/ 16O)A/ (18O/16O)S]-1} × 1000, for instance, where A is otolith aragonite sample and S is an international standard (VPDB, Vienna Peedee belemnite). Calibration of isotopic enrichments to VPDB standard is based on daily analysis of NBS-19 (National Bureau of Standards) powdered carbonate and the analytical precision is better than 0.1% for both δ13Cand δ18C values.
Data from the 2008 collection
To verify the analytical results from the Washington Coast samples, 31 pairs of sagittal otoliths of halibut from the northern Puget Sound (a distinctly different area or stock from the Washington Coast [14]) were analyzed. These otoliths were collected during the 2008 commercial fishing season and were sampled with a slightly different protocol. One powder sample was taken from the nucleus identically to the Washington Coast samples, and another sample was taken from the 8th annulus (the early maturity age for male halibut [11]). The microsampling procedures were the same as described on the Washington Coast samples
Statistical analysis
The Kolmogorov-Smirnov test [19] and Shapiro-Wilk Wstatistic [20] were first performed to test if the isotope measurements from the left and right side otoliths were in normal distribution. If the isotopic data are normally distributed, traditional parametric statistical analyses (e.g., ANOVA, t-test, LDFA) can be used to compare the mean and the standard deviation of the difference; otherwise nonparametric methods (e.g., F-ANOVA, WSRT) should be considered [21]. Pearson’s correlation coefficient (r) and its significance were estimated to evaluate the consistency of the relationship between the isotope measurements from the left and right side otoliths. Scatter plots were also used to visually compare and evaluate these relationships. The left and right side otoliths from a sampled halibut were treated as paired samples and tested for equality of isotope measurements using the paired-sample t test. All differences were calculated as the left side otolith measurement minus the right side otolith measurement. The hypothesis that the mean of the differences is equal to 0 was tested by the paired-sample t test and, if this hypothesis was rejected, it was concluded that the samples were significantly different. All analyses were conducted using the statistical package IBM SPSS Statistics (v21).
For the 32 pairs of sagittal otoliths from the Washington Coast, halibut ages ranged from 9 to 15 years. There were no significant differences in weight (P=0.502) between the left and right side otoliths as previously documented [8], and the weights of left and right side otolit were highly correlated (Figure 1). The surfaces of the left side otoliths were mostly convex while the right side otoliths mostly concave. For the nucleus, most left side otoliths had well developed concentric microstructure whereas the right side otoliths did not. These morphological features of the right side otoliths often make them difficult to age. Based on the Kolmogorov-Smirnov and Shapiro- Wilk tests, only the distribution of the differences for the δ13C data sampled at the 5th annulus was significantly different from the normal distribution (Table 1). Investigation of this difference showed that the significance was mostly due to the two large negative δ13C values on the left side of the distribution. The paired-sample t test was used for comparing the left-right otolith isotopic composition because the departure from normality was slight and could be attributed to basically one observation. Analyses showed there was a significant (P<0.05) difference between the paired left-right otoliths mostly for δ13C values sampled from the otolith nucleus in both Washington Coast and Puget Sound samples (Table 2). In contrast, the differences between the paired left-right otoliths for both δ13C and δ18C sampled from the 5th and 8th annulus were not significantly different (both P>0.160). For the δ13C and δ18C composition of otolith pairs from the Washington Coast, the right side otoliths had higher mean isotope values than the left side, particularly for isotopic measurements from the nucleus (cf. Table 2). A similar isotopic trend was displayed in otolith pairs from the Puget Sound The correlations of isotopic composition between the left and right side otoliths ranged from 0.328 to 0.777 (Table 3). Interestingly, correlations for the Washington Coast samples were all higher than for the Puget Sound samples; and correlations in isotopic measurements from the 5th or 8th annulus were generally higher than those from the nucleus except for δ18C from the Puget Sound samples (cf. Table 3). Scatter plots of δ13C and δ18C values for paired left-right otolith samples from the nucleus and the 5th and 8th annulus, relative to the line of unity where both measurements are equal, showed an unequal distribution of data points mostly in the nucleus (Figures 2 and 3).
| Kolmogorov-Smirnov test | Shapiro-Wilk test | ||||
|---|---|---|---|---|---|
| Isotope | Microsampling | Statistic | P | Statistic | P |
| δ13C | Nucleus | 0.112 | 0.2 | 0.975 | 0.628 |
| 5th annulus | 0.158 | 0.042 | 0.919 | 0.019 | |
| δ18O | Nucleus | 0.086 | 0.2 | 0.967 | 0.413 |
| 5th annulus | 0.095 | 0.2 | 0.937 | 0.063 |
Table 1: Summary of the Kolmogorov-Smirnov and Shapiro-Wilk tests for normality of the distribution of isotopic differences between paired left-right otoliths for Pacific halibut from the Washington Coast (n=32).
| Isotope | Micro sampling and Location | Mean Difference (‰, VPDB) | Standard Deviation | t Statistics | P |
|---|---|---|---|---|---|
| WA Coast (n=32) | |||||
| δ13C | Nucleus | -0.175 | 0.366 | -2.713 | 0.011 |
| 5th annulus | -0.096 | 0.38 | -1.43 | 0.163 | |
| δ18O | Nucleus | -0.136 | 0.316 | -2.429 | 0.021 |
| 5th annulus | -0.071 | 0.38 | -1.061 | 0.297 | |
| Puget Sound (n=31) | |||||
| δ13C | Nucleus | -0.269 | 0.421 | -3.565 | 0.001 |
| 8th annulus | -0.002 | 0.326 | -0.024 | 0.981 | |
| δ18O | Nucleus | -0.128 | 0.375 | -1.902 | 0.067 |
| 8th annulus | -0.153 | 0.474 | -1.252 | 0.231 |
Table 2: Results of the paired-sample t test for the equality of δ13C and δ18C measurements from the left and right side otoliths of Pacific halibut.
| Isotope | Microsampling and Location | r | Pa |
|---|---|---|---|
| WA Coast (n=32) | |||
| δ13C | Nucleus | 0.619 | <0.001 |
| 5th annulus | 0.634 | <0.001 | |
| δ18O | Nucleus | 0.639 | <0.001 |
| 5th annulus | 0.777 | <0.001 | |
| Puget Sound (n=31) | |||
| δ13C | Nucleus | 0.337 | 0.064 |
| 8th annulus | 0.541 | 0.037 | |
| δ18O | Nucleus | 0.496 | 0.005 |
| 8th annulus | 0.328 | 0.233 |
Table 3: Correlations between δ13C and δ18C values from paired left-right otoliths of pacific halibut.
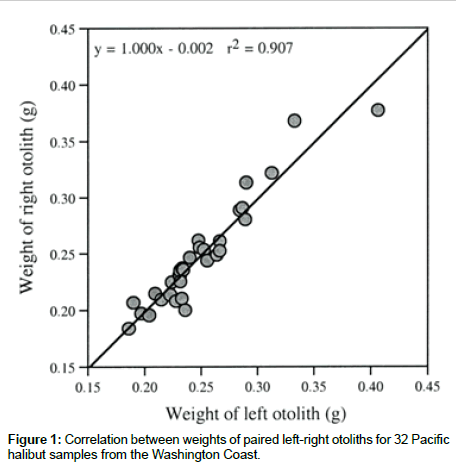
Figure 1: Correlation between weights of paired left-right otoliths for 32 Pacific halibut samples from the Washington Coast.
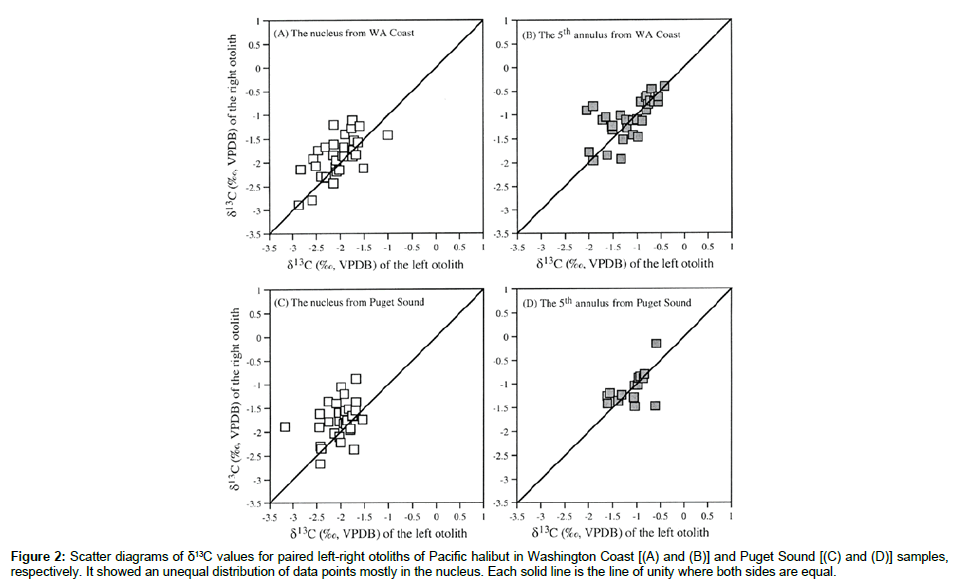
Figure 2: Scatter diagrams of δ13C values for paired left-right otoliths of Pacific halibut in Washington Coast [(A) and (B)] and Puget Sound [(C) and (D)] samples, respectively. It showed an unequal distribution of data points mostly in the nucleus. Each solid line is the line of unity where both sides are equal.
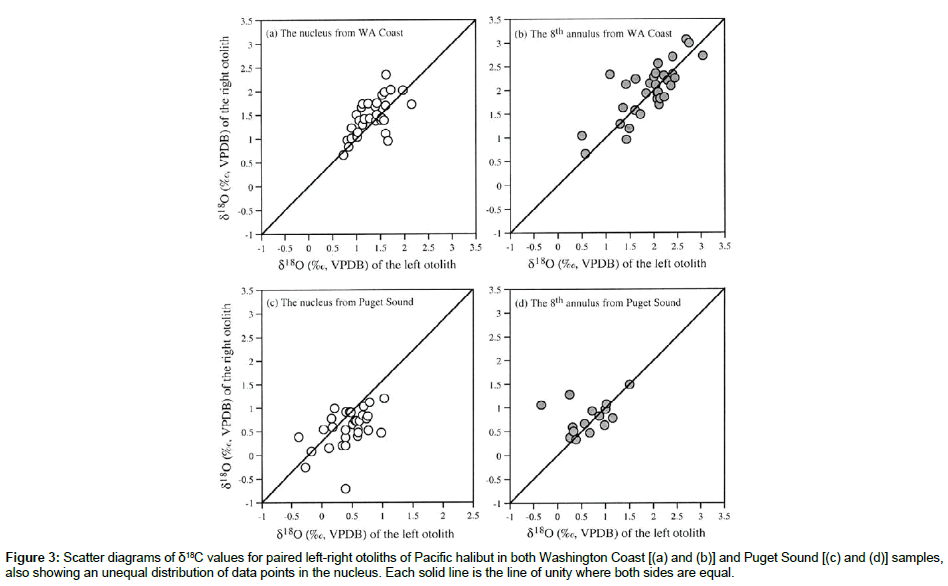
Figure 3: Scatter diagrams of δ18C values for paired left-right otoliths of Pacific halibut in both Washington Coast [(a) and (b)] and Puget Sound [(c) and (d)] samples, also showing an unequal distribution of data points in the nucleus. Each solid line is the line of unity where both sides are equal.
Using microsampling techniques we were able to analyze the nucleus and the 5th and 8th annulus from the left and right side otoliths of Pacific halibut. Our results indicated that there were significant isotopic differences between the left and right side otoliths for samples collected from the nucleus in both Washington Coast and Puget Sound samples; but no significant isotopic differences for samples collected from the 5th and 8th annulus of the same individual otoliths. These results clearly differ from the previous reports on marine fish otoliths [4-6], nor agree well with the whole-otolith studies on Gulf of Alaska halibut [10]. The nucleus in our sampling represents the initial 4-6 months in growth which encompasses halibut metamorphosis [12]; in contrast, the 5th and 8th annuli represent the time of reduced migration and onset of halibut maturation. Because the 63 pairs of otolith samples in this study came from two distinctly different areas or stocks [14], the results and conclusions are tenable and may be of significance for other flatfishes. Based on the principle of carbonate geochemistry, the δ18C values of otoliths reflect the ambient seawater temperature and the δ13C values are related to a fish’s diet [22-25]. For the same fish at the early life and adult stage as examined here, isotopic differences between the left and right side otoliths are difficult to interpret with respect to environmental factors such as water temperature, salinity, and diet [10]. Experimental observations [13] showed that in incubators Pacific halibut larvae floated passively in the water column with the head pointing downward. By 55 days after hatching (or 70 days after fertilization), the yolk sac was fully absorbed. As the larvae continuously grow, along with the yolk sac absorption and a decrease in specific gravity, they were capable of moving upright towards the shallower surface water [13]. In the natural environment these changes in water column (from about 500m to 100m) and gravitational force (1g=9.81 m/s2) must be rapid (less than 4-6 months), during which metamorphosis occurs such that the left eye of halibut larvae moves over the snout to the right side of the head [12]. Thus it is reasonable to assume that the halibut larvae are subjected to weightlessness or postural control, and their otolith organs are sensitive to changes in position. The development of lateralized swimming posture and morphological asymmetry during halibut metamorphosis are unknown [9], because there are few experimental observations and no detailed information available for halibut metamorphosis or exact days of eye migration. The mechanism could be explained from the theory and experiments of space motion sickness [26-29], which is caused primarily by the mismatch between expected and sensed gravity direction.
Differences in collective otoconial mass between the paired otolith organs could in principle result in asymmetric shear forces on the otolith membranes, although a compensation for asymmetries in vestibular function typically occurs [29]. Schreiber [9] pointed out that the development of a lateralized swimming posture occurred during late pre-metamorphosis and eye migration took place later during metamorphic climax, both influenced by thyroid hormone (TH) levels. Anken et al. [30] reported an experimental result in otoliths of “shifted” and “stationary” cichlid fish, and found that the lapillar otolith asymmetry of stationary samples showed a highly significant increase in late yolk-sac stages. When the fish began to swim freely, the asymmetry was decreased dramatically [30]. They suggest that the development of otolith asymmetry depends on the direction of the acting gravity vector relative to the positioning of the larvae. During metamorphosis, flatfishes undergo a 90 tilt to the right or left side to become bottom-adapted animals; however, the otolith organs do not rotate with the skull as the eyes did [7,31,32]. These neurophysiological studies and results might be helpful to explain why the left and right side otoliths of Pacific halibut are isotopically different. During the early development and metamorphosis, halibut larvae might be less active [8] and passively moved up to the shallower surface water [13]. Because of the tilted forces and gravity decrease, their sagittal otoliths became asymmetric and as a result the masses of right side otolith were larger than those of the left side. When the young halibut (after 6 months old) began to move offshore and migrate to the east and south of the US Pacific coast [12,33], the otolith asymmetry was decreased [30] so that the masses between the left and right side otoliths were nearly balanced. In other words, mass accumulation rates in the paired left-right otoliths are not identical throughout the early life history of halibut and the development of mass asymmetry and its later reduction reflect growth biases rather than environment. When we analyzed samples from the nucleus and the 5th and 8th annulus, the otolith asymmetry just after metamorphosis and the otolith symmetry of the adult halibut may be responsible for the δ13C and δ18C differences. Why does a flatfish have asymmetric otolith organs during metamorphosis but symmetric otoliths as an adult? Some research suggests that “motion” is the key [8] and this physiological design may be of great importance for flatfish to protect them from predators. If we agree with the above interpretation, the results of this study not only provide some details on the early development of halibut larvae, but have management implications as well. When using the nucleus of flatfish otoliths and stable isotope ratios in stock structure studies, one should consider the possible differences between the left and right side otoliths in isotope measurements. However, when dealing with the same samples for adult population, one can choose otoliths from both sides as proxies.
This project was supported by multi-level governments and fisheries agencies such as Makah Fisheries Management (MFM), Washington Department of Fish and Wildlife (WDFW), and Northwest Indian Fisheries Commission (NWIFC). We are grateful to many staff and colleague for their help, particularly Russell Svec (MFM) for his interest, Zac Espinoza (MFM) for otolith collections and Greg Bargmann (WDFW), for providing Puget sound otolith samples. Financial support partly from an NWIFC grant is also gratefully acknowledged.