
Journal of Clinical Chemistry and Laboratory Medicine
Open Access
ISSN: 2736-6588

ISSN: 2736-6588
Research Article - (2024)Volume 7, Issue 3
Objective: Cardiovascular disorders constitute a substantial threat to global human health and safety. Of note, Acute Myocardial Infarction (AMI), being a grave cardiovascular disorder, has collected considerable attention due to its elevated prevalence, mortality and broad demographic distribution. It is well established that hypoxia-induced apoptosis significantly contributes towards the onset and progression of AMI. However, several aspects regarding the biological indicators and molecular mechanisms of AMI remain elusive.
Method: This investigation utilized the Gene Expression Omnibus (GEO) database to perform comprehensive analysis of pivotal genes employing techniques like differential analysis, Venn analysis and Weighted Gene Correlation Network Analysis (WGCNA). Subsequently, the correlation between the key genes and correlation factors was scrutinized and the potential causal link between these factors and the outcome of AMI was probed via Mendelian Randomization (MR). Additionally, Reverse Transcriptase-quantitative Polymerase Chain Reaction (RT-qPCR) and lentivirus transfection experiments were executed, miRNA-mRNA networks were constructed utilizing miRBase databases, three-dimensional structures were predicted with the aid of RNAfold and Vfold3D databases and drug sensitivity analysis was conducted using RNAactDrug databases.
Results: Following classification, WGCNA clustering and wien screening analysis, two distinctly expressed genes intimately linked to apoptosis PTEN and BCL2L11 were successfully identified. The outcomes of RT-qPCR and lentivirus infection experiments corroborated that the expression pattern of BCL2L11 conformed to our prior findings. Mendelian randomization analysis exposed a strong causal relationship between BCL2L11 Single Nucleotide Polymorphisms (SNPs) and AMI. Lastly, through miRNA-mRNA network and drug susceptibility analysis, it was discerned that the ispinesib mesylate, bleomycin (50 uM)/miR-141-3p/BCL2L11 axis could potentially serve as efficacious therapeutic or preventive strategies against AMI.
Conclusion: In this study, we introduced the novel concepts of ispinesib mesylate and bleomycin (50 uM)/miR-141-3p/BCL2L11 axis, offering a fresh perspective on the apoptotic mechanism in AMI.
Acute myocardial infarction; Biochemistry; Bioinformatics; Drug research; Genetic dissection
AMI presents as an omnipresent condition with a disease burden alarmingly high in terms of prevalence. Specifically, the likelihood of suffering from AMI is elevated and the mortality risk associated is significant [1]. This affliction's occurrence appears to be independent of age class; rather, as societal pressures escalate along with unhealthy lifestyles, the incidences of myocardial infarctions tend to increment gradually [2]. Concurrently, the probability of disease reoccurrence is substantial, with certain patients diagnosed in the late stages or at the terminal phase, rendering their general prognosis disconcerting. To effectively address these issues, we require a comprehensive understanding of the molecular mechanisms involved in the progression of myocardial infarction towards identifying novel therapeutic objectives and selectively targeting genes, thereby boosting the effectiveness of myocardial infarction treatments [3-5]. Evidence suggests that micro Ribonucliec Acids (miRNAs) have an essential role in the initiation and progression of myocardial infarction, offering a fresh perspective for treating this ailment [6].
The apoptotic pathway exerts a profound impact on the pathophysiology of nearly all human disorders. Recently, extensive research has exposed that apoptosis could potentially be the primary contributor to AMI, with hypoxia-induced apoptosis being instrumental in the onset of AMI [7,8]. Hypoxia can originate from both intrinsic and extrinsic environmental factors, representing a critical issue within the realm of apoptosis biology. Under physiological conditions, hypoxia serves as a predominant regulator of cellular and mitochondrial signaling and functionality. However, if hypoxia is not adequately regulated, it can instigate oxidative tissue and cell damage, culminating in severe apoptosis [9]. Certain researchers suggest that inflammation linked to apoptosis might expedite the onset of AMI. Furthermore, numerous human case studies indicate that periapoptotic markers in individuals with AMI exhibit a significant positive correlation with the severity of the condition. Nevertheless, the precise biomarkers of apoptosis and its molecular mechanism necessitate further elucidation [10].
In the aim of this objective, our research group procured a vast quantity of sequencing data pertaining to AMI from the GEO [11]. Utilizing difference analysis and WGCNA, we successfully pinpointed differentially expressed genes linked to apoptosis [12]. Subsequently, we conducted cell experiments to execute RT-qPCR and experimental validation of hub genes and probed into the potential causal relationship between inflammatory cytokines, hub genes and AMI using Mendelian randomization [13-16]. Ultimately, we constructed a miRNA-mRNA regulatory network to identify a novel pharmaceutical agent for the prevention and management of AMI [17]. The detailed workflow is illustrated in Figure 1.
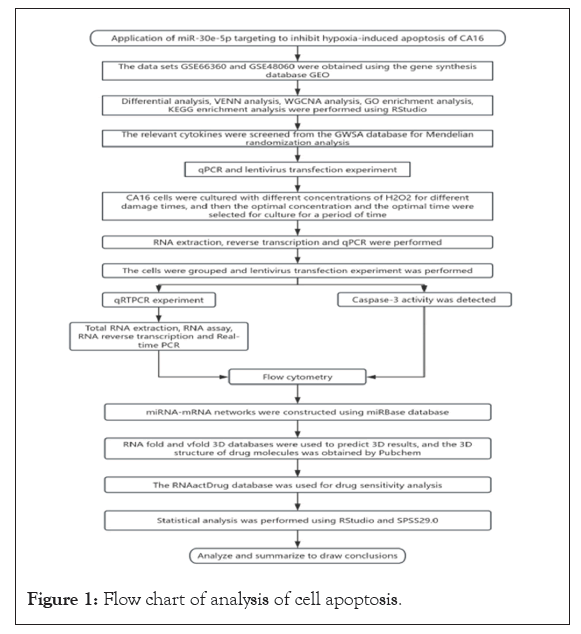
Figure 1: Flow chart of analysis of cell apoptosis.
Gene collection and processing
During our research endeavor, we initially isolated and scrutinized a corpus of gene expression correlations pertaining to AMI. These findings originated from the GEO, a property of the National Center for Biotechnology Information (NCBI). To assure the authenticity and dependability of these data, we confined our selection solely to gene expression datasets comprising of healthy demographics and subjects afflicted with Osteoporosis (OP), excluding all non-humane specimens.
Specifically, two datasets, GSE66360 and GSE48060, were chosen for thorough examination. Moreover, we retrieved miRNA-seq expression data from GSE249812 and single-cell RNA-seq data from GSE269269. Notably, we sourced the 378 genes with an apoptotic cell score of 7 or higher from the GeneCards database as complementary information [18].
A differential regulation of apoptotic genes was observed in comparison between the acute myocardial infarction cohort and normal individuals.
We initiated our research by meticulously examining Peripheral Blood Mononuclear Cells (PBMCs) obtained from a total of 49 patients diagnosed with AMI and 50 unaffected individuals utilizing multimodal Magnetic Resonance Imaging (MRI). This analysis encompassed transcriptome profiling data for these cells, detailed as GSE66360. Subsequently, the raw data was harmonized and subjected to Principal Component Analysis (PCA) to unearth the unique expression profiles distinguishing the two sample cohorts.
To further delineate these differentially expressed genes, we employed volcano and heat map methodologies. Furthermore, we pinpointed 1604 Differentially Expressed Genes (DEGs) and 378 Oligosaccharides and Sulfatides Related Genes (OSRG). This gene group was cross-referenced and their intricate correlations were illustrated via a Venn diagram.
Ultimately, we successfully identified 55 apoptosis-associated genes exhibiting significant alterations in expression levels, which were strongly correlated with AMI. Additionally, we performed an extensive examination of another miRNA dataset, GSE249812 to discern miRNAs demonstrating differential expression patterns between AMI patients and healthy controls.
Consensual clustering and joint expression analysis
Upon scrutinizing the GSE48060 genome expression profiling dataset, we initially computed the Median Absolute Deviation (MAD) score for each gene before eliminating the foremost 50% of genes boasting the lowest MAD score. Subsequently, utilizing the R-dependent goodSamplesGenes function within the WGCNA application, these genes along with their corresponding observations were systematically inspected to rule out potential inconsistencies.
Post this, we employed the WGCNA methodology to form a scale-free co-expression network, wherein the β-parameter was fixed at 7 and the sensitivity was adjusted to 3. Upon this foundation, modules exhibiting a correlation coefficient between genes inferior to 0.25 were amalgamated, yielding 7 modules possessing substantial co-expression attributes. Notably, certain modules designated as "gray" do not align with any pre-existing modules in the co-expression analysis.
Enrichment analysis of key module characteristic genes via gene ontology and kyoto encyclopedia of genes and genomes
Utilizing WGCNA's sophisticated deep clustering analytical methodology, we proficiently isolated the pivotal module exhibiting significant correlation with phenotypic manifestation from an extensive array of pertinent data, concurrently yielding a comprehensive compilation of all genes encompassed within this module. Subsequently, we employ the "clusterProfile" auxiliary package of the R programming expression to construct a Gene Ontology (GO) for each gene within the designated green module.
Through rigorous multidimensional scrutiny and exploration, including gene ontology and Kyoto Encyclopedia of Genes and Genomes (KEGG) analyses, our objective is to delve deeper into the underlying biological mechanisms and potential biological pathways implicated in AMI.
Assessment and comparative examination of pivotal genes
Through the application of a Venn diagram, we illustrate the intricate interplay among the pivotal module gene clusters of the WGCNA, apoptotic-associated genes and variously expressed genes implicated in AMI. Eventually, two important genes, namely Phosphatase and Tensin Homolog (PTEN) and BCL2L11, were identified as potential contributors to this disease scenario.
Mendelian randomization analysis
We utilized a Venn diagram to illustrate the interplay among the critical module genes within the WGCNA, apoptotic genes and differentially expressed genes pertaining to AMI. Subsequently, two vital genes, namely PTEN and BCL2L11, were pinpointed.
This paper utilizes the Acute Myocardial Infarction Risk Index (ARMI) dataset sourced from both CardioGRAMplusC4D and LeeLab, two independent Genome-Wide Association Study (GWAS) databases. Upon gaining access to these datasets, we navigated through the GWAS directory, identified the SNP associated with the BCL2L11 gene and employed the mendelian randomization approach via the MR-based platform.
Throughout this procedure, we primarily relied on the Inverse Variance Weighting (IVW) methodology for comprehensive analysis, along with the MR egger intercept to gauge the influence of horizontal pleiotropy. Moreover, to ascertain the robustness of causality, we executed a series of sensitivity analyses, encompassing Cochran's Q test, Mendelian Randomization Pleiotropy Residual Sum and Outlier (MR PRESSO) test and missing an exception analysis.
All aforementioned statistical evaluations were executed utilizing the "TwoSampleMR" (version 0.5.6) module in the R software, with a significance threshold of 0.05 being adopted unless specified otherwise.
Reverse transcriptase-quantitative polymerase chain reaction and cell experiments
In vitro culture of cardiomyocytes: Human-derived cardiomyocytes (derivatives of type CA16) are initially rejuvenated in accordance with established protocols, subsequently transferred to a petri dish enriched with 9% fetal bovine serum and Dulbecco's Modified Eagle Medium (DMEM) medium, along with a 1% solution of penicillin and streptomycin by volume to foster a favorable bacterial milieu.
Incubation is conducted within an incubator maintaining a concentration of 5% carbon dioxide by volume and a temperature of 37°C, with regular monitoring of cell proliferation. A fresh culture medium is replenished every third day, followed by cell passage. Cells in the logarithmic growth phase are chosen as the subject for ensuing experiments.
Group treatment of cardiomyocytes: Cardiomyocytes Carbonic Anhydrase (CA16) in the logarithmic growth phase are segregated into four distinct groups based on diverse treatment modalities: Normal group (N), Hypoxia group (H), Overexpression control group (NC+H) and miR-30e-5p+H group (miR+H). Herein, the Normal group is maintained under standard conditions for 24 hours; the Hypoxic group undergoes H2O2 treatment prior to cultivation under normal conditions.
The Overexpression control group (NC+H) and miR-30e-5p+H group (miR+H) are subjected to lentivirus infection, respectively. Specifically, the NC+H group is cultivated under normal conditions, whereas the miR+H group is cultivated post H2O2 hypoxia treatment under normal conditions. All cultures are executed in a 37°C incubator with a volume fraction of 5% carbon dioxide.
Protocol for hypoxia treatment via an inductive method: Based on the scrutiny of data derived from prior hydrogen peroxide induction experimentation, we discerned that as the H2O2 concentration escalated, miR-30e-5p expression decreased significantly. Consequently, the H2O2 concentration appointed for this experimental setup was fixed at 75 μM and the duration of the treatment period was calibrated to 24 hours.
Cells in the exponential growth phase were plated into 6-well plates post-trypsinization of the Hypoxic group (H), miR-30e-5p+H group, exposed to a concentration of 75 μM H2O2 and cultivated in a 37°C incubator enriched with 5% carbon dioxide for 24 hours.
Control group: The N group was exempt from any intervention; the H group solely required incubation for 24 hour’s post-hypoxia treatment; both the NC+H and miR+H groups were persistently infected and loaded with lentivirus, henceforth maintained at 37°C for uninterrupted cultivation. Post completion of the treatment period, cells from each group were isolated and processed independently for assessment of pertinent indicators.
Procedure for lentivirus infection of cardiomyocytes: To ensure efficient lentiviral infection, it is imperative to cultivate 293 T cells in 96-well plates and the corresponding plasmid of interest for infection beforehand. Once the cell density attains a suitable range of approximately 50%-70%, the infection procedure may commence.
Equilibrate the DMEM blend thoroughly with a solution comprising 0.16 μg of the h-BIM-3'UTR target plasmid and 5 pmol of hsa-miR-30e-5p/Negative Control (NC) and store at room temperature (i.e., solution A). Subsequently, blend another DMEM blend thoroughly with a solution incorporating 0.3 μl of infection reagent (manufactured by Hanheng Biotech at a concentration of 0.8 mg/ml) and allow to stand for 5 min at room temperature (i.e., solution B). Lastly, amalgamate solution A and solution B thoroughly and leave at room temperature for 20 min. Prior to infection, the cells must be replenished with fresh medium and subsequently agitated uniformly with the aforementioned infection mixture. Adjust the culture conditions to 37°C with a volume fraction of 5% carbon dioxide, rejuvenate the medium once more 6 hour’s post-infection and harvest cells for detection 24 hours subsequent.
Examination of reverse transcriptase-quantitative polymerase chain reaction protocols: Initially, cell samples subjected to diverse conditions and transfected for a period of up to 24 hours are trialed via trypsinization before precipitation with TRizol® Reagent. This procedure extracts all RNA fragments, which are subsequently quantified and converted into complementary Deoxyribonucleic Acid (DNA) through reverse transcription methodology. Ultimately, the PCR analyzer carries out RT-qPCR amplification.
In-depth study of apoptosis mechanisms: Upon completion of the transfection process, the cells undergo digestion using Ethylene Diamine Tetraacetic Acid (EDTA) free trypsin (the duration of trypsinization must be judiciously controlled to prevent false positives). Subsequently, centrifugation at 2,000 revolutions per min for 5 min is employed to isolate the cells.
Following this, the cells are washed twice with Phosphate Buffered Saline (PBS) (centrifuging at 2,000 rpm for 5 min each), resulting in a collection of 1 to 5 × 10⁵ cells. A volume of 500 μL of binding buffer is added to resuspend these cells. Subsequently, 5 μL of Annexin V-Fluorescein Isothiocyante (FITC) is incorporated, thoroughly mixed and incubated at room temperature and in darkness for 5 min. Subsequently, an additional 5 μL of caspase-3 substrate, cropidium iodide is added, re-mixed and allowed to react at room temperature and in darkness for 10 min. Throughout this one-hour period, the cells are observed and scrutinized utilizing flow cytometry.
Procedural protocol for lentivirus infection of cardiomyocytes: Ahead of infection, cardiomyocytes were plated in 6-well plates and nurtured over 2 to 3 days to facilitate restoration of their functional activity.
Optimal cell density ranges between 40% and 60%. Five infection groups were established with varying Multiplicity of Infection (MOI) values: 3, 10, 20, 50 and 100, each comprising two replicate wells. One well received a final concentration of 5 μg/ml polybrene, whilst the other remained devoid. Polybrene enhances viral cellular invasion yet may inflict harm on specific cell types. Post infection, the initial culture supernatant was discarded and substituted with fresh medium. Three to four day’s post infection, the cells were scrutinized under a fluorescence microscope; successfully infected cells exhibited green fluorescence. Efficacy of infection could be gauged either visually or via cell count to ascertain the optimal MOI.
In accordance with experimental specifications, cardiomyocytes were plated in 6-well plates and nurtured over 2 to 3 days to facilitate restoration of their functional activity. Optimal cell density ranges between 40% and 60%. The selected lentivirus was thawed from -80°C freezer, gradually defrosted on ice and allowed to reach complete freezing prior to initiating the lentiviral infection protocol.
The original medium in the petri dish was replaced with half volume of fresh myocardial maintenance medium, supplemented with polybrene at a final concentration of 5 μg/ml. Subsequently, the MOI value of 3 determined in the preceding experiment was transposed into the corresponding quantity of the targeted lentiviral stock solution. This solution was then added to the cardiomyocytes in the petri dish as per this quantity, ensuring even distribution. Following addition of the lentiviral solution, the petri dish was transferred directly into a 37°C incubator for a period of 4 hours.
Upon completion of the 4-hour infection period, the petri dish was removed and an additional half volume of fresh myocardial maintenance medium (polybrene supplemented at a final concentration of 5 μg/ml) was added directly to the medium. The following day post infection (approximate duration of 12 to 16 hours), the original medium was exchanged for fresh myocardial maintenance medium (polybrene-free) and continued incubation at 37°C. Seventy-two hours post infection, the dish was examined under a fluorescence microscope to assess Green Fluorescent Protein (GFP) fluorescence expression efficiency of cardiomyocytes.
Implementation of caspase-3 activity detection technology: Firstly, adherence to the prescribed procedure is significant, wherein the thawed reagent should be promptly utilized upon reversion to liquid form. Secondly, a standard dilution formulation is required, whereby the assay buffer and lysate are proportioned in accordance with a 9:1 ratio. Subsequently, the p-Nitroaniline (pNA) (10 mM) present in the kit is serially diluted to concentrations of 0 M, 10 μM, 20 μM, 50 μM, 100 μM and 200 μM, serving as a control group for ensuing experiments.
Following this, the Optical Density (OD) values of the aforementioned promoter-associated RNAs (pRNA) concentrations are assessed at a specific wavelength of 405 nm utilizing a microplate reader. On the basis of each pRNA concentration and its corresponding OD value, a standard curve is constructed. Subsequently, the cells are enzymatically digested via myocardial digest, centrifuged at a speed of 900 g at 4°C for a duration of 5 min, cardiomyocytes are isolated and the supernatant is meticulously discarded to ensure maximum cellular aspiration.
Post-wash with pre-cooled PBS, repeat the process until complete supernatant clearance. Subsequently, operate under refrigerated conditions, add the lysate at a ratio of 100 μl lysate per 2 million cell volume, resuspend the pellet and allow lysis to occur for 15 min. Once more, centrifuge at 16,000 g at 4°C for 15 min, discarding the supernatant, which constitutes the cell lysate.
Carefully aspirate the supernatant and transfer it to a centrifuge tube previously treated with an ice bath. Immediately thereafter, assess the caspase-3 enzyme activity. Simultaneously, a subset of samples may be quantified employing the Bradford method, aiming to achieve a protein concentration within the range of 1-3 mg/ml to ensure that every 10 μl of the test sample comprises a minimum of 10-30 μg of protein content. Lastly, aliquot an appropriate quantity of Ac-DEVD-pNA (2 mM) and store it on an ice bath for future utilization.
Position the 96-well plate in a darkened environment at 37°C and incubate for 1-2 hours. Upon observing a discernible color shift, configure a microplate reader to register the OD value of the 96-well plate at a wavelength of 405 nm.
Should the signal intensity alteration be insignificant, extend the incubation period until the 96-well plate exhibits a darker coloration and augmented signal. The absorbance of the caspase-3-catalyzed pNA in the sample is calculated using the corresponding equation. By referencing the standard curve, the precise quantity of pNA catalyzed in the sample can be ascertained. Given that one unit of enzyme activity is defined as the quantity of enzyme capable of hydrolyzing and cleaving 1 nmol of Ac-DEVD-pNA to yield 1 nmol of pNA of caspase-3 per hour at 37°C with substrate saturation, we can indirectly estimate the number of enzyme activity units of caspase-3 present in the test sample.
Additionally, the Bradford method is employed to determine the protein concentration of the sample being analyzed. Ultimately, the enzymatic activity units of caspase-3 contained in a unit mass protein of the sample being evaluated are calculated.
Examine the relationships between micro ribonucliec acids and messenger ribonucliec acids within drug prediction networks
The exceptional precision of the miRBase database facilitated our acquisition of comprehensive annotation details pertaining to an extensive selection of meticulously chosen microRNA sites. Utilizing these data, we successfully identified the microRNA interacting with the BCL2L11 gene and established a microRNA-messenger RNA network model. Moreover, we utilized the TargetScan database to validate BCL2L11 binding sites to microRNAs with substantial certainty.
The RNAactDrug database serves as a comprehensive repository utilizing deep integration analysis of three pharmacogenomic databases (genomics of drug sensitivity in cancer, CellMiner and cancer cell line encyclopedia) across four molecular dimensions (expression, copy number variation, mutation and methylation).
This resource uncovers potential correlations between drug sensitivity and RNA entities, encompassing messenger RNA, long noncoding RNA and microRNA. We procured information on microRNA, messenger RNA and drug susceptibility.
Concurrently, we employed the RNAfold database and the Vfold3D database to forecast the 3D structure of the targeted microRNA. Simultaneously, the three-dimensional structure of the drug molecule was retrieved from Pubchem.
Statistical analysis methods
All raw data manipulation is executed using R software (version 4.2.1). To discern if a significant disparity exists between two cohorts of independent samples, we utilize either the t-test or Wilcoxon's rank-sum test. For situations involving more than two independent groups, the Kruskal-Wallis test is applied to evaluate the discrepancy. All p-values are designated as bilateral, with p<0.05 serving as the threshold for statistical significance.
Ethical review process
This research did not involve any human experimentation; hence no informed consent form was necessitated.
Differentially expressed genes associated with apoptosis
Investigation into whole blood peripheral blood mononuclear cells from a collective number of 50 health individuals and a total of 49 patients afflicted with AMI was conducted utilizing the comprehensive RNA-seq dataset GSE66360. Upon preliminary exploration of the data, it became apparent that, although uniformity was apparent amongst all 99 sampled tissues, significant disparity existed between the two studies cohorts portrayed in Figure 2A. This insight led us to employ the sophisticated differential expression analysis methodology to uncover the underlying biological disparities among these groups, culminating in the identification of 1605 candidate genes exhibiting varied expression profiles (Figure 2B).
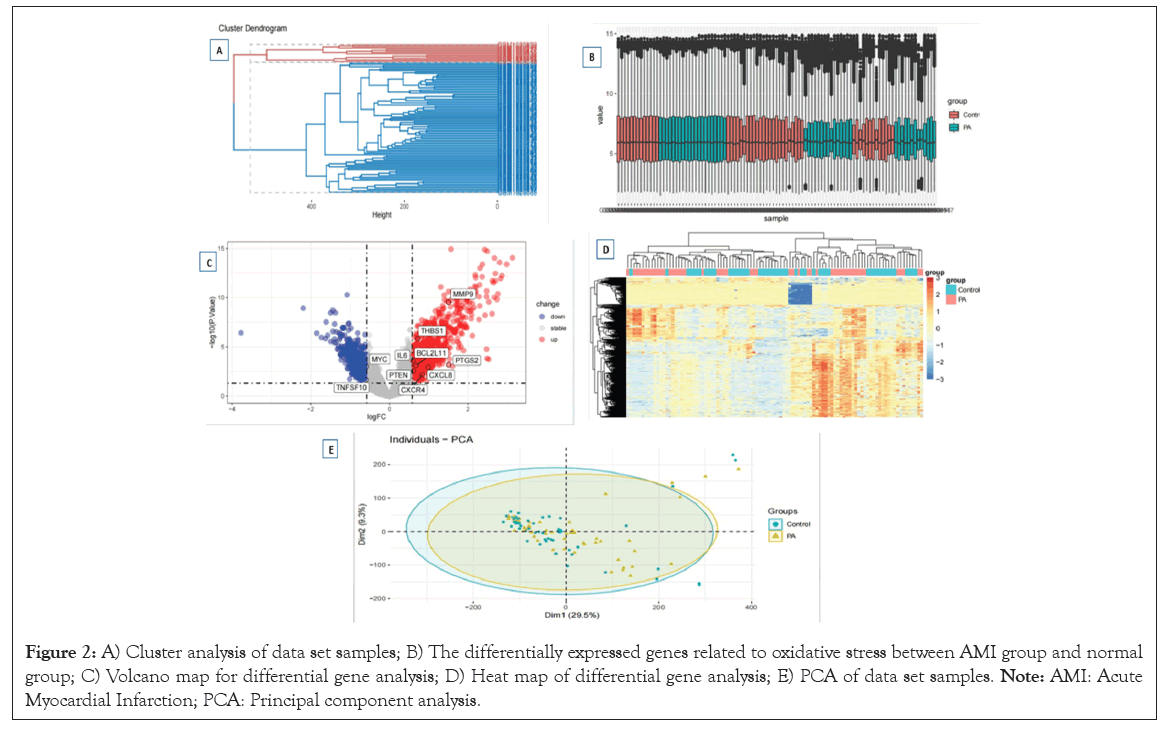
Figure 2: A) Cluster analysis of data set samples; B) The differentially expressed genes related to oxidative stress between AMI group and normal group; C) Volcano map for differential gene analysis; D) Heat map of differential gene analysis; E) PCA of data set samples. Note: AMI: Acute Myocardial Infarction; PCA: Principal component analysis.
These were depicted in the intuitive volcano maps and heat maps (Figures 2C-2E).
Comprising influential genes such as Interleukin 1β (IL1B), Phorbol-12-Myristate-13-Acetate-Induced Protein 1 (PMAIP1), Cyclin Dependent Kinase Inhibitor 1A (CDKN1A), Growth Arrest and DNA Damage Inducible 45 Alpha (GADD45A), Matrix Metalloproteinase 9 (MMP9), Fibroblast Activation Protein (FOS), Immediate Early Response 3 (IER3), DNA Damage-Inducible Transcript 3 (DDIT3), Nuclear Factor κB Inhibitor α (NFKBIA), Tumor Protein 53 Binding Protein 2 (TP53BP2), X Inactivation Specific Transcription Factor (XIST), Jun Protein (JUN), Early Growth Response 1 (EGR1), Granzyme B (Gr B), Tumor Necrosis Factor Alpha-Induced Protein 3 (TNFAIP3), Toll-Like Receptor 4 (TLR4), Cysteine Aspartate Specific Proteinase 10 (CASP10), Hemoxygenase 1 (HMOX 1), Serine/Threonine Kinase 17B, (STK17B), Death Associated Protein Kinase 1 (DAPK1), B Cell Lymphoma/Leukemia 2 Family Member L13 (BCL2L13), Interleukin 6 (IL6), ATP-Binding Cassette Transporter Subfamily B Member 1 (ABCB1), Tumor Necrosis Factor Receptor Superfamily Member 10C (TNFRSF10C), DNA Fragmentation Factor Subunit Beta (DFFB), Protein Kinase C δ (PRKCD), Programmed Cell Death 4 (PDCD4), Death Cones Attachment Protein γ (DAXX), Prostaglandin-Endoperoxide Synthase 2 (PTGS2), Interleukin 18 (IL18), B Cell Lymphoma/Leukemia 2 Family Member L11 (BCL2L11), Insulin-Like Growth Factor Binding Protein 3 (IGFBP3), Bardet-Biedl Syndrome Protein 1 (BFAR), Myelocytomatosis oncogene (MYC), Interferon Regulatory Factor 27 (IRF27), C-X-C Motif Chemokine Ligand 8 (CXCL8), Cathepsin D (CTSD), CD40 Ligand High Molecular Weight Glycoprotein (CD40LG), Transglutaminase 2 (TGM2), Ring Finger Protein 34 (RNF34), Interleukin 24 (IL24), KIT Proto-Oncogene (KIT), Modulator of Apoptosis 1 (MOAP1), Cysteine Aspartate Specific Proteinase 6 (CASP6), Phosphatase Tensin Homologue (PTEN), Cyclin Dependent Kinase 4 (CDK4), Vascular Endothelial Growth Factor A (VEGFA), Tumor necrosis factor Superfamily Member 10 (TNFSF10) among others.
Investigation of significant modules employing weighted gene correlation network analysis methodology
Within the investigation of GSE48060, we meticulously determined the optimalsoft threshold parameter β at 6, serving as our foundation for subsequent examination (Figure 3A). Exemplified via the clustering diagram, we discern the formation of clusters encompassing the two datasets and their corresponding hierarchical structure of seven modules (Figure 3B).
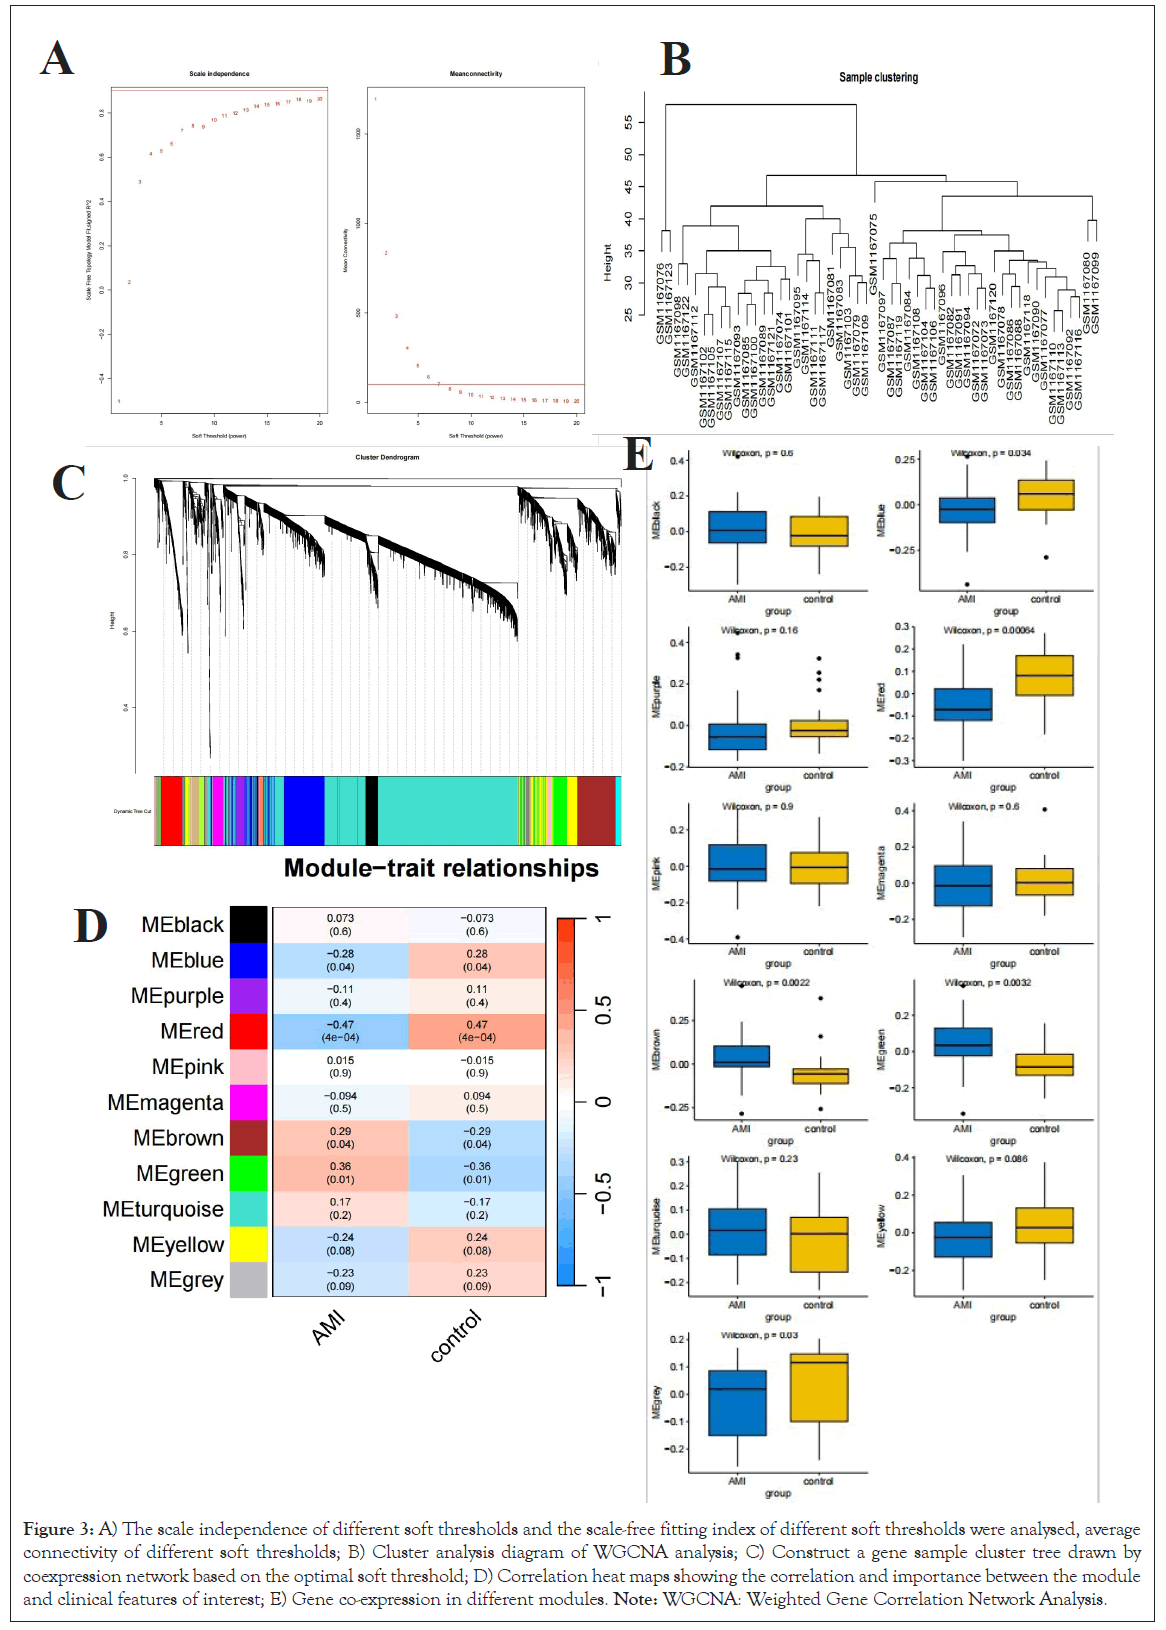
Figure 3: A) The scale independence of different soft thresholds and the scale-free fitting index of different soft thresholds were analysed, average connectivity of different soft thresholds; B) Cluster analysis diagram of WGCNA analysis; C) Construct a gene sample cluster tree drawn by coexpression network based on the optimal soft threshold; D) Correlation heat maps showing the correlation and importance between the module and clinical features of interest; E) Gene co-expression in different modules. Note: WGCNA: Weighted Gene Correlation Network Analysis.
The correlation diagram further elucidates the interplay among these seven modules, with color utilized to visually represent their proximity (Figure 3C). Ultimately, we successfully established the correlations between the seven modules and phenotypes, with the notable correlation between the green module and the severity of AMI being particularly noteworthy (Figures 3D and 3E). Consequently, we opted to undertake a more comprehensive follow-up analysis of this green module.
Gene ontology and kyoto encyclopedia of genes and genomes pathway enrichment analysis pertaining to the green module
Within the third grouping of 'green' modules unearthed by our innovative WGCNA methodology, a total of 1084 genes were chosen for additional bioinformatics scrutiny (Figure 4A). This exploration aimed to elucidate the plausible roles and mechanisms depicted by these genes. Specifically, we applied the tailored tuple cluster paradigm to investigate the genes encompassed within these green modules for specific genes and for selected gene expressions (Figures 4B and 4C). This involved primarily correlation analyses of biological processes and functions across diverse hierarchical levels. The genes identified exhibited strong associations with numerous cellular functions, encompassing cell lethality, leucocyte-mediated immune response, lymphocyte-induced immune response, leucocyte-driven cytotoxicity and the destruction of other biological entities. Furthermore, we executed an extensive examination of these genes utilizing the KEGG database, revealing significant correlations with various signaling pathways, such as leucocyte-induced immune response, cell lethality, lymphocyte-induced immune response, leucocyte-driven cytotoxicity and lymphocyte-regulated immune regulation (Figures 4D and 4E).
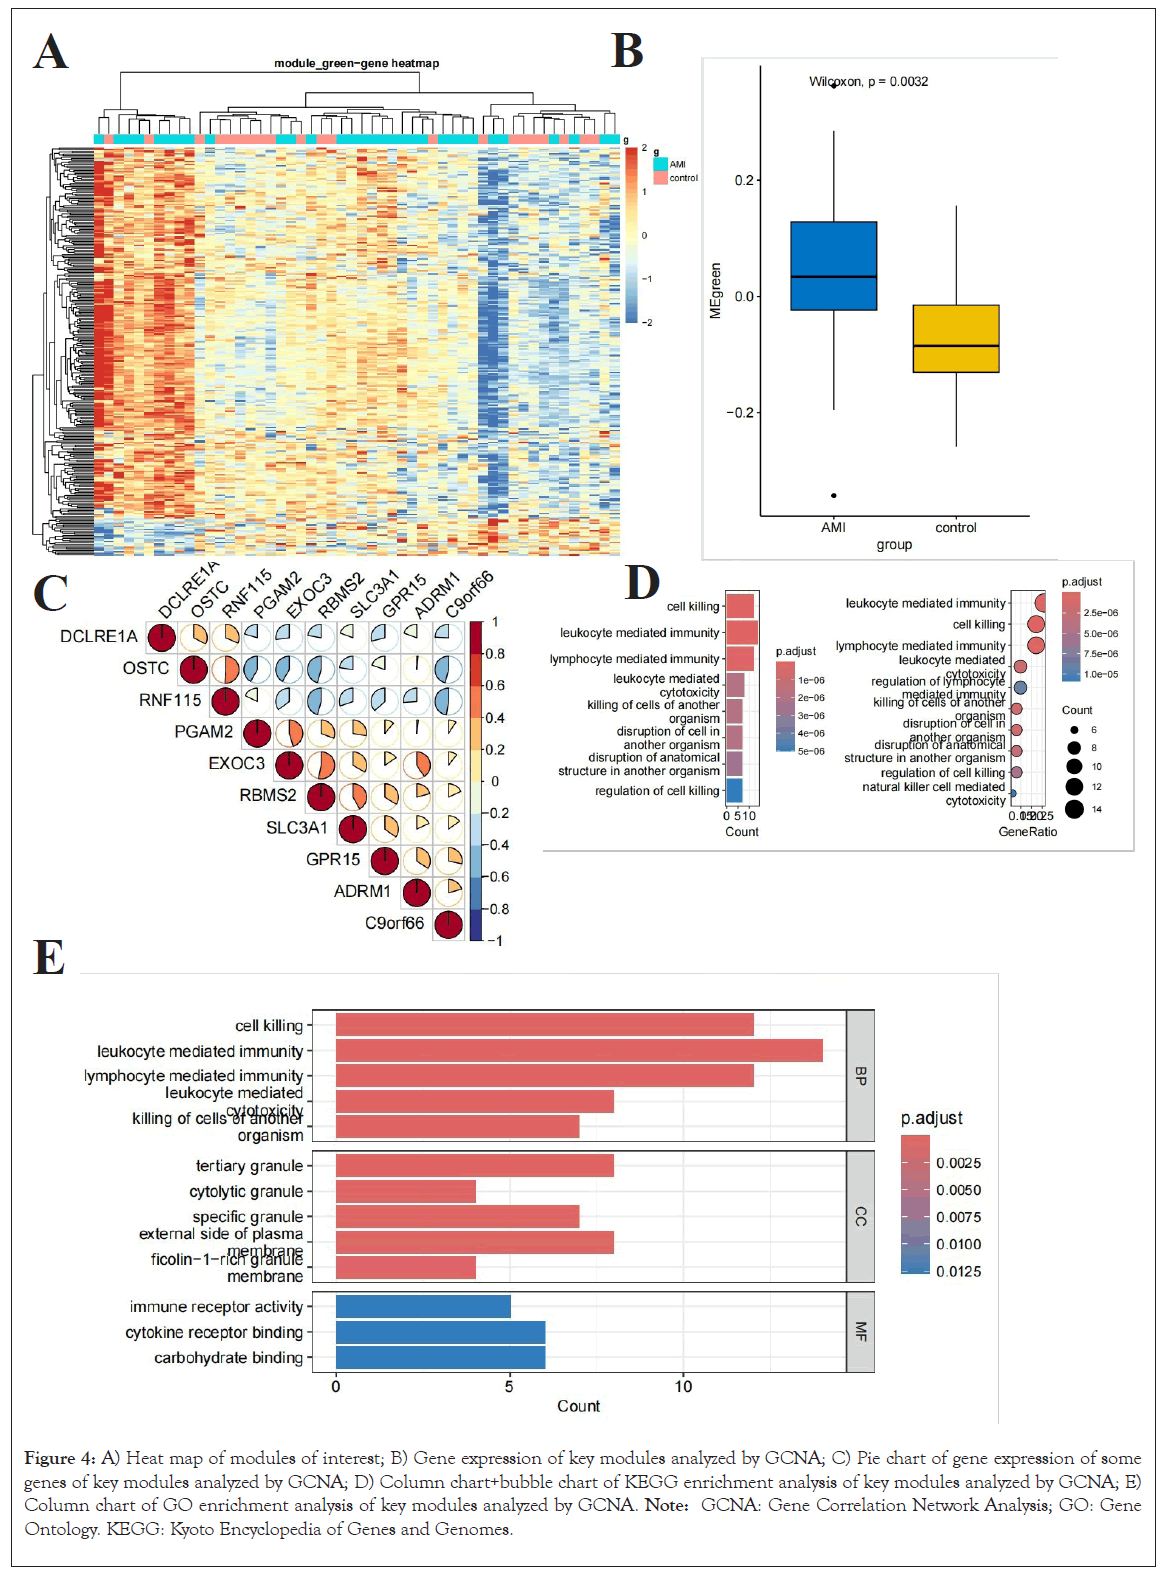
Figure 4: A) Heat map of modules of interest; B) Gene expression of key modules analyzed by GCNA; C) Pie chart of gene expression of some genes of key modules analyzed by GCNA; D) Column chart+bubble chart of KEGG enrichment analysis of key modules analyzed by GCNA; E) Column chart of GO enrichment analysis of key modules analyzed by GCNA. Note: GCNA: Gene Correlation Network Analysis; GO: Gene Ontology. KEGG: Kyoto Encyclopedia of Genes and Genomes.
Determination of pivotal genes and utilization of the principle of Mendelian randomization for analysis
Following extensive systemic examination of AMI genes differing in expression, apoptogenic genes and green module genes, we accurately pinpointed two vital genes BCL2L11 and PTEN (Figure 5A). Furthermore, to bolster the credibility and scientific rigor of our methods research, we incorporated the innovative strategy of Mendelian randomization into analyzing the extensive data acquired from GWAS (Figure 5B). To guarantee the validity of this analysis, we chose two GWAS investigations, intimately linked to AMI, boasting comparatively autonomous data sets as investigative subjects. All scrutinized SNPs exhibit F statistics exceeding 10, signifying their non-trivial IV status. The primary data encompassed within the AMI dataset demonstrate an intimate connection with the BCL2L11 dataset. Notably, three SNPs are particularly pertinent to the BCL2L11 dataset (Figure 5C). Given the potential causal link between BCL2L11 and AMI, we initially discovered a substantial inverse correlation between BCL2L11 and AMI from the findings of the initial dataset. Conversely, in the subsequent dataset, despite observing the identical negative correlation pattern, it did not attain statistical significance. As per the outcomes of IVW analysis, the Odds Ratio (OR) of the former dataset was 0.83 (95% Confidence Interval (CI=0.72-0.97; p=0.017), whereas in the latter analysis, OR transformed to 0.86 (95%CI=0.72-1.02; p=0.080). Additional weighted median analysis revealed that the results of the former dataset were statistically significant, whilst the remaining two MR analysis methodologies failed to draw analogous conclusions. To secure more definitive evidence, we also executed a meta-analysis of these two datasets. By computing I2 to gauge heterogeneity, a fixed-effect model was chosen for subsequent analysis, which unequivocally demonstrated a negative correlation between BCL2L11 and AMI (OR=0.84, 95%CI=0.75-0.94; p<0.01).
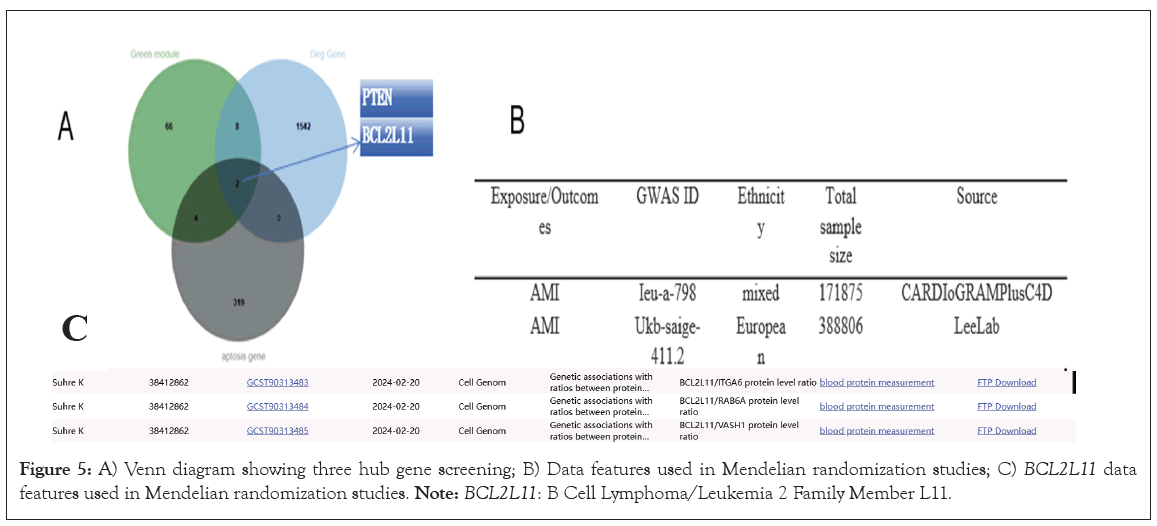
Figure 5: A) Venn diagram showing three hub gene screening; B) Data features used in Mendelian randomization studies; C) BCL2L11 data features used in Mendelian randomization studies. Note: BCL2L11: B Cell Lymphoma/Leukemia 2 Family Member L11.
Experimental validation
During the execution of this investigation, an extensive exploration into the impact of hypoxia on gene expression and apoptosis regulation commenced through conducting cellular cultivation, building upon prior preliminary experimentation, which yielded varying levels of miR-30e-5p transcripts post diverse intervals of exposure to identical concentrations of H2O2 (Table 1 and Figure 6). Two significant periods of interest were identified, including 24 h post treatment under various H2O2 dosages yielding distinct miR-30e-5p expressions (Table 2), followed by treatments employing 75 μM and 100 μM H2O2, leading to subsequent results depicted in Table 3.
| Concentration (μM) | 0 | 50 | 75 | 100 | 125 | F | P |
|---|---|---|---|---|---|---|---|
| 2-ΔΔCT | 1.000 ± 0.00 | 0.914 ± 0.036 | 0.729 ± 0.016 | 0.636 ± 0.059 | 0.491 ± 0.076 | 58.75 | <0.01 |
Table 1: Inter-group comparison of expression of CA16 miR-30e-5p after injury with different concentrations of H2O2.
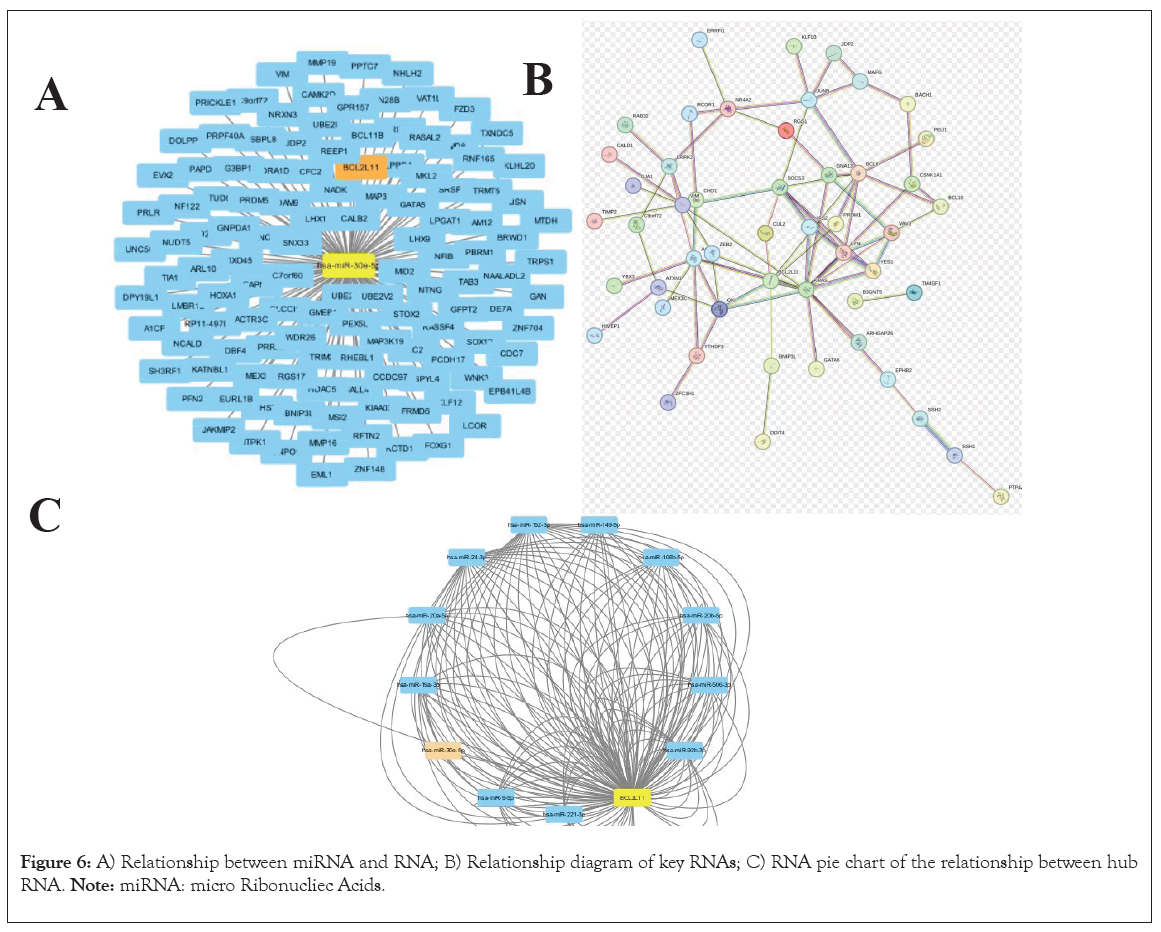
Figure 6: A) Relationship between miRNA and RNA; B) Relationship diagram of key RNAs; C) RNA pie chart of the relationship between hub RNA. Note: miRNA: micro Ribonucliec Acids.
| Concentration (μM) | Mean difference (95% confidence interval) | Significance | |
|---|---|---|---|
| 0 | 50 | 0.085* (0.0010, 0.1704) | p<0.05 |
| 75 | 0.038* (0.1865, 0.3559) | p<0.05 | |
| 100 | 0.363* (0.2791, 0.4485) | p<0.05 | |
| 125 | 0.509* (0.4241, 0.5935) | p<0.05 | |
| 50 | 75 | 0.186* (0.1008, 0.2702) | p<0.05 |
| 100 | 0.278* (0.1934, 0.3628) | p<0.05 | |
| 125 | 0.423* (0.3384, 0.5078) | p<0.05 | |
| 75 | 100 | 0.093* (0.0079, 0.1773) | p<0.05 |
| 125 | 0.238* (0.1529, 0.3223) | p<0.05 | |
| 100 | 125 | 0.145* (0.0603, 0.2297) | p<0.05 |
Note: *: The significance level of the mean difference was 0.05.
Table 2: Comparison of miR-30e-5p expression in cardiomyocytes injured by different concentrations of H2O2.
| Time | 0 hour | 3 hours | 6 hours | 12 hours | 18 hours | 24 hours | |
|---|---|---|---|---|---|---|---|
| 75 μM | 2-ΔΔCT | 1 | 0.984 | 0.763 | 0.688 | 0.675 | 2.888 |
| 2-ΔΔCT | 1 | 0.961 | 0.831 | 0.753 | 0.52 | 3.541 | |
| 100 μM | 2-ΔΔCT | 1 | 0.792 | 0.729 | 0.712 | 0.611 | 1.332 |
| 2-ΔΔCT | 1 | 0.895 | 0.749 | 0.522 | 0.323 | 2.144 |
Table 3: Expression of miR-30e-5P in cardiomyocytes damaged by different concentration H2O2.
Upon fractionating the cells, lentiviral transfer methods were implemented, resulting in the creation of four pools of pNA standards (Table 4).
| μM | CA16 | Average | Corrected | |||
|---|---|---|---|---|---|---|
| N | H | NC+H | miR+H | |||
| 200 | 0.762 | 0.472 | 0.641 | 0.396 | 0.568 | 0.6 |
| 100 | 0.527 | 0.386 | 0.473 | 0.252 | 0.41 | 0.36 |
| 50 | 0.351 | 0.201 | 0.293 | 0.164 | 0.252 | 0.254 |
| 20 | 0.206 | 0.104 | 0.157 | 0.065 | 0.133 | 0.169 |
| 10 | 0.142 | 0.056 | 0.102 | 0.032 | 0.083 | 0.087 |
| 0 | 0.078 | 0.021 | 0.038 | 0.012 | 0.037 | 0 |
Note: CA16: Carbonic Anhydrase; N: Normal group; H: Hypoxia group; NC+H: Overexpression control group; miR+H: miR-30e-5p+H group.
Table 4: Analysis of the results of lentivirus infection in 4 groups.
The pivotal timeframe of this research was chosen as 24 hours of hypoxia, during which comprehensive analysis and comparison were performed. Initially, gene expression patterns in groups N and H following hypoxia were scrutinized. Results revealed a substantial decrease in miR-30e-5p expression in group H (p<0.05). This observation implies that hypoxia may alter cell physiology via controlling specific gene expression. Subsequently, a miR-30e-5p overexpression model was established utilizing gene augmentation techniques based on transfection methodologies. Post model establishment, the NC+H group and the miR+H group were compared and evaluated. Results indicated a significant increase in Mir-30E-5p expression in the miR+H group (p<0.05). This outcome further substantiated the efficacy of the constructed miR-30e-5p overexpression model.
Subsequently, the apoptotic rate of CA16 cells post hypoxia induction was initially examined through caspase-3 activity assays. As demonstrated in the graph, compared to group N, the caspase-3 activity level in group H post hypoxia exhibited a marked upward trend (p<0.05). These observations suggest that hypoxia might stimulate apoptosis. To obtain more precise measurements, apoptosis kits and flow cytometry were utilized. The results corroborated those from the caspase-3 activity tests. Specifically, compared to group N, the apoptosis percentage of CA16 cells in group H post hypoxia was considerably elevated (p<0.05). However, following lentivirus infection with miR-30e-5p overexpression, the apoptosis ratio of CA16 cells in the miR+H group was notably reduced when compared to the NC+H group (p<0.05). These findings indicate that overexpression of miR-30e-5p can efficiently suppress apoptosis triggered by hypoxia.
miRNA-mRNA networks and drug prediction
Initially, comprehensive data amalgamation and scrutiny were conducted utilizing miRBase database, followed by production of the miRNA network diagram featuring BCL2L11 as the primary regulatory target (Figure 7). Subsequently, employing precise miRNA sequencing methodologies, we delved into the normal cohort and the AMI group within clinical specimens. Concurrently, meticulous statistical evaluation of these data was performed, revealing that only one miRNA, miR-30e-5p, exhibited substantial differential expression in the AMI group (p<0.05), exhibiting a marked decrease in expression when compared to the normal group. Notably, the conserved interaction interface between miR-30e-5p and BCL2L11 mRNA was identified via TargetScan database (Figures 8A and 8B). Furthermore, through extensive exploration using the RNAactDrug database, we discovered that the sensitivity of ispinesib mesylate, bleomycin (50 uM) and several other drugs demonstrated a notable positive correlation with the expression level of BCL2L11. Conversely, WZ3105 displayed a significant inverse correlation. Additionally, we procured the three-dimensional structural data of ispinesib mesylate, bleomycin and WZ3105 from PubChem database and computationally predicted the 3D structure of miR-30e-5p using RNAfold and Vfold3D databases. Ultimately, the corresponding molecular mechanism model was successfully formulated (Figures 8C-8E).

Figure 7: A) The expression level of miR-30E-50p in CA16; B) the expression level of caspase-3 in CA16; C) Proportion of CA16 apoptosis induced by hypoxia level flow cell results after lentivirus infection. Note: CA16: Carbonic Anhydrase.
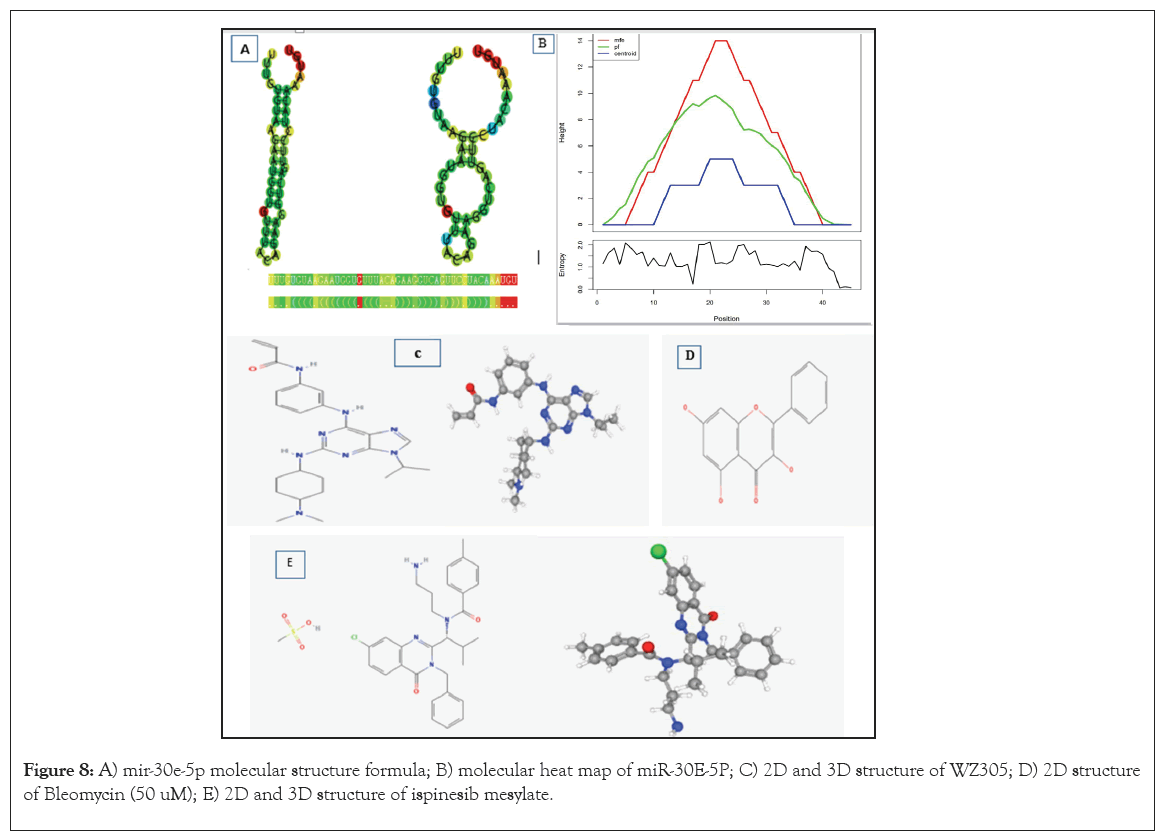
Figure 8: A) mir-30e-5p molecular structure formula; B) molecular heat map of miR-30E-5P; C) 2D and 3D structure of WZ305; D) 2D structure of Bleomycin (50 uM); E) 2D and 3D structure of ispinesib mesylate.
AMI, being the most prevalent cardiovascular ailment globally, is afflicted around 800 million individuals internationally [19]. Amidst the escalating tempo of human existence and heightened stressors across various facets of contemporary society, disorders traditionally linked to advanced age are progressively infiltrating younger demographics [20]. Pathologically, AMI is profoundly influenced by hypoxia and apoptosis [21-23]. Certain researchers suggest that apoptosis could potentially serve as a pivotal risk factor for AMI, potentially impeding cellular differentiation and regeneration, thereby serving as a significant catalyst for disease progression [24,25]. Nevertheless, the biological indicators and molecular mechanisms of apoptosis in AMI remain enigmatic [26].
Consequently, our research consortium procured single-cell AMI specimen data. After meticulous categorization, WGCNA clustering and Venn diagram screening, we successfully pinpointed two apoptosis-associated differentially expressed genes PTEN and BCL2L11 [27]. Furthermore, we executed RT-qPCR and lentivirus infection experiments via cellular experimentation to validate these pivotal genes, whilst employing Mendelian randomization to probe into the potential causal association between BCL2L11 and AMI [28]. Ultimately, we devised a network model encompassing the miR-30e-5p/BCL2L11 axis and identified two prospective novel medications for the management and treatment of AMI through drug susceptibility analysis: Ispinesib mesylate and bleomycin (50 uM) [29].
This investigation unveiled an essential gene module designated as "green" through WGCNA analysis. Genes within this module exhibit substantial correlation with signalling pathways such as cell destruction, leukocyte-mediated immune response, lymphocyte-mediated immune response, leukocyte-mediated cytotoxicity and killing of other biological entities [30].
AMI, a prevalent form of cardiac disease, primarily manifests in myocardial necrosis precipitated by prolonged and intense myocardial ischemia [30]. Such ischemia can inflict considerable damage on cellular functions, morphoology and metabolism. Globally, despite various treatment modalities, most AMI patients fail to make full recovery, often experiencing long-term physical impairments. Reestablishment of tissue blood supply is efficacious against AMI. However, new myocardial injuries, derangement of myocardial energy metabolism and the consequent Ischemia Reperfusion (IR) insult invariably mitigate clinical therapeutic gains. Overproduction of oxygen radicals (such as nitric oxide), lipid oxidation derivatives and Reactive Oxygen Species (ROS) stands amongst the primary contributors of IR injury [31]. Apoptosis, a pivotal player in cardiomyocyte structural and functional impairment, underscores the urgency to elucidate the precise mechanism of cardiomyocyte demise. Apoptosis, a genetically regulated cell death process and Important mechanism for preserving body equilibrium, currently encompasses over 20 known Bcl-2 family proteins, broadly categorized into anti-apoptotic proteins (like Bcl-2, Bcl-xl, Bcl-w, Mcl-1, etc.) and pro-apoptotic proteins, with the latter further subcategorized into: pro-apoptotic effectors (Bax, Bak) and pro-apoptotic activators (like Bim, Bad, Bid, etc. due to their exclusive BH3 domain, they are also referred to as BH3-only proteins). Comprehensive analysis indicates that effective intervention could be achieved by suppressing the activation of pro-apoptotic activator in AMI, a grave condition. Nevertheless, the exact mechanism of pro-apoptotic activator's contribution to the evolution of AMI remains incompletely elucidated [32]. MRI findings indicated that elevated BCL2L11 molecular levels were intimately linked to the onset of AMI, indicating a definitive causal association [33].
This investigation employed real-time fluorescent quantitative PCR methodology and lentiviral infection model for cell experimentation, revealing a significant upregulation of BCL2L11 gene expression in individuals afflicted with AMI [34]. This observation corroborates mounting evidence suggesting the critical interplay between microRNAs (miRNAs) and their targets in cardiovascular disease processes like AMI. Notably, miR-30e-5p a direct target of miR-30e-5p, can influence the activation extent of BCL2L11, thereby exacerbating myocardial damage instigated by AMI [35]. This study formally identifies BCL2L11 as the principal regulatory target of miR-30e-5p. BCL2L11 serves not only as a pivotal regulator of protein synthesis and cell proliferation but also as a significant contributor to myocardial ischemic injury. Phosphorylation is deemed a pivotal checkpoint in cardio protection. In this research, by diminishing BCL2L11 expression, we effectively downregulated the expression of apoptosis-associated gene caspase-3, concurrently augmenting the expression level of bcl-2. Consequently, we hypothesized that miR-30e-5p may further expedite the course of AMI by manipulating the expression of BCL2L11 [36].
To delve deeper into the upstream molecular mechanism underlying BCL2L11 regulation, we synthesized a miRNA-mRNA regulatory network and interconnected this with experimental data from miRNA-seq, revealing a pronounced decrease in the expression level of miR-30e-5p in conjunction with elevated BCL2L11 expression in patients afflicted with AMI. This finding corroborates a stable interaction site between miR-30e-5p and BCL2L11 mRNA [37].
These findings imply that miR-30e-5p exhibits potent antagoism towards cardiocyte hypertrophy triggered by angiotensin II. Furthermore, endosomal miR-30e-5p was shown to notably curtail the occurrence of scorch death in human renal proximal tubular cells exposed to high glucose [38]. Consequently, we propose that BCL2L11 might execute its biological functions at the post-transcriptional level via miR-30e-5p. Nevertheless, the precise role of miR-30e-5p in AMI and its clinical implications necessitate additional investigation and evaluation [39].
Moreover, our drug sensitivity analysis indicated a positive correlation between ispinesib mesylate and bleomycin (50 uM) and miR-30 expression levels, while concurrently demonstrating a negative correlation with BCL2L11 expression [40]. These observations suggest that ispinesib mesylate and bleomycin (50 uM) may impede the progression of AMI and facilitate BCL2L11 mRNA degradation by modulating miR-30e-5p expression.
Ispinesib, a novel, potent, selective and allosteric small molecule inhibitor of Kinesin Spindle Protein (KSP), alters the binding mode of KSP and microtubules by blocking Adenosine Diphosphate (ADP) release without affecting the dissociation of the KSP-ADP complex within microtubules, thereby inhibiting KSP mobility [41]. Ispinesib displays efficacy against diverse cancer cell proliferation and induces apoptosis, whilst also inducing tumor regression in vivo [42]. When paired with genistein, the growth suppression and apoptosis-inducing potential of ispinesib is amplified. Additionally, ispinesib enhances the effectiveness of anti-tumor agents like trastuzumab, lapatinib, doxorubicin and capecitabine. Bleomycin possesses the capacity to specifically impact DNA synthesis. It has been noted that cellular guanine and cytosine content correlates directly with the extent of cross-linking reaction instigated by mitomycin [43]. Notably, at higher dosages, the drug also exerts a substantial inhibitory influence on RNA and protein synthesis in cells. In vitro studies confirm that bleomycin efficiently suppresses the growth and propagation of B cells, T cells and macrophages, simultaneously impairing their antigen presenting capability and interfering with cytokine production such as interferon gamma, tumor necrosis factor alpha and interleukin-2 [44]. Despite the general lack of cell cycle specificity exhibited by antibiotic antitumor drugs, bleomycin stands out, exhibiting a predominant effect during G2 and mitosis phases [45].
Although our study established the intrinsic correlation of isopinesib mesylate and bleomycin at a concentration of 50 uM with miR-141-3p and BCL2L11 molecular cascades, as well as their paramount role in apoptosis amongst patients diagnosed with AMI, it introduces a novel viewpoint and illumination to the scholarly investigation in this area. However, it is essential to acknowledge certain constraints and hurdles encountered during this research [46]. Primarily, due to the restricted sample size, it becomes imperative to collate and amalgamate information from numerous sources to enhance the validity and precision of the study. Secondly, to guarantee the dependability of the analytical outcomes, supplementary verification via autotest samples should be conducted. Furthermore, though the level of relevant gene expression has been initially validated, the precise regulatory pathway warrants further exploration [47]. Notably, some findings hint that genetic elements could engender substantial variance in trait manifestation between various ethnicities and within an identical ethnicity. Consequently, when forecasting, diagnosing, intervening and evaluating the risk of AMI, the diversity and intricacy of genetic architecture across diverse populations must be thoroughly considered [48].
In conclusion, our exhaustive analysis unearthed two novel putative genes, namely, BCL2L11 and PTEN, employing intricate bioinformatic techniques. These discoveries were subsequently validated through stringent Mendelian randomization examination, underlining the significant role of BCL2L11. Additionally, these results were bolstered by in vitro experiments, thorough cell cultivation and apoptosis assessment. Subsequently, we proposed the hypothesis of "ispinesib mesilate, bleomycin (50 uM)/miR-141-3p/BCL2L11 axis", drawing upon extensive databases encompassing a variety of therapeutic targets. Through computational analysis, we pinpointed two potential drugs, ispinesib mesylate and bleomycin (50 uM) and elucidated their 2D and 3D atomic configurations, thereby proposing a novel approach to manage and prevent AMI.
This work was supported by the Special Support Project of Yan'an University, 2023 Graduate Education Innovation Program Project, YCX2023117.
[Crossref] [Google Scholar] [PubMed]
[Crossref] [Google Scholar] [PubMed]
[Crossref] [Google Scholar] [PubMed]
[Crossref] [Google Scholar] [PubMed]
[Crossref] [Google Scholar] [PubMed]
[Crossref] [Google Scholar] [PubMed]
[Crossref] [Google Scholar] [PubMed]
[Crossref] [Google Scholar] [PubMed]
[Crossref] [Google Scholar] [PubMed]
[Crossref] [Google Scholar] [PubMed]
[Crossref] [Google Scholar] [PubMed]
[Crossref] [Google Scholar] [PubMed]
[Crossref] [Google Scholar] [PubMed]
[Crossref] [Google Scholar] [PubMed]
[Crossref] [Google Scholar] [PubMed]
[Crossref] [Google Scholar] [PubMed]
[Crossref] [Google Scholar] [PubMed]
[Crossref] [Google Scholar] [PubMed]
[Crossref] [Google Scholar] [PubMed]
[Crossref] [Google Scholar] [PubMed]
[Crossref] [Google Scholar] [PubMed]
[Crossref] [Google Scholar] [PubMed]
[Crossref] [Google Scholar] [PubMed]
[Crossref] [Google Scholar] [PubMed]
[Crossref] [Google Scholar] [PubMed]
[Crossref] [Google Scholar] [PubMed]
[Crossref] [Google Scholar] [PubMed]
[Crossref] [Google Scholar] [PubMed]
[Crossref] [Google Scholar] [PubMed]
[Crossref] [Google Scholar] [PubMed]
[Crossref] [Google Scholar] [PubMed]
[Crossref] [Google Scholar] [PubMed]
[Google Scholar] [PubMed]
[Crossref] [Google Scholar] [PubMed]
[Crossref] [Google Scholar] [PubMed]
[Crossref] [Google Scholar] [PubMed]
[Crossref] [Google Scholar] [PubMed]
[Crossref] [Google Scholar] [PubMed]
[Crossref] [Google Scholar] [PubMed]
[Crossref] [Google Scholar] [PubMed]
[Crossref] [Google Scholar] [PubMed]
[Crossref] [Google Scholar] [PubMed]
[Crossref] [Google Scholar] [PubMed]
[Crossref] [Google Scholar] [PubMed]
[Crossref] [Google Scholar] [PubMed]
[Crossref] [Google Scholar] [PubMed]
[Crossref] [Google Scholar] [PubMed]
Citation: Ningxia W, Fei L, Meihua W, Liu N, Jie C (2024). Ispinesib Mesylate-Induced Oxidative Stress via miR-30e-5p/BCL2L11 Axis in Acute Myocardial Infarction: A Comprehensive Bioinformatics and Experimental Validation Investigation. J Clin Chem Lab Med. 7:292.
Received: 07-Aug-2024, Manuscript No. JCCLM-24-33417; Editor assigned: 09-Aug-2024, Pre QC No. JCCLM-24-33417 (PQ); Reviewed: 23-Aug-2024, QC No. JCCLM-24-33417; Revised: 30-Aug-2024, Manuscript No. JCCLM-24-33417 (R); Published: 06-Sep-2024 , DOI: 10.35248/2736-6588.24.7.292
Copyright: © 2024 Ningxia W, et al. This is an open-access article distributed under the terms of the Creative Commons Attribution License, which permits unrestricted use, distribution, and reproduction in any medium, provided the original author and source are credited.