Journal of Clinical Chemistry and Laboratory Medicine
Open Access
ISSN: 2736-6588

ISSN: 2736-6588
Research Article - (2020)Volume 3, Issue 1
Background: Laboratory investigations are critical elements for decision making on the appropriate patient
management. However, while they are providing services different tests are become victims of mistakes at the
different phases of the testing process. Particularly delivering timely test results for the clinicians is a common
problem particularly in the developing countries where there is uses of limited technological advancement skilled
human power.
Objective: The aim of this study was to determine laboratory turnaround time for clinical chemistry tests in
outpatient department at university of Gondar comprehensive specialized hospital, Northwest Ethiopia, 2019.
Method and materials: An institution based cross sectional study was conducted at university of Gondar specialized
hospital from February 24 to June 2019. A structured data collection checklist was used to collect relevant data for
this research project. Data completeness was checked manually on spot during the collection process. Then, the
collected data were entered into Epi-data software and exported into SPSS version 20. Mean, percent and frequency
of the outcome variables was analyzed through cross tabulation as appropriated. Finally, the results of this study were
presented in the form of tables, figures, and texts as appropriate.
Result: A total of 965 clinical chemistry tests were evaluated for their turnaround time. From this, the minimum and
maximum turnaround times were 140 and 466 minutes, respectively. The average turnaround time was 4.37hr
(262.28 minutes). The pre-analytical and post analytical phases were contributed the highest turnaround-times that
contributed 37.45% and 46.3%, respectively.
Conclusion and recommendation: In this university hospital, the reported laboratory turnaround time in the
outpatient department is long. Turnaround time for the critical test results should be improved. The hospital
management or any other stake holders should be responsible to design the appropriate strategy to reduce this high
turnaround time.
Turnaround time; Pre-analytical; Analytical; Post-analytical phase
The clinical laboratory is a central component of the health care system and plays a very important role in public health, disease control, and surveillance, and in the diagnosis and care of individual patient [1]. The reliable and timely result from laboratory investigations are a critical decision making elements in almost all aspects of health care and are essential for surveillance and control of disease [2]. Turnaround time (TAT) can be defined as the length of time from sample collection by the laboratory to the release of validated result.It is the most visible measurement of the quality of a laboratory service. TATis readily understood by both service users and providers alike and lends itselfto quantitative analysis, an essential prerequisite for evidencing quality and itsimprovement [3-5].
Turnaround time is commonly defined as a time from a test ordered until the result is reported, which is seen in the pre-analytical, analytical, and post-analytical phases. Pre-analytical phase is from when the sample is received by the lab to when the processing starts. Analytical phase is the actual time taken for the test to be conducted. Post-analytical phase is from completion of the test to dispatch of the report [6-9].
Among the multiple problems that are daily occurred, which are faced by the modern hospital laboratories today, prolonged TAT of laboratory investigations is a crucial one, which affects patient care as well as patient satisfaction adversely and substantially [10]. Laboratory service quality is influenced by the competence of the laboratory service providers who are the practitioners as well as the availability of the recommended working conditions. The speed with which laboratory results are reported impacts the institution as well as the patient. When results of routine laboratory tests are delayed, physicians show a tendency to reorder the same test. "Well done is quickly done. Augustus Caesar. Increased emergency room and hospital-based laboratories patients’ volume is associated with longer hospital laboratory processing times. Prolonged laboratory TAT may delay recognition of conditions in the acutely ill, potentially affecting clinician decision-making and the initiation of timely treatment. TAT is a barrier to patient process times and lengths of stay. Prolonged laboratory study results may also result in delayed recognition of critically ill patients and the initiation of appropriate therapies. Faster TAT is universally seen as desirable. Statements such as “the timelier and rapidly testing are performed the more efficient and effective will be the treatment” and “it is almost axiomatic that providing a more rapid result saves time and therefore money” are common in the literature [11,12].
The causes of delayed TAT may be pre-analytical, analytical or post-analytical. Causes of delays in TAT are most commonly associated with pre-analytical and post-analytical phases. The most common reasons for test delays are related to sample collection and transport, interruption of routine testing for urgent analyses, and communicating results to clinicians [13].
Improving TAT is a continuous long-term process. Specimen should be transported rapidly from collection areas or centers to the laboratory areas and if possible, by automatic systems. Accessioning of samples can be done by barcode readers. Proper equipment installation and trained laboratory personnel may help to reduce TAT. Timely quality control measures and updated standard operating protocols may be a time saver. Computerization of laboratories using improved soft wares to interface instruments, to review results and to deliver reports to clinicians may go a long way to improve the productivity of the fastest TAT [14]. Moreover, talking to customers and paying attention to their feedbacks may also improve TAT [15].
Laboratory analytical turnaround time is a reliable indicator of laboratory effectiveness; however, there is no study conducted so far about TAT among the clinical chemistry tests in the study area. Therefore, this study will provide a valuable information for healthcare workers and other stakeholders who would like to use the information to design the appropriate strategy. In addition, this study will invite and initiates other researchers to conduct a research on this critical problem and implement the most possible intervention according to local priorities and available test methods. Therefore the aim of this study was to determine laboratory turnaround time for clinical chemistry tests in the outpatient department at University of Gondar specialized hospital.
Study area
This study was conducted at University of Gondar specialized hospital which is located in Amhara region, Northwest Ethiopia, and 738km far from Addis Ababa, the capital city of Ethiopia. The town has around nine government health centers and one University Hospital. The Hospital is a tertiary level teaching Hospital that provides health services for more than 5 million inhabitants in its catchment area. University of Gondar comprehensive specialized hospital has different laboratory sections including; Clinical Chemistry, Hematology, Microbiology, Parasitology, Serology, Urinalysis, Mycobacterium tuberculosis examination laboratory, pathology laboratory, leshimania laboratory, blood bank laboratory and Emergency laboratories that play an important role in teaching, research and community services. The laboratory is equipped with semi-automated instruments in the Clinical Chemistry section, such as Mindray-BS 120 Auto Chemistry Analyzer, mini VIDAS ® automated immunoassay, and Roche Diagnostics AVL 9180 Series Electrolyte Analyzers. There is also an electronic laboratory information system (poly tech) which is synchronized between the laboratory, outpatient department (OPD), and inpatient department (IPD). The clinical chemistry laboratory section performs a large number of tests daily. These include lipid profile tests, kidney function tests, liver function tests, electrolyte profile tests, hormonal analysis, cancer markers detection, measurement of glucose and troponin.
Study design and period
A hospital-based cross-sectional study was conducted among OPD requested clinical chemistry tests at University of Gondar specialized hospital from February 24 to June 2019.
Population
Source population
All clinical chemistry tests requested from the OPD were considered as the source population.
Study population
All the clinical chemistry tests that fulfilled the eligible criteria were the study population.
Inclusion and exclusion criteria
Inclusion criteria
All clinical chemistry tests having standard turnaround time were included in the study.
Exclusion criteria
The exclusion criteria were illegible requests, torn requests papers, mislabeled samples and requests were excluded.
Variables
Dependent variable
Laboratory turnaround time.
Independent variable
Number of tests in each request paper, specimen collection day, number of requests, types outpatient department.
Operational definition
Based on the university of Gondar referral hospital, prolonged TAT is a TAT when the total TAT is >3hr and Within TAT is a TAT when the total TAT is ≤ 3hr for test types (glucose, creatinine, SGOT, SGPT, and lipid profiles).
Sample size and sampling technique
The sample size of the study was the total number of requests ordered for the clinical chemistry tests during the study period. All test and eligible tests having standard TAT were taken consecutively.
Data collection
Data about turnaround time for clinical chemistry tests including test type, number of devices, time interval in the preanalytical, analytical and post analytical phases, tests requested from the OPDs (medical, chronic, ANC, and surgical) were collected using structured checklist by the group members. The completeness of the data was checked during the collection process.
Data quality control
The data collection tool was pre-tested for its accuracy and consistency prior to the actual data collection. Further, the advisors were provide feedback and corrections on daily basis to the data collectors. Completion, accuracy and clarity of the collected data were checked carefully on a regular basis.
Data analysis and interpretation
For this research project, a structured data collection checklist was used to collect the data. Data completeness was checked manually on spot during the collection process. Then, the collected data were entered into Epi-data software and exported into the SPSS version 20. The mean, percentage and frequency of the outcome variables were analyzed through cross tabulation as appropriated. Finally, the results of this study were presented in the form of tables, figures, and texts as appropriate.
The total collected number of tests from request papers during 1-month study period was 1029. From these, 965 tests were completed the inclusion criteria.
The Frequency and percentage shown in Table 1.
| Sender | Frequency(N) | Percent (%) |
|---|---|---|
| Chronic | 302 | 31.3 |
| Surgical | 2 | 0.2 |
| Medical | 443 | 45.9 |
| ANC | 218 | 22.6 |
| Total | 965 | 100 |
Table 1: Frequency and percentage of clinical chemistry tests requested during the study period within the outpatient departments at UOG referral hospital, 2019.
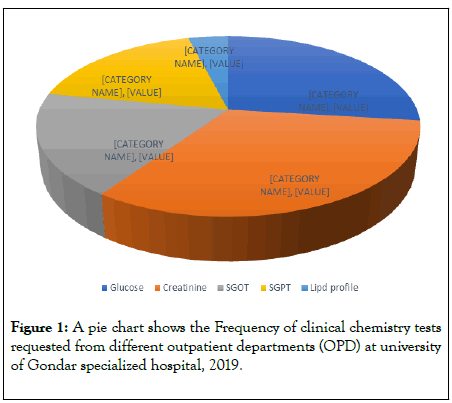
Among the total tests, 315(32.6%), 260(26.9%), and 39 (4%) were requested for the Cr, glucose and lipid profile tests, respectively. Shown in Figure 1.

Figure 1: A pie chart shows the Frequency of clinical chemistry tests requested from different outpatient departments (OPD) at university of Gondar specialized hospital, 2019.
The calculated TAT with the contribution of three phases: In the pre-analytical phase, 189, 579, and 197 tests were completed within 60, 60-120 and above 120 minutes, respectively. With respect to the analytical phase, 812(84.1%) and 153(15.6%) tests were completed below 45 minutes and above 45minutes, respectively. A very low proportion 65 (6.7%) of tests were reported to the physicians within 60 minutes. The remaining 403 (41.8%) and 497(51.5%) had TAT of 60-120 and more than 120 minutes, respectively. In this study, the mean analytical and post analytical TAT were, in 42.7 and 121.39 minutes, respectively. Shown in Table 2.
| Time interval | Pre analytical | Post analytical | |||
|---|---|---|---|---|---|
| Number of tests | % | Time interval | Number of tests | % | |
| <60min | 189 | 19.6 | <60 | 65 | 6.7 |
| 60-120 | 579 | 60 | 60-120 | 403 | 41.8 |
| >120 | 197 | 20.4 | >120 | 497 | 51.5 |
Table 2: Number of tests completed in time interval in each phase of the laboratory testing process at UOG specialized hospital, 2019.
TAT in each phase and its contribution for total TAT: We analyzed total TAT in minute that was 262.28 minutes (4.37hr) in average and the minimum was 140 minutes while 466 minute was the maximum TAT analyzed to complete 965 tests. This leads us to compare with other studies which were described in minutes. As we determined the contributions of pre and post analytical phases to the total TAT, the determined Pre-analytical phase average TAT in minutes was 98.11 with 37.4% contribution for the total TAT, and 121.39 minute in average (46.3%) was post analytical phase, shown in Table 3.
| Phases | Number of tests | Mean (in minute) | SD | Contribution of each phase for total TAT (%) |
|---|---|---|---|---|
| PRETAT | 965 | 98.11 | 46.07 | 37.4 |
| POSTTAT | 965 | 121.39 | 47.64 | 46.3 |
| Total TAT | 965 | 262.28 | 100 | |
Table 3: TAT in each phase and its contribution to the total TAT at clinical chemistry laboratory in outpatient department at UOG referral hospital, 2019.
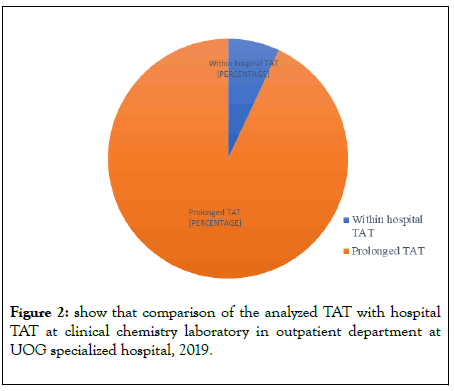
Analyzed TAT compared with hospital TAT: There was TAT that set as standard for different tests by the UOG referral hospital. When we compared the analyzed TAT with the hospital TAT, only 68 tests were within hospital TAT and the other 897 tests were prolonged out of 965 tests, shown in Figure 2.

Figure 2: show that comparison of the analyzed TAT with hospital TAT at clinical chemistry laboratory in outpatient department at UOG specialized hospital, 2019.
One of the most visible and talked about areas of laboratory services is how fast a test result is reach to a care giver. If the results from the laboratory are available in less time it helps the clinician to start the treatment in a single visit thus proving the clinician’s efficiency and increase patient satisfaction. Hence, it is our prerogative to ensure timeliness, on the other hand there are many things which are not under the control of laboratory professional which influence TAT and are responsible for many delays [3]. Our study demonstrated that the pre analytical (37.4%) and post analytical (46.3%) phases had more contribution for the total TAT as compared to analytical phase (16.3%). More times were spent on post-analytical phases as compared to pre-analytical phases which is similar with studies in Addis Ababa, Ethiopia.
Average TAT in our study was 4.37 in hour and 262.28 in minutes which was higher than studies in California (1.5-2.5) hr, and in India (163.9 ± 35.8) min. and also higher than studies conducted in China (43.6 ± 7.7) min, [16-18]. The possible reason for this difference might be due to automation difference, work load, difference in the number and experience of staff.
Based on our study total TAT was longer than TAT that is set as standard (3hr) for different tests (Cr, SGOT, SGPT, Glucose, Lipid-profile tests) by the university hospital. From our study only 68 tests (7%) of 965 tests was within hospital TAT and the remaining 897 tests (93%) had prolonged TAT with high pre and post analytical phases contribution for total TAT [19,20]. This suggests that when pre and post analytical phases are streamlined, then TAT can be significantly reduced [21,22]. Causes of delay in Turnaround Time as observed: Shortage of staff, trained technical personnel and other staff at various stages of sample collection, transport, processing and dispatch, Increasing work load on personnel, Increased workload on the machines & frequent shortage of reagent, Lack of proper automated facilities like Lab Information System, Time consumption at sample collection area, use single automation for many tests were possible reasons that we had studied [4].
Limitations of the study: The limitation of this study was in the study all chemistry tests that done in this university hospital were not included, tests like electrolytes, hormones due to frequent shortage of reagent to collect data regularly. On the other hand, TAT for each test was not determined due to none programmed TAT on the chemistry analyzer for each test, and during data collection there was interruption to collect data regularly in the study period.
In conclusion the mean TAT in this university hospital is longer than available bench marks, and the results of our present study showed that only 7% of tests were within hospital TAT and the majority of tests (93%) were prolonged, and post analytical phase had major contribution (46.3%) for this prolonged TAT. The study showed that a lot should be done to improve the TAT of our Laboratory.
We recommend that the ministry of health establish regular training programme which related to TAT and supervise hospitals and health centers to asses TAT as one of the health care performance parameters. Staffs should dispatch results within the hospital TAT. In addition, laboratory manager should supply necessary materials and reagents in order to reduce the prolonged TAT. The hospital management or any other stake holders should be responsible to design the appropriate strategy to reduce this high turnaround time. The results of our study are potentially valuable source of information for policy makers, but further investigation to find the cause of the delays and develop interventions to solve this problem related with the prolonged TAT.
Ethical consideration: The study was conducted after obtaining an ethical clearance letter from the University of Gondar, College of Medicine and health science, School of biomedical and laboratory science, Ethical Review Committee (ERC). In addition, a support letter was obtained from the School of Biomedical and Laboratory Sciences and submitted to the hospital. Finally, permission was obtained from the hospital manager and diagnostic laboratory head.
I confirmed that all the primary data for this manuscript are available and if anyone has interest to find the data, he can contact Abebaw Worede.
The authors declare that they have no competing interests.
Citation: Belay AW, Deress T (2020) Laboratory Turnaround Time for Clinical Chemistry Tests in Outpatient Department at University of Gondar Specialized Hospital, Gondar, North West Ethiopia, 2019. J Clin Chem Lab Med. 3.138. DOI: 10.35248/clinical-chemistry-laboratory-medicine.20.3.138
Received: 03-Apr-2020 Accepted: 17-Apr-2020 Published: 24-Apr-2020 , DOI: 10.35248/jcclm.20.3.140
Copyright: © 2020 Belay AW, et al. This is an open-access article distributed under the terms of the Creative Commons Attribution License, which permits unrestricted use, distribution, and reproduction in any medium, provided the original author and source are credited.