Journal of Geography & Natural Disasters
Open Access
ISSN: 2167-0587
![]() +44-77-2385-9429
+44-77-2385-9429
ISSN: 2167-0587
![]() +44-77-2385-9429
+44-77-2385-9429
Research Article - (2024)Volume 14, Issue 4
Massive landslides, mostly in the form of shallow and deep-seated rotational slumps, translational debris slides, rock slides, planar slope failures and incipient slides, some of which turned into debris flows, occurred in the Municipality of Bula in Camarines Sur. These landslides were triggered by heavy to torrential rains brought about by strong typhoons that hit the municipality. Most of the landslides and incipient slides occurred in the southwestern hilly portions of Bula, particularly in the barangays of Caorasan, Itangon, Inoyonan, San Francisco, Bagoladio, Taisan, and Kinalabasahan. Landslide events within the said barangays mainly occurred on steep to very steep river valley walls, on moderately dissected high hills and along road cuts. The study aims to classify between areas that are critical or susceptible to landslides and areas free from landslide. The latter can be maximized by the Local Government Unit of Bula for potential development. It also aims to determine the percent population exposed to different susceptibility rating. Weights of evidence model using GIS and pair-wise analysis between the landslide inventory and parameter maps was used in the study. The parameter maps include the geology, geomorphology, gradient, aspect, curvature, land cover, soil and proximity to major faults, road cuts, and major rivers/streams. Susceptibility zones were determined using natural breaks that includes the absent, low, moderate, and high. The fifth susceptibility rating is the actual landslides mapped in the municipality thru ground truthing and remote sensing. The results showed that LGU Bula have areas that are 11.3%, 24.6%, 21.6% and 0.1% susceptible to low, moderate, high and very high to landslides while the remaining 42.4% has zero possibility of landslide. Exposure analysis showed that there are several barangays that have high percentage of population exposed to low, moderate and high to very high landslide susceptibility.
Landslide; Susceptibility map; Weights of evidence model; GIS, Remote sensing; Exposure analysis
Despite of the progressive development in science and technology, natural hazards or disasters greatly affected the socio-economic conditions of the entire globe. Natural events such as earthquakes, landslides, floods, etc., were generally known as natural hazards. The monitoring of these hazards, the evaluation of its impact, and the general risk assessment are among the decisive steps toward selecting and dimensioning adequate protective measures [1].
Philippines is one of the most disaster-prone countries in the world due to its geographic location and physical environment. The country is located along the Pacific Typhoon Belt. The Philippine Atmospheric, Geophysical and Astronomical Services Administration (PAGASA) reported that every year, an average of twenty tropical cyclones entered the Philippine Area of Responsibility (PAR) and five of which were most destructive [2].
According to the World Risk Report 2018, the Philippines ranked third among all of the countries with the highest risks worldwide with an index value of 25.14% [3]. At least 60% of the country’s total land area was exposed to multiple hazards, and 74% of the population was susceptible to their impact [4].
In the past several years, strong typhoons have hit the Bicol Region that induced natural hazards such as landslides. A landslide is the movement of a mass of rock, debris, or earth down a slope under the influence of gravity [5]. According to Sugiarti et al., a landslide is a natural event that often occurs in hilly or mountainous areas during rainy seasons [6]. Landslides have a very detrimental impact; high rates of death and property damage caused by landslides make it one of the most damaging natural disasters in the world [7].
In any area, social development implies the development of infrastructure systems. The construction of infrastructure systems has faced a multitude of obstacles, among which the landslide processes were one of the most significant problems. The success of the realization of the development of any particular area was based on the quality design of the spatial plan. Therefore, one of the fundamental bases for the creation of a quality spatial plan was a previously created landslide susceptibility map of the area [8]. Landslide susceptibility maps enabled spatial planners to determine the probability of landslide occurrence in a given area when determining the purpose of the land use.
Study area
Bula is a first-class municipality in the Province of Camarines Sur. It is located on the southern portion of the Province of Camarines Sur. It is bounded by the Municipality of Minalabac on the Northwest, the Municipality of Pili on the north, the Municipality of Ocampo on its Northeast, the Municipality of Baao on the East, the Municipality of Nabua on the southeast and the Municipality of Balatan on its South. Based on the 2020 census conducted by Philippine Statistics Authority, the municipality has a total population of 73,143. It has a total land area of 16,772.84 hectares and half of this is situated on hilly or mountainous area both in the Southwestern and Northeastern portion of the municipality. Landslide occurrences in Bula were triggered by heavy rainfall brought by typhoons and severe weather conditions. Some of these landslides were not documented by the locals due to their location and accessibility, while some occurred near the community. One of the massive landslides occurred in the municipality was during the onslaught of 10 April, 2022, Typhoon "Agaton" at the boundary of Brgy. San Francisco and La Victoria. The landslide was classified as a debris slump covering approximately 9 hectares of agricultural land affecting the coconut plantations, trees, grasses, shrubs, and residential households at the area.
The study aims to determine the area percentile exposed to different landslide ratings and to provide a detailed landslide susceptibility map of the study area. The study also aims to determine the percent population per barangay exposed to such landslide ratings using exposure analysis. This could help the Local Government Unit of Bula in the formulation of their Municipal Disaster Risk Reduction and Management Plan (MDRRMP), Climate and Disaster Risk Assessment (CDRA), and Comprehensive Land Use Plan (CLUP). The landslide susceptibility map can serve as one of the road maps for the planning, design, and implementation of disaster preparedness, prevention, and mitigation practices. The study can also help improve the awareness of the residents to landslides and enhance their coping capacities and strategies.
Three activities were carried out in the study starting from the prefieldwork stage, field data gathering and post fieldwork stage. The pre-fieldwork stage involves the review of related literature and existing field data from previous mapping. Field data gathering involves the mapping of individual landslides using the hand-held GPS, brunton compass and a meter tape. Field data are recorded on a 1:10,000 scale landslide inventory field data sheet. The latter stage involves the data preparation and input, integration, analysis and final map outputting using ArcGIS.
In the landslide susceptibility analysis, landslide inventory map and factors maps were used. The inventory map includes all the landslides mapped during the field assessment and the landslides interpreted using remotely sensed data such as aerial photographs and satellite images. A total of 74 landslides were mapped in the study area but only 80% of the landslides were used in the analysis as training set. The remaining 20% were used as testing set to determine the prediction rate of the landslide susceptibility map. Low percentage testing set was chosen in order to keep statistical strength in the model [9]. The reduction on the training set leads to a decrease in likelihood values and lowering of the confidence of the weights [10]. For the factor maps, ten variables were used. These maps are spatial data obtained from different sources. Spatial data include the IFSAR Digital Elevation Model (DEM) that was obtained from NAMRIA from where the slope gradient, slope aspect, slope curvature, and surface drainage used in the analysis was derived, satellite images where road networks and present river courses were traced and updated, aerial photographs to identify the different geomorphic units within the municipality, published and unpublished sources where the geology underlying the study area was derived and field survey to verify the geology and geomorphology of the study area.
The study employed a weights of evidence model through bivariate statistics and pair-wise analysis. In this method, the weighted class value is determined based on the contribution of causative factors to landslide occurrence such as geomorphology, geology, slope gradient, slope aspect, slope curvature, soil cover, land use, and distances from active faults, roads, and rivers/streams. The positive and negative weights (W+ and W-) are calculated to know the spatial correlation in the presence or absence of the factor using the formula describe by Bonham-Carter and Bonham-Carter et al., [11,12]. The weights of evidence model are summarized as:

Where, W+ is the positive weight showing the causative factor is present at the landslide site and the magnitude of the weight is an indicator of the positive correlation and W- is the negative weight showing the absence of the causative factor and an indicator of negative correlation [10]. Npix are the number of pixels in each class that can be calculated as:
Npix1=Nslclass
Npix2=Nslide–Nslclassc
Npix3=Nclass–Nslclass
Npix4=Nmap–Nslide–Nclass+Nslclass
Where Nslclass is the number of landslide pixels per class, Nslide is the total number of landslide pixels, Nclass is the number of pixels per factor class and Nmap is the total number of pixels of factor map as shown in Figure 1.

Figure 1: Conceptual framework of the study.
A weight contrast C is the difference between the positive and the negative weights which reflects contrast values of the overall spatial association between factors and landslide occurrences [13].
Positive contrast indicates positive associations while negative values indicate negative associations.
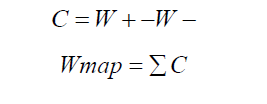
Lastly, the Landslide Susceptibility Index (LSI) is produced by combining all the Weighted map (Wmap) of each factor using the summation process. The final landslide susceptibility map was validated using the AUC-ROC to determine the success rate of the model as shown in Figure 2.
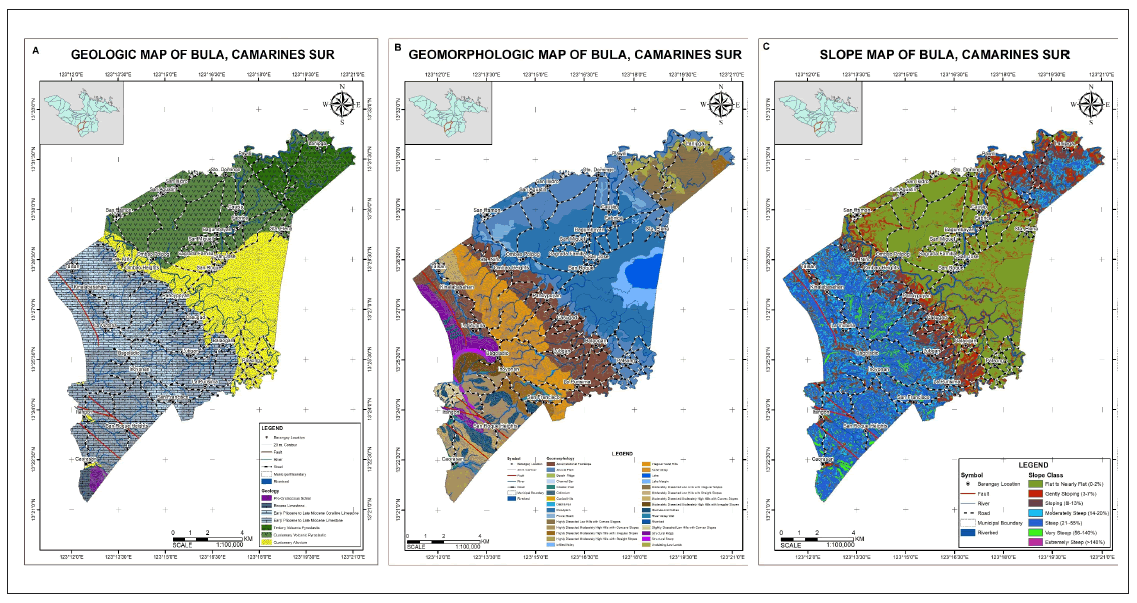

Figure 2: Landslide factor maps. Note: a) Geology; b) Geomorphology; c) Slope; d) Aspect; e) Curvature; f) Soil cover; g) Land cover; h) Fault; i) Road; j) River/stream.
The LSI was divided into four susceptibility zones using natural breaks in histogram. These zones include the absent, low, moderate and high susceptibility zones with increasing susceptibility ratings. The fifth zone is the actual landslides mapped in the study area through field survey and interpretation of remotely sensed data.
For the exposure analysis, the landslide susceptibility map was intersected to the population obtained from the Philippine Statistics Authority for the base year 2020 and to the built-up derived from the digitized building footprint using the latest satellite imagery of the municipality.
Temporal data such as rainfall amount and duration were not used in the analysis. The only temporal data used in the study was the landslide occurrences gathered through field surveys and the interpretation of available satellite images and aerial photographs. Probabilistic determination of landslide occurrences based on antecedent and/or cumulative rainfall was also not included in the study [14].
Relationship between landslide occurrences and causative factors
The association and relationship of landslide events and factor maps was determined in the study. The contribution and significance of the factor maps can be determined with the use of weights of evidence model. According to Bonham-Carter et al., the weights between 0.1 to 0.5 are middle predictive, 0.5 to 1 are moderately predictive, 1 to 2 are strongly predictive and >2 are extremely predictive [12]. Areas underlain by Early Pliocene to Late Miocene Limestone are moderately predictive with a positive weight of 0.911549 and areas situated on Early Pliocene to Late Miocene Coralline Limestone are middle predictive having a positive weight of 0.273233. Topographic units characterized by ravines and gullies and along river valley walls have extremely predictive weight of 2.72193 and 2.52141, respectively while areas characterized by highly dissected moderately high hills with concave slopes and moderately dissected moderately high hills with irregular slopes have strongly predictive values of 1.45527 and 1.04879, respectively. From the slope gradient, extremely steep and very steep slopes have extremely predictive weights of 2.67012 and 2.46341 while steep slopes are strongly predicted with values of 1.00705. Slopes oriented S-SW are moderately predictive with positive weight value of 0.570385. Undifferentiated mountain soils located on the southwest portion of the study area are moderately predictive with W+ value of 0.695174. From the land cover, the grassland and perennial crop are extremely and moderately predictive with W+ values of 2.27772 and 0.933371, respectively. In terms of slope curvature, both convex and concave slopes are strongly predictive with positive weight values of 1.44726 and 1.03558. Areas situated within 0-20 m. from the stream/river, 0-25 m from the road, and >50 m. from the fault have moderate and middle predictive with W+ values of 0.839761, 0.308823 and 0.008453.
Relationship of the landslide to the underlying lithologic unit
The municipality was underlain by several rock formations. These include the Pre-Cretaceoius Schist, Eocene Limestone, Late Miocene to Early Pliocene Limestone and Coralline Limestone, Tertiary and Quaternary Volcanic Pyroclastic and the recent Quaternary Alluvium.
The oldest rock underlying the municipality is the Pre-Cretaceous Schist. This consist of undifferentiated low-grade greenschist and albite-epidote-amphibolite facies situated on the southern portion of the municipality.
Unconformably overlying the schist is the Eocene Limestone. This consists of thinly-bedded, recrystallized and intensely fractured limestone. The fractures were filled with calcite. Overlying the Eocene Limestone is the Early Pliocene to Late Miocene Limestone and Coralline Limestone. This unit is thinly bedded and grades from lower sandy facies through middle crystalline and coralline facies to an upper marly section. On the northeastern most portion of the municipality, it is generally underlain by Tertiary Volcanic Pyroclastic. This unit consists of andesitic rocks with occasional deposits of perlite. The northern portion is commonly underlain by Quaternary Volcanic Pyroclastic. This unit consists of unconsolidated to slightly consolidated alternating layers of tuff and pyroclastic of andesitic composition derived from volcanic activity of Isarog Volcano. The recent deposits underlying the municipality is the Quaternary Alluvium. This unit is mainly composed of unconsolidated gravel, sand, silt, and clay materials that were very common on floodplains, alluvial plains, fluvial basins and coastal plains of Bula [15].
Most of the landslide occurrences were underlain by Late Miocene to Early Pliocene Limestone showing the highest value of C=1.83973. Areas underlain by this unit have high probability of landslide initiation. Significant landslide occurrences were also mapped on areas underlain by Late Miocene to Early Pliocene Coralline Limestone with moderate C value of 0.330221. The remaining lithologic unit shows negative C values and therefore have negative association and relationship with the landslide events as shown in Table 1.
| Rock type | Area (sq.m) | W+ | W- | Cgeology |
|---|---|---|---|---|
| Quaternary alluvium | 38,723,400 | -2.9426 | 14.5518 | -17.4944 |
| Quaternary volcanic pyroclastic | 38,874,600 | -17.232 | 0.2624 | -17.4944 |
| Tertiary volcanic pyroclastic | 14,893,800 | -0.205659 | 0.017866 | -0.223525 |
| Late Miocene to early Pliocene limestone | 48,696,000 | 0.911549 | -0.928181 | 1.83973 |
| Late Miocene to early Pliocene coralline limestone | 25,253,200 | 0.273233 | -0.056988 | 0.330221 |
| Eocene limestone | 1,042,350 | -13.6132 | -10.4216 | -3.19161 |
| Pre-cretaceous schist | 999,050 | -13.5707 | -10.3791 | -3.19161 |
Table 1: Weight of each lithologic unit vis-à-vis the landslide occurrences
Relationship of the landslide to the geomorphology
Bula is generally situated on four geomorphologic landforms namely: Denudational-karstic, denudational, fluvial and coastal landform. Denudational-karstic landform covered the southwestern portion of the municipality. This landform is a product of long-term continuous denudation, mass wasting and erosion processes acting on karstic area which resulted to slightly to highly dissected moderate to high hills with concave, convex, straight and irregular slopes, highly incised V-shape River valley and steep to very steep slopes of ravines and gullies. Landslide on watersheds is one of the mass wasting processes that continuously carving the present karstic-denudational landform of the municipality. The Northeastern portion of the Bula is situated on denudational hills and slopes [16]. This area is characterized by moderately to high dissected low hills with convex and irregular slopes and rolling to undulating lowlands as shown in Table 2.
| Terrain mapping unit | AREA (sq. m.) | W+ | W- | Cgeomorphology |
|---|---|---|---|---|
| Accumulational footslope | 24,890,900 | 16.7862 | -3.0721 | -13.7141 |
| Alluvial plain | 29,249,000 | -2.0673 | 12.8159 | -14.8832 |
| Beach ridge | 43,350 | -10.4332 | 6.9928 | -17.426 |
| Channel bar | 9,525 | -8.91784 | 8.50816 | -17.426 |
| Coastal plain | 4,04,850 | -12.6674 | 4.2787 | -16.9461 |
| Collovium | 46,525 | -10.5039 | 4.1378 | -14.6417 |
| Conical hills | 58,350 | -10.7304 | 0.000299 | -10.7307 |
| Debris fan | 1,45,525 | -11.6443 | 3.1197 | -14.764 |
| Floodplain | 36,867,100 | -17.179 | 0.247 | -17.426 |
| Fluvial basin | 21,58,000 | -14.3409 | 0.012899 | -14.3538 |
| Highly dissected low hills with convex slopes | 29,78,380 | 0.927905 | -0.027896 | 0.955801 |
| Highly dissected moderately high hills with concave slopes | 61,69,000 | 1.45527 | -0.1333 | 1.58857 |
| Highly dissected moderately high hills with irregular slopes | 36,31,680 | -14.8614 | -12.6256 | -2.23578 |
| Highly dissected moderately high hills with straight slopes | 19,93,230 | -14.2614 | -12.0256 | -2.23578 |
| Infilled valley | 16,000 | -9.43651 | 5.77329 | -15.2098 |
| Irregular karst hills | 14,436,000 | -0.990734 | 0.057256 | -1.04799 |
| Karst valley | 59,00,680 | -1.75434 | -1.50701 | -0.247331 |
| Lake | 28,65,600 | -14.6245 | 2.8015 | -17.426 |
| Lake margin | 32,31,330 | -14.7446 | 2.6814 | -17.426 |
| Moderately dissected low hills with irregular slopes | 49,93,100 | -15.1797 | -5.74309 | -9.43661 |
| Moderately dissected low hills with straight slopes | 4,08,550 | -12.6765 | 0.002399 | -12.6789 |
| Moderately dissected moderately high hills with convex slopes | 49,54,280 | -0.257653 | 0.006858 | -0.264511 |
| Moderately dissected moderately high hills with irregular slopes | 25,94,680 | 1.04879 | -0.02942 | 1.07821 |
| Ravines and gullies | 48,47,200 | 2.72193 | -0.54424 | 3.26617 |
| River valley wall | 10,35,280 | 2.52414 | 0.07345 | 2.59759 |
| Riverbed | 30,93,000 | -0.243301 | 17.1827 | -17.426 |
| Slightly dissected low hills with convex slopes | 11,45,200 | -13.7073 | 0.0068 | -13.7141 |
| Structural ridge | 51,91,830 | -1.91405 | 0.02675 | -1.9408 |
| Structural scarp | 10,69,530 | 0.07147 | -0.000473 | 0.071943 |
| Undulating lowlands | 40,54,950 | -14.9716 | -2.2927 | -12.6789 |
Table 2: Weight per geomorphologic unit or terrain mapping unit.
The fluvial landforms of Bula generally occur along major rivers. These include the floodplains, alluvial plains, fluvial basins, infilled valleys, and debris fans. These landforms generally characterized by gently sloping to nearly flat terrain. Debris from landslides occurred during torrential rains and typhoons were carried downstream and deposited on these landforms to form new deposits of Quaternary Alluvium. The coastal landforms are common on the southwestern portion of the municipality from Brgy. Caorasan to Itangon. These landforms are prone to unusual high tide and storm surge especially during typhoons [17].
Based on Table 2, areas that have high likelihood of landslide development were situated on ravines and gullies and along river valley walls of karstic denudational hills and slopes with C values of 3.26617 and 2.59759. Areas situated on highly dissected moderately high hills with concave slopes, moderately dissected moderately high hills with irregular slopes and structural scarp also have high likelihood of landslide occurrence.
Relationship of the landslide to the slope gradient, aspect and curvature factors
The degree of steepness of slope was one of the major contributing factors to the development of landslide. Considering the effect of gravity, when the slope gradient increases, the driving force also increases and the frictional/resisting force decreases. This resulted to a more unstable areas and thus, highly susceptible to landslide. Moreover, slope gradient greatly affects the slope stability and it’s Factor of Safety (FoS) [18]. Steep to extremely steep slopes have low factor of safety (less than 1) while flat to gently sloping areas have high factor of safety (more than 1). However, it should be noted that the factor of safety does not only depends on the slope gradient itself. There were also several parameters that should be considered in the calculation of the factor of safety as shown in Table 3.
| Factors | Class | Area (sq.m) | W+ | W- | C |
|---|---|---|---|---|---|
| Slope gradient | Flat to nearly flat (0-2%) | 65,499,800 | -4.63043 | 0.48993 | -5.12036 |
| Gently sloping (3-7%) | 17,919,400 | -1.89915 | 0.09663 | -1.99578 | |
| Sloping (8-13%) | 27,980,300 | -0.725789 | 0.098072 | -0.82386 | |
| Moderately steep (14-20%) | 19,579,100 | 0.19370 | -0.028574 | 0.22228 | |
| Steep (21-55%) | 34,267,000 | 1.00705 | -0.58805 | 1.59509 | |
| Very steep (56-140%) | 2,877,780 | 2.46341 | -0.20668 | 2.67009 | |
| Extremely steep (>140%) | 5,250 | 2.67012 | -10.9913 | 2.67009 | |
| Aspect | Flat | 4,760,980 | -15.1312 | -0.028732 | -15.1025 |
| N-NE | 45,981,200 | -0.364455 | -0.10884 | -0.2556 | |
| E-SE | 37,657,300 | -0.091453 | -0.02491 | -0.06654 | |
| S-SW | 39,656,000 | 0.570385 | 0.270899 | 0.29948 | |
| W-NW | 40,073,300 | -0.234943 | -0.06347 | -0.17147 | |
| Curvature | Concave | 5,122,350 | 1.03558 | -0.05863 | 1.09421 |
| Convex | 8,621,930 | 1.44726 | -0.192669 | 1.63993 | |
| Linear | 154,739,000 | -0.275964 | 1.31283 | -1.58879 |
Table 3: Weight per slope gradient, aspect and curvature class.
Slope aspect refers to the direction and/or orientation of slope faces of the terrain that were separated by topographic divide/ ridge. It can be an indirect measure of climatic influence on the hydrologic characteristic of the area, but it indicates possible collapse direction of landslide occurrences such as those for incipient slides. Aspect also indicates direction of surface runoff during torrential rains and typhoons that could trigger debris flows as a subsequent effect of landslide.
Degree of concavity and convexity of a slope played an important role in the initiation of landslide. In the study area, convex slopes generally situated on higher elevation where landslides and other erosion and mass wasting activities are common while concave slopes have high groundwater discharge that can also be susceptible to landslides [19].
Areas characterized by having steep to extremely steep slopes have high likelihood of landslide development with correlation difference of 2.67009. Slopes oriented S-SW has a contrast value of 0.29948. This contributes to areas moderately to highly susceptible to landslides. Areas with convex and concave slopes are likewise highly susceptible to landslides with weight contrast of 1.63993 and 1.09421, respectively.
Relationship of the landslide to the distance from road, stream/river and fault
In some cases, landslide occurrences were mainly due tectonic earthquake or ground shaking. The distance from the epicenter of an earthquake is inversely proportional to its magnitude. A 50 m distance from fault was used since the materials within this buffer zone are usually shattered and/or sheared and therefore less competent compared to the underlying materials situated more than 50 m. from the fault. Commonly, landslides were mainly due to unstable slopes left during road opening or widening [20]. These areas commonly have steep to very steep slopes without any engineering intervention or slope protection measures. These areas are generally very unstable where landslide is more likely to occur. Furthermore, road segments with steep to very steep slopes have low Factor of Safety (FoS) and therefore highly susceptible to landslide. Segments of road situated on sloping to extremely steep slopes were used in the data processing since the slopes on this area are commonly modified to compensate the necessary condition for road construction.
Streams and rivers likewise play an important role in landslide development. The banks constantly eroded and therefore resulted to slope instability. Undercutting at the foot of the riverbanks during flooding and turbulent flows commonly resulted to hanging and unstable riverbanks. Furthermore, long period of erosional processes caused the upstream rivers or bedrock channels to produce highly incised river valley where valley walls have steep to very steep slopes. These areas generally host most of the landslides in the municipality [21]. A 20 m buffer zone was used in the data processing in accordance with the provisions on legal easements stated on Presidential Decree 1067 (Water Code of the Philippines), Presidential Decree 705 (Revised Forestry Code), Republic Act No. 386 (Administrative Code of the Philippines) and DENR Administrative Order No. 2021-07.
Table 4, shows the relationship of landslide occurrences relative to the distance from fault. Generally, areas within 50 m from fault have high likelihood of landslide development. However, in the Municipality of Bula, areas that have high likelihood of landslide development is situated more than 50 m from fault with weight contrast of 13.9294. Road cuts greatly affect the development of landslides.
| Factors | Class | Area (sq.m) | W+ | W- | C |
|---|---|---|---|---|---|
| Fault | 0-50 m from Fault | 1,417,900 | -13.9209 | 0.008453 | -13.9294 |
| >50 m from Fault | 167,065,000 | 0.008453 | -13.9209 | 13.9294 | |
| Road | 0-25 m from Road | 4,405,450 | 0.308823 | -0.009762 | 0.318585 |
| >25 m from Road | 164,077,000 | -0.009762 | 0.308823 | -0.318585 | |
| River/stream | 0-20 m from the stream | 27,234,400 | 0.839761 | -0.292529 | 1.13229 |
| >20 m from the stream | 141,248,000 | -0.292529 | 0.839761 | -1.13229 |
Table 4: Weight per fault, road, and river/stream class.
In the study area, areas within 25 m buffer distance from road have high probability of landslide occurrences due to unstable slopes which rendered a weight contrast of 0.318585. In terms of distance from stream/river, areas with high probability of landslide occurrences are situated within 0-20 m buffer zone with correlation contrast of 1.13229 [22].
Relationship of the landslides to the soil cover
Overlying soil cover greatly influenced the initiation of landslide. Each type of soil has its unique characteristics and properties. Also, grading and sorting of particles and fragments greatly affects the permeability, porosity, and transmissivity of soils. Furthermore, each type of soil has its unique nutrients and minerals present and therefore affected the vegetation of an area (e.g., vegetation cover on mineralized area, ultramafics and metamorphic rocks are way different from karstic/limestone area and areas with volcanic origin).
Table 5, show that areas situated on undifferentiated mountain soils derived from long-term weathering of underlying limestones and clastics have high probability of landslide development with weight contrast of 2.70478.
| Soil cover | Area (sq.m) | W+ | W- | Csoil |
|---|---|---|---|---|
| Baao clay | 27,64,500 | -14.5885 | 0.016548 | -14.605 |
| Bigaa clay | 33,446,500 | -17.0816 | 0.22134 | -17.3029 |
| Creek terrace escarpment | 36,38,500 | -14.8633 | 0.021837 | -14.8851 |
| Faraon clay | 13,894,900 | -0.54703 | 0.037175 | -0.58421 |
| Iriga clay | 25,65,600 | -14.5139 | 0.015348 | -14.5292 |
| Maahas clay | 11,892,300 | -1.06884 | 0.048668 | -1.11751 |
| Minalabac clay | 29,90,500 | -14.6671 | 0.017913 | -14.685 |
| Nabua clay loam | 53,56,650 | -15.25 | 0.032316 | -15.2823 |
| Quingua silty clay loam | 45,59,450 | -15.0889 | 0.02744 | -15.1163 |
| Salvacion clay | 1,49,500 | -11.6712 | 0.000888 | -11.6721 |
| San vicente clay loam | 10,56,130 | -13.6263 | 0.006289 | -13.6326 |
| Taculod clay loam | 81,32,150 | -15.6675 | 0.049481 | -15.717 |
| Undifferentiated mountain soils | 78,035,200 | 0.695174 | -2.00961 | 2.70478 |
Table 5: Weight per soil class.
Relationship of the landslides to the land cover
Land cover likewise played an important role in the development of landslide. Slopes with shallow-rooted vegetation such as grassland, bushes and shrubs tend to be more susceptible to landslide. Deep-rooted vegetative cover such as trees help reduced the susceptibility to landslide as it holds the soil from erosion and mass wasting [23].
Among the land cover in the municipality, perennial crops and grasslands have high likelihood of landslide development with weight contrast of 2.94576 and 2.31885, respectively. This could be attributed to the shallow rooted vegetation and high secondary permeability of grasses as shown in Table 6.
| Land cover | Area (sq.m) | W+ | W- | Ccover |
|---|---|---|---|---|
| Annual crop | 87,225,200 | -3.63687 | 0.715686 | -4.35256 |
| Bushes/shrubs | 72,17,650 | -2.93666 | 0.041517 | -2.97818 |
| Built-up | 55,45,850 | -1.13268 | 0.022812 | -1.15549 |
| Fishpond | 114.775 | -11.4069 | 0.000682 | -11.4076 |
| Grassland | 7,73,350 | 2.27772 | -0.041134 | 2.31885 |
| Inland water | 69,62,650 | -1.0548 | 0.027711 | -1.08251 |
| Open/barren | 44,550 | -10.4605 | 0.000264 | -10.4608 |
| Perennial crop | 60,598,500 | 0.933371 | -2.01239 | 2.94576 |
Table 6: Weight per land cover class.
Landslide susceptibility map of Bula, Camarines Sur
A detailed landslide susceptibility map of Bula, Camarines Sur was derived from the calculation made on the computed weight contrast of each parameter. The computed weights were summed up and a natural break in histogram was used to identify the first four landslide hazard zones or Landslide Susceptibility Index (LSI).
LSI=Cgeology+Cgeomorphology+Cslope+Caspect+Ccurvature+ Croad+Cfault+Cstream+Csoil+Ccover
Where Cgeology=Weight contrast value of the underlying lithologic unit, Cgeomorphology=Weight contrast of terrain mapping units, Cslope=Weight contrast of slope, Caspect=Weight contrast of slope aspect, Ccurvature=Weight contrast of profile curvature, Croad=Weight contrast of the distances from road, Cfault=Weight contrast of the distances from fault, Cstream=weight contrast of the distances from stream/river, Csoil=Weight contrast of soil cover, and Ccover=Weight contrast of land cover.
The hazard zones include the absent, low, moderate, and high susceptibility to landslide. The fifth hazard zone was the actual landslides mapped during the field assessment and the landslides obtained from the interpretation of remotely sensed data such as aerial photographs and satellite images [24]. This hazard zone was labeled as very high susceptible to landslide or critical area to landslide as shown in Figure 3 and Table 7.
| Rating | Area (sq.m) | Weight |
|---|---|---|
| Absent | 71,301,280 | -38.421471 |
| Low | 18,957,500 | -14.322825 |
| Moderate | 41,347,440 | 8.269655 |
| High | 363,41,320 | 30.109053 |
| Very high | 1,77,971 | Mapped landslide |
Table 7: Weight per susceptibility zone.

Figure 3: Landslide susceptibility mapping framework/model of Bula, Camarines Sur.
Validation of the landslide susceptibility model
Validation is a very important tool to know the effectiveness of the model in predicting the landslides. Several methods are commonly used by other authors in validating the landslide susceptibility models. However, for this study, the landslide density, prediction rate and success rate were used to validate the accuracy of the model. Training sets or 80% in the landslide inventory were used to determine the success rate of the model vis-à-vis the landslide density. The remaining 20% or the testing sets were used to determine the prediction rate of the model. Area under Curvature (AUC) shows that the success rate is 0.938 as shown in Figure 4. Using the same method, the prediction rate was calculated at 0.886 as shown in Figure 5. This means that the accuracy of the model is very good population exposure analysis using 2020 PSA Population Census.

Figure 4: Success rate of the model.

Figure 5: Prediction rate of the model.
The goal of the study is not only to provide a reliable landslide susceptibility map but also to determine the population exposed to different susceptibility zone. It is imperative that any spatial maps should be further used to a specific purpose such as exposure, risk and vulnerability analysis to determine how many of the people or population might get affected by different landslide susceptibility zones [25]. Using the 2020 PSA Census data, the percent exposed to each susceptibility zones were determined by intersecting the number of populations per barangay with the landslide susceptibility map created by the study. However, only three landslide hazard zones (low, moderate, and high) were used since areas identified as absent is already not susceptible to landslide. Critical areas were also not used in the processing since it was already incorporated on areas identified as highly susceptible to landslide.
Exposure analysis shows that there are several barangays that have high number of populations exposed to low, moderate and high to very landslide susceptibility zones as shown in Table 8.
| Barangay | Population | People at risk | Risk (%) |
|---|---|---|---|
| Balaogan | 3,802 | 2,556 | 67.24 |
| Caorasan | 1,492 | 1,039 | 69.62 |
| Casugad | 4,281 | 2,350 | 54.9 |
| Fabrica | 5,569 | 923 | 16.57 |
| Itangon | 1,839 | 840 | 45.69 |
| Kinalabasahan | 649 | 12 | 1.87 |
| La Purisima | 1,649 | 212 | 12.88 |
| La Victoria | 1,444 | 38 | 2.65 |
| Lanipga | 1,685 | 1,219 | 72.36 |
| Lubgan | 2,593 | 475 | 18.3 |
| Ombao Heights | 1,619 | 405 | 25.04 |
| Palsong | 7,002 | 2,091 | 29.87 |
| Panoypoyan | 2,339 | 928 | 39.71 |
| Pawili | 2,997 | 2,435 | 81.24 |
| San Francisco | 1,319 | 8 | 0.63 |
| San Ramon | 1,813 | 9 | 0.49 |
| San Roque heights | 2,446 | 279 | 11.41 |
| Sta. Elena | 2,226 | 23 | 1.01 |
| Sto. Niño | 1,408 | 923 | 65.58 |
| Taisan | 782 | 60 | 7.62 |
Table 8: Population at risk to low landslide susceptibility.
Findings
The residents of Bula, Camarines Sur, are at risk to landslides. Landslide-prone areas are situated in the Southwestern portion of the municipality, characterized by sloping to extremely steep slopes. A large portion of land on the northeastern portion of the municipality in Brgy. Lanipga are also at risk to landslides as shown in Table 9.
| Barangay | Population | People at risk | Risk (%) |
|---|---|---|---|
| Bagoladio | 1,599 | 966 | 60.44 |
| Balaogan | 3,802 | 623 | 16.4 |
| Caorasan | 1,492 | 216 | 14.48 |
| Casugad | 4,281 | 986 | 23 |
| Inoyonan | 1,305 | 474 | 36.3 |
| Itangon | 1,839 | 543 | 29.5 |
| Kinalabasahan | 649 | 580 | 89.45 |
| La Purisima | 1,649 | 1,374 | 83.35 |
| La Victoria | 1,444 | 1,366 | 94.62 |
| Lanipga | 1,685 | 368 | 21.8 |
| Lubgan | 2,593 | 1,816 | 70 |
| Ombao Heights | 1,619 | 1,055 | 65.18 |
| Palsong | 7,002 | 105 | 1.5 |
| Panoypoyan | 2,339 | 694 | 29.67 |
| Pawili | 2,997 | 468 | 15.62 |
| San Francisco | 1,319 | 752 | 57.06 |
| San Roque heights | 2,446 | 1,040 | 42.5 |
| Sto. Niño | 1,408 | 470 | 33.35 |
| Taisan | 782 | 671 | 85.9 |
Table 9: Population at risk to moderate landslide susceptibility.
Five landslide hazard zones are present in the municipality. These include the absent, low, moderate, high, and very high susceptible to landslide. The area percentage covered by these hazard zones with respect to the municipal boundary is 42.4%, 11.3%, 24.6%, 21.6% and 0.1%, respectively.
Most of the landslides mapped in the municipality are in the form of shallow and deep-seated rotational slumps, translational debris slides, rockslides, planar slope failures, and incipient slides. The debris and earth slumps are common in areas with thick soil cover, while the debris and rockslides are very common on jointed bedrocks along road cuts, coastal headlands, and exposed outcrops along river channels. Planar slope failure is also common on bedrocks along road cuts with an unfavorable orientation of joints.
Several factors affected the development of landslides. These factors were used as parameters to come up with a detailed landslide susceptibility map of the municipality. However, six factors significantly played an important role in landslide development. These include the slope gradient, slope aspect, geology, geomorphology, land cover, and curvature of slopes. The distance from faultline, road cuts, and river channels have minimal impact on the landslide susceptibility map as shown in Table 10.
| Barangay | Population | People at risk | Risk (%) |
|---|---|---|---|
| Bagoladio | 1,599 | 632 | 39.55 |
| Caorasan | 1,492 | 172 | 11.55 |
| Casugad | 4,281 | 23 | 0.54 |
| Inoyonan | 1,305 | 831 | 63.71 |
| Itangon | 1,839 | 416 | 22.61 |
| Kinalabasahan | 649 | 56 | 8.68 |
| La Purisima | 1,649 | 62 | 3.73 |
| La Victoria | 1,444 | 39 | 2.73 |
| Lanipga | 1,685 | 29 | 1.71 |
| Lubgan | 2,593 | 127 | 4.91 |
| Ombao Heights | 1,619 | 132 | 8.17 |
| Panoypoyan | 2,339 | 15 | 0.65 |
| San Francisco | 1,319 | 549 | 41.67 |
| San Roque heights | 2,446 | 1,127 | 46.08 |
| Sto. Niño | 1,408 | 15 | 1.07 |
| Taisan | 782 | 51 | 6.48 |
Table 10: Population at risk to high to very high landslide susceptibility.
Exposure analysis showed that there are high percentage of population that are at risk to moderate and high to very high landslide.
Landslide-prone areas are generally situated on the northeast and southwest portion of the municipality. Roughly 8,470.44 hectares of land are at risk to landslide due to sloping to very steep terrain. These areas are situated on slopes with slope gradient ranging from 8% to more than 50% that are generally suitable for forest use.
Seven barangays in the municipality were identified as critical or highly susceptible to landslides. These include the barangays of Taisan, Kinalabasahan, La Victoria, Bagoladio, Inoyonan, San Francisco and San Roque Heights. Seven barangays were also identified as moderately susceptible to landslides. These barangays are Ombao Heights, Lubgan, La Purisima and portions of barangays Sto. Niño, Panoypoyan, Lubgan and Balaogan. The rest of the barangays are either situated in areas with low susceptibility to landslides or absent to landslides. Exposure data and landslide susceptibility map provided by this study can greatly help the Local Government Unit of Bula and the Barangay Officials in their planning, such as in the formulation of disaster risk reduction and management plans, comprehensive land use plan, forest land use plan, and climate and disaster risk assessment.
Areas identified as high to very highly susceptible to landslide have a high probability of landslide development and, therefore not recommended for siting any land development projects. Areas rated as moderately susceptible may be used for development projects, provided that a detailed study of the area is conducted. Areas with low to absent to landslide can generally be used for siting any development projects. During the field assessment, there are several households that were identified at risk to landslide. These households are situated within the immediate vicinity of the landslides. Retrogressive movement of landslides could affect these households if not timely evacuated during torrential rains and typhoons.
The Local Government Unit of Bula may include the detailed landslide susceptibility map and data from exposure analysis provided by the study on the comprehensive land use plan, forest land use plan, climate and disaster risk assessment, and municipal disaster risk reduction and management plan. If possible, building permit applications should be verified to the landslide susceptibility map before approval.
The Sangguniang Bayan of Bula may formulate a policy or ordinance declaring areas that are high to very highly susceptible to landslide as no building and no dwelling zone. Areas situated on moderately susceptible to landslide should secure an Engineering Geological and Geohazard Assessment (EGGA) or geotechnical studies before siting any land development projects.
The Sangguniang Bayan of Bula can likewise formulate a local policy for the strict implementation of legal easements pursuant to Presidential Decree 1067 (Water Code of the Philippines), Presidential Decree 705 (Revised Forestry Code), Republic Act No. 386 (Administrative Code of the Philippines) and DENR Administrative Order No. 2021-07.
The Sangguniang is further recommended to pass a policy directing the barangay officials to regularly monitor the identified landslides that poses a threat to the community. Any ground cracks or movement from these landslides should be reported to MDRRMO or MGB-5.
The Local Government Unit of Bula, through its Municipal Disaster Risk Reduction and Management Office, may conduct CEPAC (Communication, Education, and Public Awareness Campaign) to barangay officials and residents to enhance their capacity and awareness to landslide hazards.
First and foremost, the author would like to praise and thank God for all the blessings I have received throughout the entire duration of my post-graduate study.
The author also wishes to extend his sincerest gratitude to the stakeholders, especially MGB-V, NAMRIA, DENR-SMD, DA, and LGU Bula, who provided the necessary data for the completion of the study. Special thanks are also given to the MGB-V, under its Regional Director, Engr. Guillermo A. Molina Jr. IV for the institutional support to the study.
Lastly, the author would also like to express his wholehearted thanks to his family, especially to his wife, for her unending love, support, and understanding.
Citation: Villarez FT (2024). Landslide Susceptibility Mapping and Population Exposure Analysis of Bula, Camarines Sur. J Geogr Nat Disasters. 14:328.
Received: 21-Nov-2024, Manuscript No. JGND-24-35329; Editor assigned: 25-Nov-2024, Pre QC No. JGND-24-35329 (PQ); Reviewed: 10-Dec-2024, QC No. JGND-24-35329; Revised: 17-Dec-2024, Manuscript No. JGND-24-35329 (R); Published: 24-Dec-2024 , DOI: 10.35841/2167-0587.24.14.328
Copyright: © 2024 Villarez FT. This is an open-access article distributed under the terms of the Creative Commons Attribution License, which permits unrestricted use, distribution, and reproduction in any medium, provided the original author and source are credited.