Clinical & Experimental Cardiology
Open Access
ISSN: 2155-9880
ISSN: 2155-9880
Research Article - (2016) Volume 7, Issue 12
Background: In a previous meta-analysis ejection fraction (EF) was greater in heart failure and preserved ejection fraction (HFPEF) patients than it was in healthy controls (HC). In this study differences between indices of end-systolic and diastolic volumes (ESVi and EDVi) in HFPEF compared to HC were studied, in search for an explanation for the difference in EF. In addition, it was hypothesized that changes in ESVi and EDVi may provide understanding of the process of left ventricular remodeling.
Methods: Literature was searched for studies reporting ejection fraction (EF), EDVi and ESVi. Pooled differences were estimated with weighted and standardized mean differences. The normalized mean difference of X, 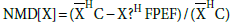 , where X=EDVi or ESVi and
  is the mean of X, was plotted as a function of the difference between EF in HC, EFHC, and HFPEF, EFHFPEF, for each study included.
Results: Fourteen studies were analyzed; HFPEF patients were 3.6 years older and 3.2 BMI units heavier than HC (P <0.00, for both); EFHFPEF was 1% smaller than EFHC (WMD 95%CI: -1.66, -0.5; p=0.057). EDViHFPEF and ESViHFPEF were not different from their HC counterparts. Graphical analysis revealed that when EFHFPEF >EFHC, both EDViHFPEF and ESViHFPEF were smaller than their HC counterparts (i.e. NMD[ESVi] and NMD[EDVi] >0), and the absolute difference between ESViHC and ESViHFPEF was greater than that observed between EDViHC and EDViHFPEF. When EFHFPEF<=EFHC, both EDViHFPEF and ESViHFPEF were either greater or smaller than their HC counterparts.
Conclusions: Meta-analysis showed agreement between changes in EDVi and ESVi and the value of EF. On average, the changes demonstrated were not characteristic of concentric hypertrophy. Graphic analysis showed that when EFHFPEF>EFHC, changes in EDVi and ESVi supported characteristics of concentric hypertrophy, and when EFHFPEF
Keywords: Heart failure with preserved ejection fraction; Ejection fraction; End-Diastolic volume; End-systolic volume
AF: Atrial Fibrillation; BMI: Body Mass Index; CAD: Coronary Artery Disease; DM: Diabetes Mellitus; EDV: End Diastolic Volume; EDVi: End Diastolic Volume Index; EF: Ejection Fraction; ESV: End Systolic Volume; ESVi: End Systolic Volume Index; HFPEF: Heart Failure Preserved Ejection Fraction; HTN: Hypertension; LV: Left Ventricle; MD[X]: Mean Difference of X: where X is EDVi or ESVi, and
  is the mean of X; NMD[X]: Normalized MD[X], defined:
 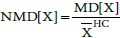 SMD: Standardized Mean Difference; WMD: Weighted Mean Difference
Ejection fraction (EF) is defined by the ratio: (EDV-ESV)/EDV, where EDV and ESV are end diastolic and systolic volumes of the left ventricle (LV), respectively. Therefore,
 (Equation 1)
From a mathematical point of view there is a strict relation between EF and the fraction ESV/EDV. It is still unknown whether on average the relation in equation 1 is preserved in the setting of heart failure and preserved ejection fraction (HFPEF) compared to healthy controls (HC).
It was previously reported using meta-analysis that EF in HFPEF is often “greater-than-normal”, that is greater than the EF in HC of the same age [1]. The physiological basis for this finding is not clear, though a hypothesis was proposed [2]. Although remodeling processes in HFPEF, accounting for morphological changes in the LV, are well established [3,4], to the best of our knowledge investigations comparing how ESV, EDV and EF in HFPEF differ from their counterparts in HC were not published. Specifically, if EF in HFPEF (EFHFPEF) is greater than EF in HC (EFHC), the fraction ESV/EDV in HFPEF must be smaller than that in HC. The magnitude of ESV/EDV may decrease in one of several forms, yet the expected form is characterized by a decrease in EDV accompanied by a greater relative decrease in ESV. This form is expected based on remodeling changes occurring in HFPEF. The concentric LV hypertrophy compromises LV cavity rendering it smaller. Due to the hypertrophy LV walls are less compliant; LV expansion during filling is limited, and as a result EDV is limited [4]. If stroke volume is to be preserved with a smaller EDV, ESV must decrease as well but to a greater extent than the decrease in EDV. Other changes are also possible, as described in Maurer et al. [5], where approximately 10- 15 % of HFPEF patients had an EDV greater than normal.
This study aimed to characterize the average difference between: (a) EDV in HFPEF and HC; (b) ESV in HFPEF and HC; and (c) to investigate whether the average differences in (a) and (b) relate to the values of EF in HFPEF and HC, at rest.
As EDV and ESV vary with body surface area, the indexes were considered (EDVi and ESVi, respectively). It was hypothesized that in HFPEF compared to HC at rest, EDVi and ESVi both decreased in magnitude; however, the decrease in ESVi was greater than that of EDVi, and these changes accounted for the increased EF in HFPEF compared to HC.
Studies in which ESVi and EDVi were measured during standard trans-thoracic echocardiographic examination, at rest, in subjects with HFPEF and in HC were sought. No limitations were set regarding the goals and design of the included studies. We systematically searched MEDLINE and EMBASE with the following search terms: „heart failure preserved ejection fraction“ OR „hfpef“ OR „heart failure normal ejection fraction“ OR „diastolic heart failure“ AND „end systolic volume“ AND „end diastolic volume“ (limits: Humans, English language); date of last PUBMED search: May 2015. We complemented our search by scanning the reference lists of all included studies to identify studies that were not obtained from the preliminary electronic search. Contact was made with authors of primary studies which reported part of the data in an attempt to retrieve unpublished data.
All titles identified by the electronic search were individually screened by two authors (RED, GD). Abstracts were reviewed if the comparison of HFPEF (or diastolic heart failure) and HC could not be ruled out from the title. Full-length relevant manuscripts were retrieved for an independent inclusion assessment. The quality of included studies was assessed using the STROBE criteria for observational studies [6]. Differences in opinion were resolved through open discussion between 3 authors (GD, RED, DS).
HFPEF was defined as a combination of: (1) clinical manifestation of heart failure complying with standard criteria reported in the literature (e.g. Framingham criteria [7] and European Society of Cardiology [8]); and (2) an EF value ≥ 50%. HC were defined as healthy subjects at recruitment who were not receiving any medical treatment. The difference in mean age between the HFPEF and HC groups was limited to less than 5 years (otherwise study was not included for further analysis). Studies were excluded if subjects were reported to have valvular disease greater than mild or significant arrhythmias.
We collected the following data items: number of participants, mean and standard deviation for HFPEF and HC of age, blood pressure (BP), heart rate, body mass index (BMI), body surface area (BSA), comorbidities (hypertension, diabetes mellitus and coronary artery disease) and echocardiographic measures: EDVi, ESVi, and EF. Male frequency in each group was also collected.
The outcome measures from the primary studies were EF (in percent) EDVi and ESVi (in ml/m2). Methods of echocardiographic measurement were accepted as long as both groups (HFPEF and HC) were evaluated by the same method.
The statistical analysis and graphical presentation were performed using Stata version 12.1 (Stata Corp., College Station, TX). For continuous variables (e.g. age, EF), we used the means and standard deviation of the two groups: HFPEF and HC. The effect sizes were calculated using Weighted Mean Difference (WMD). Standardized Mean Difference (SMD) was also calculated in order to quantify the variables on the same scale. A difference was defined as the mean value of a variable in HC minus that in HFPEF. We considered a SMD of 0.2 as a small effect size, a SMD of 0.5 as a medium effect size, and a SMD of 0.8 and higher as a large effect size [9]. Since the SMD is a slightly upwardly bias measurement on small samples, a correction was made using Hedges and Olkin’s technique [10]. For the discrete variable (e.g. gender), we used the odds ratio as the measure of association. Heterogeneity of the studies was explored using Cochrane’s Q test of heterogeneity (P<0.05 considered statistically significant). Inconsistency in the results of the studies was assessed by I² which described the percentage of total variation across studies that is due to heterogeneity rather than chance. When I² ≥ 50%, we assumed that there was more than moderate inconsistency. Random and fixed effects (DerSimonian and Laird and inverse variance methods, respectively) were chosen accordingly.
Additionally, we performed graphical analysis of the normalized mean difference (NMD) of ESVi and EDVi plotted versus the difference EFHC-EFHFPEF. NMD[X] was defined as 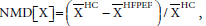 where X=EDVi or ESVi and
  was the mean of X. (In the results section we further elaborate on the selection of the variable NMD[X]). NMD was calculated per primary study. If NMD[X]>0, then X was smaller in HFPEF compared to HC. NMD[X] was calculated and displayed graphically for each primary study included.
The electronic search retrieved 446 titles, which were filtered to 90 abstracts with a potential of having the information sought. Of these, 27 full-text papers were assessed for eligibility, and 8 were included for quantitative analysis. Six full-text studies were added from reference lists and prior work, thus 14 studies were included for quantitative analysis (Figure 1).

Figure 1: Articles identified. PRISMA flow diagram of the studies identified, screened and included in the meta-analysis.
All studies were observational in design comparing a cohort of HFPEF patients with a cohort of healthy subjects of similar age. EF, EDVi and ESVi were the major outcome measures in only 3 of 14 (21%) primary studies. Nine studies (64%) obtained a STROBE score ≥ 20, whereas 5 studies (36%) scored below 20 (3 studies scored 19, 2 studies scored 18). Table 1 shows the main characteristics of the studies included.
The HFPEF and HC groups included 864 and 1028 subjects, respectively (Table 1). Meta-analysis of age showed that the HFPEF group was 3.6 years older than the HC group (Table 2). Gender analysis showed that the odds ratio for being a male in the HFPEF group was 1.16 (95% CI: 0.86-1.57; using a fixed effect model, where tests for heterogeneity were: I2=43.9%, and Q-test: 0.04). BMI was reported in 11 of 14 studies and was significantly higher in the HFPEF group (WMD 3.24 kg, 95% CI: -4.73,-1.76, P<0.0001). Hypertension in the HFPEF group was prevalent from 68 to 100% of studies, whereas in the HC group only one study [14] reported hypertension in 10% of the subjects composing that group. The prevalence of diabetes mellitus was 0 to 55% in the HFPEF group, where in the HC group only one study [13] reported that 1% of the subjects had diabetes (Table 1). Coronary artery disease in the HFPEF group was reported in 6 of 14 studies with prevalence of 10 to 64%. Atrial fibrillation was reported in only 2 studies with prevalence of 8 and 20%. Systolic and diastolic blood pressures were 15 and 1 mmHg higher in the HFPEF group compared to the HC group, respectively (Table 2). A statistically non-significant difference in heart rate was demonstrated between the two groups (Table 2).
| HFPEF | HC | |||||||||||||||||
|---|---|---|---|---|---|---|---|---|---|---|---|---|---|---|---|---|---|---|
| Study | Country | STROBE quality score | N | Age | Female (%) | HTN (%) | DM (%) |
CAD (%) |
AF (%) |
BMI | N | Age | Female (%) | HTN (%) | DM (%) |
CAD (%) |
AF (%) |
BMI |
| Abramov [11] | USA | 18 | 56 | 71 | 30 | 100 | 30 | 64 | 0 | 26 | 75 | 67 | 45 | 0 | 0 | 0 | 0 | 24 |
| Baicu [12] | USA | 19 | 75 | 59 | 55 | NA | NA | NA | 0 | NA | 75 | 59 | 52 | NA | NA | NA | 0 | NA |
| He [13] | China | 19 | 128 | 72 | 35 | 88 | 33 | 63 | 0 | 25 | 93 | 67 | 47 | 0 | 1 | 0 | 0 | 24 |
| Kono [14] | Japan | 20 | 80 | 64 | 39 | 74 | 28 | NA | 0 | 23.5 | 30 | 63 | 50 | 10 | 0 | NA | 0 | 23.6 |
| Maeder [15] | Australia | 18 | 14 | 69 | 36 | NA | 14 | NA | 0 | 29.6 | 8 | 61 | 37 | NA | 0 | NA | 0 | 25 |
| Maurer (5) | USA | 20 | 167 | 76 | 57 | 100 | 30 | 58 | 0 | 27 | 499 | 71 | 57 | 0 | 0 | 0 | 0 | 25 |
| Phan [16] | UK | 20 | 25 | 66 | 64 | 68 | 12 | 16 | 0 | 30 | 15 | 63 | 60 | 0 | 0 | 0 | 0 | 27 |
| Phan [17] | UK | 21 | 40 | 67 | 73 | 73 | 5 | 10 | 0 | 30 | 26 | 64 | 54 | 0 | 0 | 0 | 0 | 26 |
| Plehn [18] | Germany | 21 | 28 | 61 | 64 | 100 | 0 | 0 | 0 | 22 | 11 | 64 | 64 | 0 | 0 | 0 | 0 | 21 |
| Prasad [19] | USA | 22 | 11 | 73 | 55 | 100 | 55 | 0 | 0 | NA | 13 | 70.2 | 54 | 0 | 0 | 0 | 0 | NA |
| Tan [20] | UK | 21 | 50 | 72 | 70 | NA | 30 | 18 | 0 | 31 | 30 | 71 | 73 | NA | 0 | 0 | 0 | 24 |
| Tan [21] | UK | 22 | 67 | 73 | 67 | NA | 24 | NA | 0 | 30 | 38 | 71 | 76 | 0 | 0 | NA | 0 | 24 |
| Vinch [22] | USA | 20 | 61 | 78 | 67 | NA | NA | NA | 20 | 27.3 | 79 | 75 | 49 | NA | NA | NA | 0 | NA |
| Wenzelburger [23] | UK | 19 | 62 | 71 | 66 | NA | 26 | NA | 8 | 30.5 | 36 | 70 | 80 | 0 | 0 | NA | 0 | 24.4 |
Table 1: Clinical characteristics of included studies.
Meta-analysis of the included 14 primary studies showed that EFHFPEF was smaller than EFHC by 1% unit (95% CI: 0.5,1.66; p=0.057) and contrasted our previous finding [1]. EDVi in HFPEF, EDViHFPEF, was smaller than EDVi in HC, EDViHC, by 1.25 ml/m, and ESVi in HFPEF and HC (ESViHFPEF and ESViHC, respectively) were practically equal (Table 2 and Figure 2).

Figure 2: Forest plot showing EDVi, ESVi and EF for all 14 studies.
Since we aimed to investigate changes in LV volumes EDVi, ESVi when EFHFPEF was greater than EFHC, studies were classified into 3 subgroups for further sub-analysis. Group 1 with 2 studies where EFHFEPF > EFHC [15,19], group 2 with 7 studies where the opposite was found [11-14,21-23], and group 3 with 5 studies where EFHFPEF was equal to EFHC [5,16-18,20]. When the studies of groups 1 and 3 (EFHFPEF ≥ EFHC) [5,15- 20] were analyzed EDViHFPEF was smaller than EDViHC by 3.89 ml/m2 (95% CI: -1.65,9.45; p<0.001), and ESViHFPEF was smaller than ESViHC by 1.89 ml/m2 (95%CI: -0.52,4.31; p<0.001; Table 3).
| # studies | Standardized Mean Difference (SMD) | Weighted Mean Difference (WMD) | ||||||||
|---|---|---|---|---|---|---|---|---|---|---|
| Q P-value | I2 | SMD (95%CI) | H0: SMD=0 | Q P-value | I2 | WMD (95%CI) | H0: WMD=0 | |||
| Age | 14 | <0.0001 | 70.90% | -0.33 (-0.53,-0.13) | 0.001 | 0.054 | 41.20% | -3.61 (-4.36,-2.85) | <0.0001 | |
| BMI | 11 | <0.001 | 83.80% | -0.71 (-1.01,-0.42) | <0.0001 | <0.0001 | 89.50% | -3.24 (-4.73,-1.76) | <0.0001 | |
| EDVi (ml/m2) | 14 | <0.0001 | 85.10% | 0.12 (-0.15,0.4) | 0.38 | <0.0001 | 85.10% | 1.25 (-2.14,4.65) | 0.47 | |
| ESVi (ml/m2) | 14 | <0.0001 | 76.10% | -0.02 (-0.24,0.20) | 0.877 | <0.0001 | 79.60% | -0.14 (-1.57, 1.3) | 0.852 | |
| LV EF (%) | 14 | 0.057 | 40.70% | 0.18 (0.04,0.32) | 0.001 | 0.057 | 40.70% | 1.08 (0.5,1.66) | <0.0001 | |
| Systolic BP | 10 | <0.0001 | 87.20% | -0.83 (-1.19,-0.47) | <0.0001 | <0.0001 | 88.20% | -15.38 (-21.71,-9.05) | <0.0001 | |
| Diastolic BP | 10 | 0.001 | 68.10% | -0.11 (-0.3, 0.11) | 0.317 | <0.0001 | 72.60% | -1.13 (-3.59,1.34) | 0.37 | |
| HR | 11 | 0.003 | 63.10% | -0.07 (-0.27,0.14) | 0.536 | 0.007 | 58.80% | -0.77 (-3.13,1.60) | 0.525 | |
Abbreviations as in text; SMD and WMD for variable X are defined as: 
Table 2: Standardized and weighted mean difference for variables in all 14 studies.
Analyzing the 2 studies of group 1 [15,19] showed that EDViHFPEF was smaller than EDViHC by 8.58 ml/m2 (WMD; 95% CI: 1.26,15.9), and ESViHFPEF was smaller than in ESViHC by 5.71 ml/m2 (WMD; 95%CI: 2.62,8.8).
We further analyzed the data of each of the included studies, graphically. The goal was to examine the magnitude and direction of the difference in EDVi and ESVi between the healthy and HFPEF states, relative to the difference EFHC-EFHFPEF. The magnitude of change was quantified by the mean difference (MD) of a variable X defined as:

Where X is EDVi or ESVi, and is the mean of X, per study.
In addition to the magnitude of the difference in X, the direction of change of X relative to the healthy state was evaluated by referring MD[X] to  . Thus, a normalized MD[X], NMD[X], was defined:

NMD[X] was plotted for each of the included studies against the difference EFHC-EFHFPEF (Figure 3).

Figure 3: Normalized mean difference of X (NMD[X]; X=EDVi (squares) or ESVi (diamonds)) as a function of the difference between EFHC and EFHFPEF. Each study is represented by a different color. For each study, NMD[EDVi] (squares) and NMD[ESVi] (diamonds) were plotted versus the difference EFHC – EFHFPEF. Abscissa: EFHC – EFHFPEF; left to the Y-axis EFHFPEF is greater than EFHC. Ordinate: NMD[X]. The unit itself has no physiological meaning; If NMD[X] is positive (that is, above the abscissa), it means that XHC was greater than XHFPEF.
The axes of Figure 3 divide the plane into 4 quadrants. In the two upper quadrants, the NMD [ESVi] and NMD [EDVi] were both positive, that is EDViHFPEF and ESViHFPEF were smaller than EDViHC and ESViHC, respectively. In the 2 lower quadrants NMD [ESVi] and NMD [EDVi] were negative, meaning that EDViHFPEF and ESViHFPEF were greater than EDViHC and ESViHC, respectively. In the 2 quadrants right to the ordinate, EFHC was greater than EFHFPEF, whereas in the 2 quadrants to the left of the ordinate, EFHFPEF>EFHC
Focusing on the upper quadrants, one observes that when EFHFPEF>EFHC (left upper quadrant), both ESViHFPEF and EDViHFPEF were smaller than their HC counterparts. Moreover, the normalized difference between ESViHC and ESViHFPEF (equation 2) was greater than that observed between EDViHC and EDViHFPEF, in other words: NMD [ESVi] was greater than NMD [EDVi] (2 studies) [15,19]. Graphically, „diamonds were on top of squares“ per study. The opposite holds in the.
right upper quadrant – „squares were on top of diamonds“ (2 studies) [12,22]. This means that both ESViHFPEF and EDViHFPEF were smaller than their HC counterparts, yet the normalized difference between ESViHC and ESViHFPEF was smaller than that observed between EDViHC and EDViHFPEF.
There were 3 studies in the upper quadrants where EFHFPEF=EFHC [16-18]. In all three, ESVi and EDVi in HFPEF were smaller than their HC counterparts. In one study the normalized difference between ESViHC and ESViHFPEF was greater than the normalized difference between EDViHC and EDViHFPEF (i.e. NMD [ESVi]>NMD [EDVi]) [16], while in the other 2 studies the opposite was found (NMD [EDVi]>NMD [ESVi]) [17,18].
Five studies were allocated in the right lower quadrant [1,11,13,21,23]. In all, ESViHFPEF and EDViHFPEF were greater than their HC counterparts that are all NMD[X] were negative, „squares on top of diamonds“. Two studies [5,20] in the lower quadrants were allocated on the ordinate. In 1 study, square was on top of the diamond [5] and in the other [20] the opposite.
Fourteen independent studies were allocated to the plane of Figure 3. It is noted that both studies with „diamonds on top“ and „squares on top“ were not distributed homogenously in the plane. In the plane left to the ordinate, diamonds were always on top. Right to the ordinate, squares were always on top.
This study focused on 3 physiologic variables: EDVi, ESVi, and EF, in two groups: HFPEF and HC, both of similar age, at rest. It was hypothesized that when comparing HFPEF patients with HC subjects, unique differences in the values of EDVi and ESVi could be expected relative to the values of EF in each group. It was implicitly assumed that both HFPEF and HC groups originated from a similar healthy state (e.g. before HFPEF patients became ill and before HC individuals aged).
For the 14 primary studies included in the meta-analysis, age and weight characteristics of the HFPEF group were greater than those of the HC group. Such differences were reported in the literature [24-26]. The fact that the HFPEF group had a greater BMI could account for an over-estimation of the decrease in EDViHFPEF. As ESViHFPEF was not significantly different from ESViHC, it was concluded that ESVHFPEF was actually greater than ESVHC, before normalizing ESV by BMI. Another important factor affecting ESVHFPEF, as compared to ESVHC, was the greater mean value of systolic BP in the HFPEF group. As afterload increases, stroke volume decreases and the remaining LV volume, that is ESV, is on average greater [27,28]. The WMD for systolic BP in ref. 1 was: 12.4 mmHg, less than that found in the present study (WMD=15 mmHg). This difference may partially account for the fact that EFHFPEF was found to be less than EFHC in this study. On average the ratio ESV/EDV was greater in HFPEF than it was in HC, a result in agreement with the obtained meta-analytic values of EF. The change in EDVi (decrease) was expected based on HFPEF remodeling, whereas the absence of change in ESVi was not. This may indicate that the remodeling process is variable or dynamic. Since remodeling is a progressive process, it is possible that the primary studies included in this meta-analysis captured their respective HFPEF groups in different phases of remodeling where in some EDVi increased and in others it decreased (also shown be Zile et al. [4]). This study cannot portray the sequence of changes in EDV or ESV in time, yet it suggests a relation between changes in EDVi, ESVi and EF (graphical analysis below). The sub-analysis of studies having an EFHFPEF greater than EFHC showed that both EDVi and ESVi were smaller in HFPEF compared to HC, but on average the decrease in EDVi was greater than that in ESVi. This change was estimated using WMD, to be distinguished from NMD[X]. This sub-analysis provided the first two predictions of the hypothesis, but failed the third one. To conclude, the standard meta-analysis did not support our hypothesis, yet it may point to physiologic processes which are not understood so far
The graphic analysis (Figure 3) aimed to show that EDVi and ESVi in HFPEF differed from their HC counterparts (as expressed by NMD[EDVi] and NMD[ESVi]). NMD[X] is a measure mathematically similar to EF, where the difference between the initial state (HC) and the diseased state (HFPEF) is divided by the healthy initial state. Thus, relating the difference between states to the initial condition. Where WMD and SMD are measures calculated using meta-analysis, NMD[X] was calculated per study. It was predicted that NMD [EDVi] and NMD [ESVi] would obtain different values depending on whether EFHFPEF was greater or smaller than EFHC.
The number of studies in Figure 3 was small (i.e. 14) precluding robust statistical testing of their distribution in the plane. Nevertheless, we claim that studies were distributed in what seems a non-random manner. If no relation existed between the NMD’s and the difference EFHC-EFHFPEF, then it would be expected to find in Figure 3: (1) a similar number of studies with “diamonds on top” and “squares on top”. This was clearly not observed. “Diamonds on top” occurred only when EFHFPEF>EFHC and “squares on top” occurred only when EFHC>EFHFPEF. When EFHC=EFHFPEF both „diamonds on top“ and „squares on top“ were observed. (2) a similar number of studies above and below the abscissa, indicating independent changes of LV volumes (i.e. NMD [X]’s) relative to the difference EFHC-EFHFPEF. This was also not observed as the left lower quadrant remained empty, not occupied by any study. If one accepts that these findings attest to a relation between NMD [X]’s and the difference EFHC-EFHFPEF, then a clue is provided in favor of the hypothesis presented above.
Results presented here are based on 14 primary studies, where in 2 studies EFHC<EFHFPEF, in 5 studies EFHC=EFHFPEF, and in 7 studies EFHC>EFHFPEF, and on average EFHC was greater than EFHFPEF. It is possible that these results underestimate the effect due to the small number of studies with EFHC<EFHFPEF (in ref.1 six studies reported EFHC<EFHFPEF).
In terms of remodeling - the 2 studies allocated to the left upper quadrant of figure 3 showed findings consistent with concentric LV hypertrophy. EDViHFPEF < EDViHC, ESViHFPEF < ESViHC, and the extent to which ESVi decreased was greater than that of EDVi (NMD [ESVi]>NMD [EDVi]). In terms of remodeling, the studies in the right lower quadrant of Figure 3 showed findings consistent with eccentric LV hypertrophy, where the LV dilated in the HFPEF state: EDViHFPEF>EDViHC and ESViHFPEF>ESViHC. The studies in the right upper quadrant of Figure 3 showed findings consistent with a “mixed” type of remodeling. Both EDVi and ESVi decreased in size (HFPEF compared to HC), but EDVi decreased to a greater extent than ESVi. Perhaps with further progression of HFPEF, the process of LV concentric hypertrophy will further impinge on LV cavity, and the decrease in ESVi would surpass that of EDVi. This study does not provide evidence in favor of this speculation.
When comparing HFPEF and HC groups, Figure 3 provides a graphic means for combining the differences in EF with the differences in LV volumes, suggesting a remodeling process. Studies allocated to the left upper quadrant demonstrate structural LV changes consistent with concentric hypertrophy, whereas studies allocated to the right lower quadrant demonstrate changes consistent with eccentric hypertrophy. Studies allocated to the right upper quadrant and those on the ordinate are considered a “mixed” pattern of remodeling. It should be stressed that our findings are based on a small data set, and the suggested relation between the differences in LV volumes (between HC and HFPEF) and a pattern of cardiac remodeling should therefore be considered with caution.
In their review, Bhuiyan et al. stated that a standard definition of HFPEF is lacking and recruiting patients with preserved EF (EF between 40 and 55%) may cause both patterns of remodeling to be included [29]. In the 2013 ACCF/AHA Guideline for the Management of Heart Failure 3 components for defining HFPEF were suggested: a) clinical signs or symptoms of HF; b) evidence of preserved or normal LVEF; and c) evidence of abnormal LV diastolic dysfunction that can be determined by Doppler echocardiography or cardiac catheterization. In our study we used the first 2 components, as the third component is not uniformly defined. We set the inclusion criterion for primary studies on EF ≥ 50%, trying to exclude heart failure patients with reduced ejection fraction.
Since EF ≥ 50% was common to all studies, the values of EDV and ESV in HFPEF may be relevant when considering therapy. Perhaps, HFPEF patients diagnosed with EF ≥ 50% accompanied by specific changes in EDV and ESV suggestive of eccentric hypertrophy can benefit from medications proven effective in heart failure and reduced ejection fraction.
An implicit assumption was laid in this study where both HFPEF and HC subjects shared similar values of EDVi and ESVi before becoming patients or before aging, respectively. Moreover, EDVi and ESVi values were sampled only once for the subjects of both groups and we don’t know the course of change of these values. It is also acknowledged that the data gathered in this work, though systematically performed according to meta-analysis rules, represent second hand patient data and research approaches in the primary studies may vary.
Only 14 studies were included in the analysis limiting our ability to use robust statistical testing to show that the distribution of the studies in figure 3 was non-random.
In this study we found 8 more studies that complied with the inclusion criteria of our previous study [1]. We could not find an explanation for this except for the different investigators performing the search. Due to this gap, we analyzed all 36 studies together (28 studies from reference [1], and the 8 new studies from the present study) and demonstrated that EFHFPEF remained greater than EFHC, with the summary measure SMD=0.47 (95% CI: 0.18, 0.77; p<0.001; forest plot not shown; in ref. 1 SMD was 0.71 (95% CI: 0., 1.1, p<0.001)). Although SMD for all 36 studied was smaller than in [1] statistical significance was obtained.
Comparing the values of EDVi, ESVi and EF in HFPEF with those in HC using meta-analysis did not provide an explanation for the finding that EFHFPEF is on average greater than EFHC. However, the graphic descriptive tool suggested that different LV remodeling processes operate when EFHFPEF is greater or smaller than EFHC. More studies are required to validate these observations.