Journal of Tourism & Hospitality
Open Access
ISSN: 2167-0269
ISSN: 2167-0269
Research Article - (2021)
What we know as customer experience has changed in recent decades and will continue to transform the way customers relate to brands. Evolving from unidirectional, product-based communication models to bidirectional models, where the customer becomes the center of any brand's strategy. Factors such as information processing and storage capacity, as well as the use of the Internet and mobile technologies have contributed to this process. This process is what has come to be known as the Fourth Industrial Revolution.
More and more data are becoming available, and in any operational process in any industry, this data needs to be transformed into information with the main objective of being able to make appropriate decisions in real time. This is where Artificial Intelligence (AI) and Machine Learning (ML) models come into play.
Regarding the customer relationship, in the literature we find valuation models based on parameters such as Recency, Frequency and Monetary values (RFM). This model is very useful in customer segmentation processes in marketing campaigns. Another important use of the RFM model is based on the measurement of Customer Lifetime Value (CLV) enriched and extended by Kumar with the value of the customer in its ability to recommend, influence and contribute knowledge to the brand in what has been called Customer Engagement Value (CEV).
That is why after a thorough review of the related literature, we find it useful to value the customer from another point of view, their relationship with the Contact Center, we propose a model based on parameters such as Recency, Frequency, Importance and Duration (RFID) of customer interactions with the Contact Center over a period, and to develop a personalized recommendation strategy or by customer segments.
2-tuple fuzzy linguistic modeling; Customer centric; Multi-criteria decision-making; RFM; Customer value; RFID
A crucial aspect of this customer-centric philosophy is to consider that we as consumers, patients, citizens, in short, as people, want to be served in a personalized, consistent and coherent way through any communication channel, this is what we mean by Omnichannel communication [1]. The brand builds its communication strategy on customer segments through the Customer Journey [2], defining the GAPs that exist between what the customer expects and what the brand provides. For the strategy to work coherently, it is important that all the company's systems are connected, that is, the company that interacts with the customer has a unified data management, all systems must be connected. This is where technology and Customer Relationship Management (CRM) systems come into play [3]. Therefore, a crucial aspect for any Customer Centric strategy is the correct implementation of customer service processes integrated in the CRM and implemented by the Contact Center [4,5].
RFM-based models introducing by Hughes [6], are designed to classify the customer according to their behavior during the purchase process [7], also provide what is called Customer Lifetime Value (CLV) [8,9], but they do not consider the interactions that occur with the customer after the process [10], in many cases, the evaluation of the interactions between customer and brand after the sale are as or more important than the interaction produced in the sale itself, it tends to generate brand loyalty.
Customer satisfaction is one of the main metrics used by marketing, studies related to service quality consider the following dimensions as fundamental in the customer-brand relationship process: reliability, empathy, customer knowledge, customer orientation, waiting time, ease of use and accessibility [11]. One of the most widely used metrics in the evaluation of this service quality model is the Net Promote Score (NPS) [12], it is supported by the idea of the recommendation of the purchased product. However, this metric is unidirectional; it is based on the customer's perception of the brand's services. The novelty of the RFID model lies in analyzing the value of the customer from the point of view of the Contact Center, thus achieving a 360° vision between customer and brand, complementing the traditional models of customer service evaluation (NPS).
The RFID model is based on four parameters that have a direct impact on the quality of service and are present in the data model of any CRM, these parameters are: R=Recency, when was the last time the customer opened a case; F=Frequency, how often the customer interacts with the contact center; I=Importance, what is the importance of the interactions with the customer; and D=Duration, how long it took to resolve issues.
It is important to measure the customer's interaction with the brand, so that we can adopt customer relationship strategies in their next interaction with the contact center and in general with the brand.
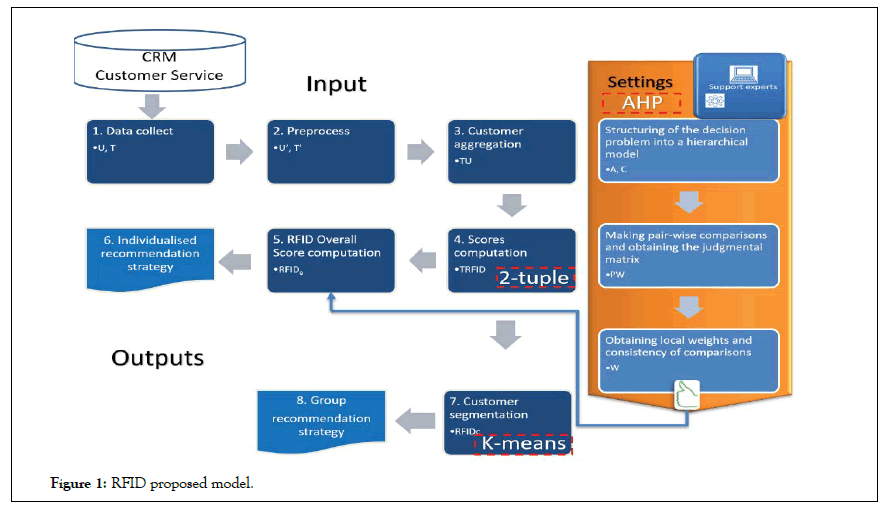
The methodology we have used is based on the following models (see Figure 1):
• Analytic Hierarchy Process (AHP) [13], used to obtain the weight of each of the variables described above (RFID).
• 2-tuple [14], whose objective is to improve the information loss problems present in computational processes with linguistic labels.
• RFM [15], whose objective is to help obtain the global score of each client.
• K-means [16], which will help us to segment the customers and thus design the action/recommendation plan.
The following is a description of the phases that make up the methodology shown in Figure 1, the information we have worked with in this model corresponds to a company in the telecommunications sector; the CRM used is Salesforce.

Figure 1: RFID proposed model.
Data collect
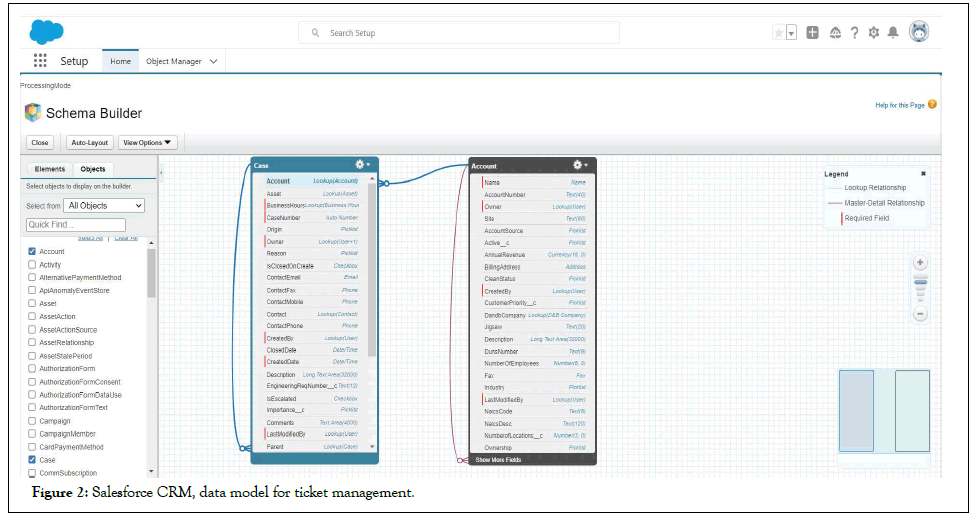
Case information is managed by the company through a corporate CRM tool. The CRM tables contain the information related to a case, as shown in the following Figure 2,

Figure 2: Salesforce CRM, data model for ticket management.
Preprocess
The recency and frequency are determined by the period in which we do our analysis, we extract from the CRM a sample with the following information Table 1,
| u | Ticket id | Ticket date | Status id | Status date | Ticket importance |
|---|---|---|---|---|---|
| 21046586 | 155395585 | 25-Jan-16 | Closed | 02-Apr-19 | M |
| 21046586 | 155402659 | 25-Jan-16 | Closed | 02-Apr-19 | VL |
| 21046586 | 155418120 | 25-Jan-16 | Closed | 04-Apr-19 | VL |
| 21046586 | 155520776 | 25-Jan-16 | Closed | 04-Apr-19 | VL |
| 21046586 | 155887861 | 25-Jan-16 | Closed | 08-Apr-19 | VL |
| 21046586 | 156171484 | 25-Jan-16 | Closed | 13-Apr-19 | VH |
| 21334657 | 156206850 | 12-Apr-16 | Closed | 13-Apr-19 | L |
| 21334657 | 156548471 | 12-Apr-16 | Closed | 19-Apr-19 | L |
| 21334657 | 156750555 | 12-Apr-16 | Closed | 25-Apr-19 | VH |
| 2288774 | 155508450 | 12-Sep-15 | Closed | 04-Apr-19 | M |
| 24583147 | 155628991 | 18-Oct-18 | Closed | 06-Apr-19 | VL |
| 25860618 | 155670320 | 28-Mar-19 | Closed | 06-Apr-19 | VL |
| 25860618 | 156085093 | 28-Mar-19 | Closed | 12-Apr-19 | M |
| 25860618 | 156086410 | 28-Mar-19 | Working | 12-Apr-19 | M |
| 25860618 | 156345579 | 28-Mar-19 | Closed | 15-Apr-19 | VH |
| 25860618 | 156345680 | 28-Mar-19 | Working | 15-Apr-19 | L |
| 25864456 | 155401447 | 29-Mar-19 | Closed | 02-Apr-19 | VH |
| 25864456 | 155420645 | 29-Mar-19 | Closed | 04-Apr-19 | VH |
| 26053204 | 157048831 | 27-Apr-19 | Closed | 28-Apr-19 | VL |
| 26064419 | 157149871 | 29-Apr-19 | Closed | 29-Apr-19 | L |
| 26064419 | 157214640 | 29-Apr-19 | Closed | 29-Apr-19 | VL |
| 26064419 | 157215347 | 29-Apr-19 | Closed | 29-Apr-19 | M |
Table 1: Sociodemographic characteristics of the sample.
Aggregation
We then grouped and obtained the recency, frequency, importance, and duration values for each customer in the sample period considered Table 2,
| u | R | F | I | D |
|---|---|---|---|---|
| 21046586 | 17 | 6 | L | 6999 |
| 21334657 | 5 | 3 | M | 3306 |
| 2288774 | 26 | 1 | M | 1300 |
| 24583147 | 24 | 1 | VL | 170 |
| 25860618 | 15 | 5 | (M,-0.05) | 75 |
| 25864456 | 26 | 2 | VH | 10 |
| 26053204 | 2 | 1 | VL | 1 |
| 26064419 | 1 | 3 | L | 0 |
Table 2: Extract of TU.
Scores computation
Next, we group the set of values obtained in the previous step into a 2-tuple domain (Figure 3 and Table 3)
Figure 3: Definition of the set S(Score comutation).
| u | R | F | I | D |
|---|---|---|---|---|
| 21046586 | (M, -0.087) | (VH, -0.035) | L | (VH, -0.002) |
| 21334657 | (H, -0.026) | (H, 0.008) | M | (VH, -0.024) |
| 2288774 | (VL, 0.085) | VL | M | (VH, -0.12) |
| 24583147 | (L, -0.086) | VL | VL | (L, 0.12) |
| 25860618 | (M, -0.003) | (VH, -0.065) | (M, -0.05) | (L, -0.009) |
| 25864456 | (VL, 0.085) | (M, 0.01) | VH | (VL, 0.098) |
| 26053204 | (VH, -0.097) | VL | VL | (VL, 0.038) |
| 26064419 | (VH, -0.025) | (H, 0.008) | L | VL |
Table 3: Extract of TRFID.
AHP
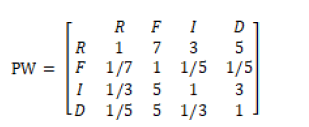
Next, using the AHP methodology, we establish the importance of each of the characteristics of the model and obtain the weights,And in this way, we obtain the overall value for each customer Table 4,From this point on, we can apply an individual strategy to each customer, or apply clustering techniques to obtain strategies by customer segment.

| u | RFID |
|---|---|
| 21046586 | (M, 0.062) |
| 21334657 | (H, -0.035) |
| 2288774 | (L, -0.092) |
| 24583147 | (VL, 0.109) |
| 25860618 | (M, 0.092) |
| 25864456 | (L, 0.07) |
| 26053204 | (M, 0.004) |
| 26064419 | (H, 0.022) |
Table 4: RFID overall score for some customers.
RFID overall score computation
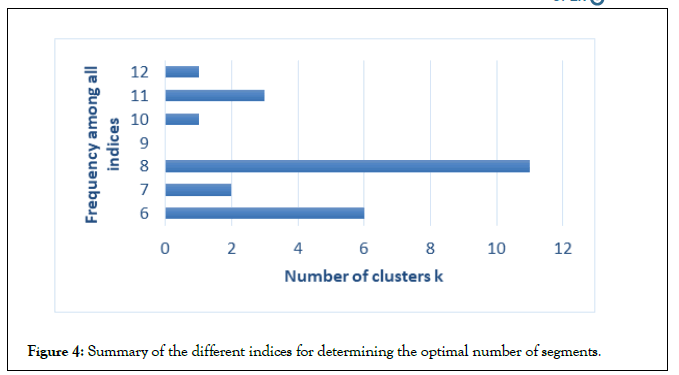
Next, using k-means, we will obtain a classification of customers, which will allow us to carry out a group recommendation strategy, but first we will obtain the number of optimal clusters using different indicators Figure 4, and we see the result of k-means with 8 clusters Table 5,
| Cluster c | Rvc1 | Fvc2 | Ivc3 | Dvc4 | Number of customers |
|---|---|---|---|---|---|
| 1 | 0.3468286 | 0.004483071 | 0.64094575 | 0.3294273 | 682 |
| 2 | 0.802829 | 0.728453895 | 0.23999396 | 0.82394 | 1059 |
| 3 | 0.3025948 | 0 | 0.14033457 | 0.6893585 | 807 |
| 4 | 0.3091454 | 0.622837611 | 0.27908176 | 0.2508257 | 645 |
| 5 | 0.3238762 | 0.636744215 | 0.27405076 | 0.7974674 | 892 |
| 6 | 0.2976317 | 0 | 0.09399773 | 0.2478526 | 883 |
| 7 | 0.8238419 | 0 | 0.17406221 | 0.4135224 | 1093 |
| 8 | 0.7944105 | 0.683038143 | 0.26883786 | 0.257423 | 728 |
Table 5: Result of the k-means algorithm.

Figure 4: Summary of the different indices for determining the optimal number of segments.
Group recommendation strategy
We can then establish the most appropriate recommendation strategy for each cluster, based on two parameters, future interactions, and campaigns.
Cluster 1: Self custom
Description: A priori these are not very problematic customers, they do not have recurrent or frequent incidents, but the incidents they have had are of some importance.
Future interactions: In subsequent customer interactions with the contact centre, the use of bot (faqs, chat, voice) is recommended, and if personalisation is required because the customer demands it, an automatic channel could be changed to a personalised and even specialised one.
Campaigns: It is proposed for this type of customer to reward brand loyalty with discount campaigns for permanence.
Cluster 2: Strong custom
Description: Customer considered at high risk of abandonment.
Future interactions: In future customer interactions with the contact centre, it is recommended to personalise communication through specialised agents.
Campaigns: Campaigns are proposed that tend to raise the customer’s perception of the service and the brand. We recommend listening to the customer, acquiring in-depth knowledge of them, and based on this, proposing discounts, offers and promotions.
Cluster 3: Self custom
Description: A priori these are not very problematic customers, they do not have recurrent or frequent incidents, but the incidents they have had are of medium to long duration.
Future interactions: In subsequent customer interactions with the contact centre, it is recommended to use bot (faqs, chat, voice), if customisation is required because the customer demands it, it could move from an automatic channel to a customised and even specialised one.
Campaigns: It is proposed for this type of customer to reward brand loyalty with discount campaigns for permanence.
Cluster 4: Custom
Description: A priori, these are customers who have had frequent incidents and, in the past, possibly problems related to the implementation of the service.
Future interactions: In future customer interactions with the contact centre, it is recommended to personalise communication through generalist and, if necessary, specialised agents.
Campaigns: Campaigns aimed at strengthening and rewarding customer loyalty, discounts for permanence, etc., are proposed.
Cluster 5: Custom
Description: A priori, these are customers who have had frequent incidents in the past, possibly problems derived from the installation, which produced long-lasting incidents.
Future interactions: In subsequent customer interactions with the contact centre, it is recommended to personalise communication through generalist and, if necessary, specialised agents.
Campaigns: We propose campaigns aimed at strengthening and rewarding customer loyalty, as well as raising the brand image, listening to the customer, and generating valuable content.
Cluster 6: Self
Description: A priori these are customers with infrequent incidents in the past, and without much relevance.
Future interactions: In future customer interactions with the contact centre it is recommended to use bot (faqs, chat, voice), excessive personalisation is not required, and auto response will be sought in the interaction with the customer.
Campaigns: This type of customer could be an excellent brand ambassador, campaigns are proposed that reward their interaction and participation in social networks, in addition to strengthening customer loyalty with discounts associated with permanence.
Cluster 7: Self custom
Description: Although incidents are not frequent, there is a recency in them, however, the importance and duration are low, they are customers with a low abandonment rate.
Future interactions: In future customer interactions with the contact centre it is recommended to use bot (faqs, chat, voice), if personalisation is required because the customer demands it, it could move from an automatic channel to a personalised and even specialised one.
Campaigns: Campaigns aimed at strengthening the brand image are proposed, if the customer has been with the brand for some time, complementary strategies that reward loyalty are proposed.
Cluster 8: Custom
Description: Frequent and repeated incidents, but without importance. The customer typology may correspond to customers seeking excellence in the brand’s services.
Future interactions: In subsequent customer interactions with the contact centre, it is recommended to personalise communication through generalist and, if necessary, specialised agents.
Campaigns: Aimed at promoting trust among customers, creating messages of value that can help the customer and understand what the brand does for their benefit.
It is advisable to add the model presented to other models presented in this document. For example, it could be applied to consolidated Customer Engagement Value (CEV) valuation models, thus obtaining an aggregate computation of customer valuation from different points of the customer's relationship with the brand. AHP could also be applied as a method for determining the weights of each of the characteristics of the final valuation model.
The example we have considered has to do with the telecom industry, we see highly recommendable its application to any other scenario (customer, patient, citizen) and incorporate artificial intelligence algorithms to generate personalization in the communications between customer and brand. Finally, the model can help consolidate customer information generated by the NPS.
Citation: Díaz GM (2021) Managing Customers from the Perspective of Contact Centre. J Tourism Hospit. S6:001.
Received: 06-Dec-2021 Accepted: 20-Dec-2021 Published: 27-Dec-2021
Copyright: © 2021 Díaz GM. This is an open-access article distributed under the terms of the Creative Commons Attribution License, which permits unrestricted use, distribution, and reproduction in any medium, provided the original author and source are credited.