Forest Research: Open Access
Open Access
ISSN: 2168-9776
+44 1300 500008
ISSN: 2168-9776
+44 1300 500008
Research - (2024)Volume 13, Issue 1
Land use and land cover is dynamic process to understand the anthropogenic activity impact on land and other environment attribute that leads to other problems and land use change are important for identifying vulnerable areas for change and cause a problem in the ecosystem services. This study analyzed the status of LULC changes and key drivers of change for the last 20 years through a combination of remote sensing and Geographic Information System (GIS) approach, understanding of LULC patterns and drivers in the Tawa river basin. Five major LULC types (Forest cover, Agriculture, Water body, Range land and Settlement) from Landsat images of 1999, 2009, and 2019 were mapped. The results demonstrated that Agriculture and Forest constituted the most extensive type of LULC in the study area and increased by 25.6% extent. It also revealed that a substantial expansion of range land areas during the past 20 years. On the other hand, LULC classes that has high environmental importance such as grazing land and forest cover have reduced drastically through time with expanding cultivated and settlement during the same period. The Range land in 1999-2009 was about 6.8% of the total study area, and it had decreased to 5.7% in 2019. In contrast, cultivated and settlement increased from 7.8% in 1999 to 8.5% in 2019. While forest cover declined from 1999 to 2019 in the same period. The main causes for LULC changes in this particular area include population growth, land tenure insecurity, and common property rights, persistent poverty, climate change, and lack of public awareness. Therefore, the causes for LULC changes have to be controlled, and sustainable resources use is essential; else, these scarce natural resource bases will soon be lost and will no longer be able to play their contribution in sustainable ecosystem services.
Land Use and Land Cover (LULC); Human activity; Spatial analysis; Environment
The dynamic and intricate properties of the Earth’s surface known as Land Use and Land Cover (LULC) have undergone considerable changes as a result of numerous natural and anthropogenic processes. Understanding how human activities affect the environment and managing natural resources effectively depend on the study of LULC. With the creation of sophisticated geospatial tools and remote sensing methods over the last few decades, LULC research has improved significantly. The influence of LULC change detection on the environment has been the subject of numerous research. A research by Lambin, et al., used satellite data and historical records to look at the changes in land use and cover around the world from 1700 to 1990 [1]. In contrast to forests and grasslands, they noted a notable growth in agricultural and urban areas. Similarly, according to a study by Liu, et al., farmland and urban areas have grown while grasslands and woods have shrunk in China between 1990 and 2005 [2]. The management and planning of land use is another topic of LULC research. Numerous studies have been conducted to determine the best locations for forestry operations, urban development, and other land uses. In a previous study appropriate locations for sugarcane growing in Bangladesh were found using remote sensing and GIS techniques. They discovered that 23% of the entire land is suitable for growing sugarcane. Similarly, Geospatial methods were used in a study by Pradhan, et al., to locate optimal locations for forest plantations in Nepal [3,4]. About 10% of the overall area, according to their report, is suitable for forest plantations. In general, the literature on LULC has greatly advanced our knowledge of how the Earth’s surface evolves and has given us important information for managing and planning sustainable land use. According to the physical, biological, and human activities that affect it, the Earth’s surface is categorised and described as Land Use Land Cover (LULC). According to Kafi, et al., the LULC map is crucial for a number of applications, including land use planning, environmental evaluation, and management of natural resources [5]. The classification is often carried out by visual interpretation, digital image processing, or a combination of both, and is based on remote sensing data such as satellite photography. According to the distinct characteristics of the area being examined, LULC categorization systems are created [6]. Globally, numerous classification systems have been created for distinct locations, which makes it easier to compare how land is used in other regions. According to Thenkabail, et al., the LULC categorization system is often developed using data from remote sensing satellites like Landsat, Sentinel, and MODIS as well as other sources like field observations, aerial photography, and maps [7]. Images are categorised during the process based on their spectral characteristics, which include wavelengths in the visible, near-infrared, and shortwave-infrared ranges. The many LULC categories, including vegetation, water bodies, urban areas, arid land, and others, are used as the basis for the classification. The Anderson Land Use Land Cover Classification System, which comprises five levels of classification, is one of the most widely used classification schemes. According to Twisa and Buchroithner, the first level is based on the general characteristics of the Earth’s surface, such as the presence or lack of flora, water, or metropolitan centers [8]. The presence of a certain type of plant, body of water, or urban area determines the second level. The fourth level is dependent on the size of the urban area, whereas the third level is based on the vegetation’s stage of growth or development [9]. Depending on the specific land use activity, such as farming, forestry, or mining, the fifth level is determined. With the development of processing power and remote sensing technology, LULC classification has changed over time. For instance, large-scale LULC maps can be accurately classified using machine learning methods like random forests, support vector machines, and neural networks. When compared to conventional classification approaches, it has been demonstrated that these methods offer high classification accuracy. Additionally, to enhance LULC categorization, subsequent studies have included temporal data, such as time-series satellite photography. This method gives insight into the dynamics of land use and enables for the detection of changes in LULC over time. In conclusion, LULC classification is crucial for many applications, and the choice of classification scheme depends on the particulars of the area under study. The effectiveness and accuracy of LULC categorization have increased thanks to the application of remote sensing data and machine learning algorithms [10]. Land use planning, natural resource management, and environmental evaluation can all benefit from the correct and timely classification of LULC maps.
Description of the study area
Tawa river basin is situated in central India, covering parts of Madhya Pradesh and Maharashtra states. The Tawa River, a tributary of the Narmada River, originates in the Satpura range and flows through the Tawa Reservoir before joining the Narmada River. The Tawa river basin is spread across an area of 10,342 km², with a population of around 0.7 million people [11]. The area is predominantly rural, with agriculture as the primary source of livelihood. The Tawa Reservoir is a significant water source for irrigation, drinking water supply, and hydropower generation in the region. The basin is also home to a diverse range of flora and fauna, including some rare and endangered species. Geology and Climate and The Tawa river basin is situated in the central part of the Indian Peninsula, which is characterized by diverse geological formations [12]. The basin is predominantly underlain by sedimentary rocks of the Vindhyan and Deccan Plateau formations. The Vindhyan formation consists of sandstone, shale, and limestone, while the Deccan Plateau formation consists of basaltic lava flows and associated sediments. The basin’s geology plays a crucial role in controlling the groundwater and surface water availability in the region. The Tawa river basin’s climate is primarily tropical, with distinct wet and dry seasons. The monsoon season lasts from June to September, accounting for nearly 80% of the annual rainfall. The average annual rainfall in the basin ranges from 1000 to 1500 mm. The temperature in the region varies from a minimum of 5°C in winter to a maximum of 45°C in summer. Land Use and Land Cover of Tawa river basin’s Land Use and Land Cover (LULC) pattern have undergone significant changes over the past few decades due to human activities [13]. The basin’s LULC is predominantly agricultural, with around 80% of the area under cultivation. The main crops grown in the basin are paddy, wheat, maize, soybean, and pulses. Forests cover around 10% of the basin area, and the remaining land is under non-agricultural uses such as urban settlements, pasturelands, and water bodies. The Tawa river basin faces various challenges, including water scarcity, soil erosion, land degradation, and declining groundwater levels. The basin’s water resources are under tremendous pressure due to increasing demand for irrigation, domestic, and industrial uses. Climate change and variability have further exacerbated the situation, leading to frequent droughts and floods in the region and leading to other environmental problems face by human and ecosystem. The uncontrolled use of groundwater resources has resulted in declining groundwater levels, which is a significant concern for the region’s sustainability and mitigating the decline of ground water in future (Figure 1).
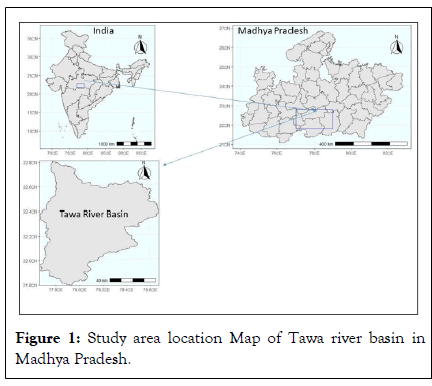
Figure 1: Study area location Map of Tawa river basin in Madhya Pradesh.
Land use/land cover classification scheme and data sources
In this study, multi-temporal Landsat satellite images of the study area were freely downloaded from the USGS’ Earth Explorer portal for three study periods: Landsat 5 TM 1999, and Landsat 7 ETM+2009 and Landsat 8 OLI 2019, Except the thermal infrared, all the visible and infrared spectral bands were included in the image classification (Table 1).
| LULC type | Brief description |
|---|---|
| FRSD | This refers to areas covered by trees forming closed or nearly closed canopies which include patches of natural forest. |
| AGRL | Includes areas allotted to crop cultivation, mostly of cereals in subsistence farming and agriculture. |
| WATR | This area refer to river and water bodies within basin. |
| RANGE | This class refers to an area covered with grass that is used for grazing, usually communal. |
| URLD | Residential low density and scattered rural settlements. |
Table 1: LULC Classification Scheme/Description of LULC types in the study area.
Remote sensing data processing and classification
The field of remote sensing, which involves gathering data about an object or area without coming into direct physical touch with it, depends on the processing of remote sensing data and the classification of images. While image classification classifies the information gained from the processed data into multiple land cover or land use categories, remote sensing data processing entails extracting information from remotely sensed data using a variety of digital image processing techniques. Satellite imagery, which is recorded by sensors on board satellites circling the planet, is one of the main sources of remotely sensed data [14]. These sensors gather information at distinct wavelengths that can be used to distinguish between various objects or types of terrain. However, processing is necessary before any analysis can be done on the raw data that these sensors provide. Image enhancement, geometric correction, and radiometric calibration are a few of the processes that go into processing remote sensing data. Radiometric calibration entails transforming the sensor’s raw data into physically significant units, such as reflectance values. Geometric correction entails the removal of picture distortions brought on by the sensor or the earth’s surface, such as topography relief, atmospheric effects, and sensor orientation [15]. By altering an image’s brightness, contrast, and colour balance, one can increase the visual quality of the image. Image classification is the next process after the remote sensing data has been processed. The process of classifying a picture entails separating it into several land use or cover groups according to the spectral characteristics of the individual pixels. Automated algorithms can be used in this study to complete the process. Image pre-processing eliminates noise, fixes distortions, and improves the data readability of an image. Before start the classification of the satellite data, pre-processing of the images, such as atmospheric and geometric corrections, right band selection, sub-setting, layer stacking, and image enhancements (such as histogram equalization and focal analysis), were applied in this study. Atmospheric correction of the Top of Atmosphere (TOA) reflectance to surface reflectance is required in order to carry out the LULC changes detection. In order to obtain surface reflectance data, Landsat data were consequently atmospherically corrected using the FLASH approach in the ENVI software tools. In order to combine time series image data sets for change detection at the pixel level, L5 TM and Land sat 7 ETM + photos were matched to their matching Landsat 8 OLI images using automated image-to-image registration methods based on a set of Ground Control Points (GCPs). A Landsat 7 ETM + image was improved using focal analysis, a spatial improvement technique.
The pictures were georeferenced (Universal Transverse Mercator- UTM, WGS84) by the data set supplier [16]. The land-sat data from each research year were then individually categorised using the unsupervised classification technique and recoding, using ground truth data on existing LULC. The ERDAS Imagine 2014 programme was used to classify the LULC classes using the Maximum Likelihood Classifier (MLC) method. However, categorization mistakes in the area estimates may occur due to the employed satellite image’s spectral and geographical resolution. As a result, evaluating the classification’s accuracy is essential to determining how reliable the information that may be derived from it will be. The accuracy of the categorization findings was therefore evaluated using the validation data [17]. Last but not least, a comparison of the LULC maps from 1999 to 2009 and 2009 to 2019 was done utilising the postclassification comparison employing individually categorised Landsat images (Figure 2).
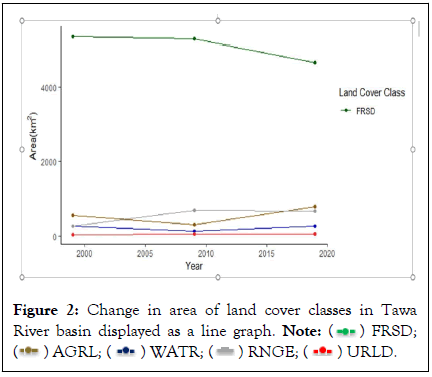
Figure 2: Change in area of land cover classes in Tawa
River basin displayed as a line graph.
Note: ( ) FRSD; (
 ) AGRL; (
 ) WATR; (
 ) RNGE; (
 ) URLD.
Analysis of LULC classes area
In 2019, the land use composition in the area consisted of several categories. The largest land use category was Forest (FRSD), covering an area of 4649.149235 Km2. This category represented 72.02% of the total area. The second-largest land use category was Agricultural Land (AGRL), encompassing 789.323133 Km2 accounting for 12.23% of the total area. This category indicates the presence of agricultural activities in the form of crop cultivation or farming. Water bodies, denoted as Water (WATR), covered an area of 276.556229 Km2, making up 4.28% of the total area. This category includes lakes, rivers, reservoirs, and other water features. Range land (RNGE) represented 10.55% of the total area, with an extent of 681.221383 Km2. This category signifies areas covered by grasses, which are often used for livestock grazing or as open spaces. The Residential-Low Density (URLD) category accounted for 0.92% of the total area, occupying 59.086419 Km2. This category refers to areas primarily designated for low-density residential development.
In 2009, the land use distribution in the area was characterized by several different categories. The largest land use category was Forest (FRSD), covering an area of 5258.09589 Km2 constituting 81.45% of the total area. This indicates a significant presence of forests in the region during that period. Agricultural Land (AGRL) accounted for a smaller portion of the area, encompassing 314.46891 Km2, which equated to 4.87% of the total area. This suggests that a relatively small portion of the land was utilized for agriculture in a generic sense. Water (WATR) represented another significant land use category, comprising 136.450642 Km2 which accounted for 2.11% of the total area.
This indicates the presence of water bodies such as lakes, rivers, or reservoirs within the region. Range-Grasses (RNGE) covered a substantial area of 696.688388 Km2, representing 10.79% of the total area. This suggests the existence of grasslands or rangelands in the region. Residential-Low Density (URLD) was the smallest land use category, encompassing 49.63077 Km2 constituting 0.77% of the total area. This indicates a relatively minor presence of low-density residential areas within the region during that time. In 1999, the land use distribution in the area was as follows: The largest land use category was Forest (FRSD), covering an area of 5333.987903 Km2. This accounted for 82.63% of the total area. The presence of deciduous forests indicates a significant natural ecosystem within the region. Water bodies (WATR) occupied an area of 257.45 Km2, constituting 3.99% of the total area. These water resources could include rivers, lakes, ponds, or reservoirs, which play a vital role in supporting aquatic life and providing water for various purposes. Agricultural Land (AGRL) covered an area of 552.747005 Km2, representing 8.56% of the total area.
This category likely includes cultivated fields, farmland, and other agricultural practices, indicating a significant agricultural presence in the region. Range Land (RNGE) encompassed an area of 269.227464 Km2, accounting for 4.17% of the total area. This category likely represents grasslands or grazing areas, which could support livestock and provide habitat for various wildlife species. Residential-Low Density (URLD) occupied a smaller area of 41.922228 Km2, constituting 0.65% of the total area.
This category suggests the presence of low-density residential areas, indicating human settlement within the region [18]. Overall, the land use composition in LULC reflected a combination of natural ecosystems, agricultural activities, water bodies, and human settlements [19]. The dominant land use type was forests, followed by agricultural land and water bodies. These land use categories provide insights into the diverse landscapes and human activities within the area during that time (Figures 3-6) (Table 2).
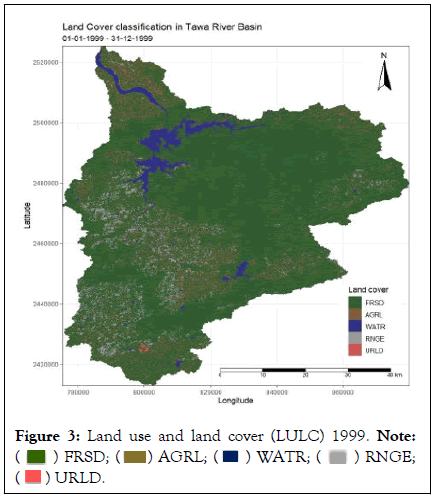
Figure 3: Land use and land cover (LULC) 1999.
Note: ( ) FRSD; (
 ) AGRL; (
 ) WATR; (
 ) RNGE;
(
 ) URLD.
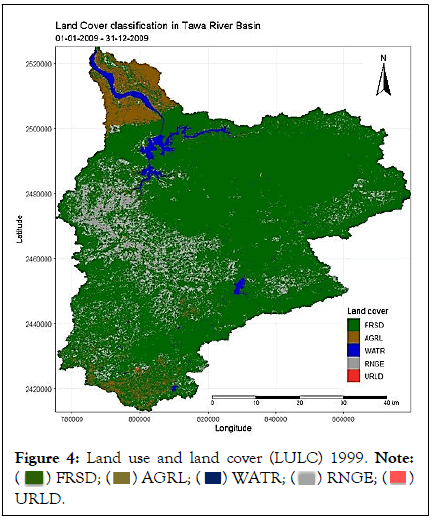
Figure 4: Land use and land cover (LULC) 1999.
Note: ( ) FRSD; (
 ) AGRL; (
 ) WATR; (
 ) RNGE;
(
 ) URLD.
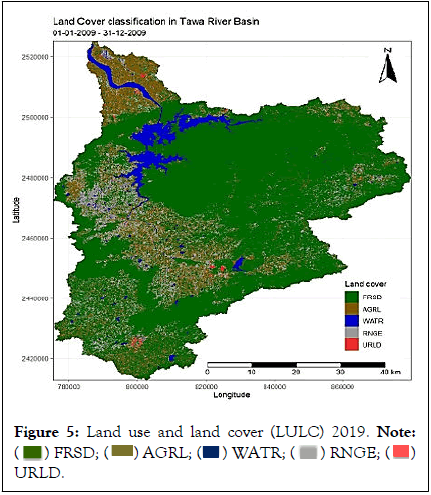
Figure 5: Land use and land cover (LULC) 2019.
Note: ( ) FRSD; (
 ) AGRL; (
 ) WATR; (
 ) RNGE;
(
 ) URLD.
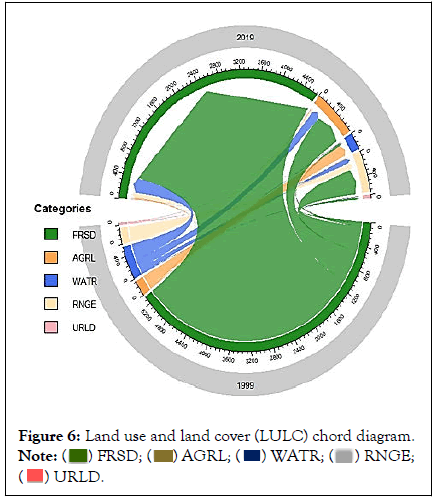
Figure 6: Land use and land cover (LULC) chord diagram.
Note: ( ) FRSD; (
 ) AGRL; (
 ) WATR; (
 ) RNGE;
(
 ) URLD.
| LULC classes | 1999 area (ha) | % area | 2009 area (ha) | % area | 2019 area (ha) | % area |
|---|---|---|---|---|---|---|
| FRSD | 533398.7903 | 82.63 | 525809.589 | 81.45 | 464914.9235 | 72.02 |
| AGRL | 55274.7005 | 8.56 | 31446.891 | 4.87 | 78932.3133 | 12.23 |
| WATR | 25745 | 3.99 | 136545.0642 | 2.11 | 27655.6229 | 4.28 |
| RANGE | 26922.7464 | 4.17 | 69668.8388 | 10.79 | 68122.1383 | 10.55 |
| URLD | 4192.2228 | 0.65 | 4963.077 | 0.77 | 5908.6419 | 0.92 |
| Total area | 645533.46 | 100 | 645533.46 | 100 | 645533.46 | 100 |
Table 2: Area of class in Hectare 1999, 2009 and 2019.
Land use/land cover estimation and analysis
Five major LULC types (Forest, agriculture, water body, range land and urban land) were classified for the years of 1999, 2009 and 2019. The results confirmed that the total land area of the study area was 645533.46 ha. The area coverage and percentage of each LULC for the three periods including 1999, 2009 and 2019 are summarized in Table 2. The LULC classification for the TM 1999 image shows that the majority of the study area was under agriculture and forest covering for about 588673.49 ha (91.9%) [20]. Urban land and water body covered an area of 4192.22 ha (0.65%) and 25745 ha (3.99%) respectively, whereas the Range land cover were 26922.74 ha (4.17%) from the total area of the basin (Table 2). Similarly, in 2009 the greatest share of LULC, from all classes but agriculture land and forest land which covers an area of 557,256.4.48 ha (86.32%). Urban land and water body covered an area of 4963.07 ha (0.77%) and 13654.06 ha (2.11%) respectively. The coverage was Range land, which accounts for only 69668.83 ha (10.79%). The results of LULC classification for the OLI 2019 image also shows that the greatest share of LULC from all classes goes to Agriculture and Forest areas, which covers 543847.23 ha (84.25%) of the total area of the basin. Urban Land and water body land covered 5908.64 ha (0.92%) and 27655.62 ha (4.28%) respectively. The Range land area was covered by which was 68122.13 ha (10.55%) respectively from the total size of the basin. Agriculture and forest still covered the largest area in 2019, but from 1999 to 2019 the forest cover area is decline by 10% which depicts conversion of other LULC classes to forest land converted to agriculture and settlement purpose. The major land cover in Tawa river basin is forest and play important role in the system for the function of ecosystem and regulate the climate system at local level to global frame (Figure 7) (Table 3).
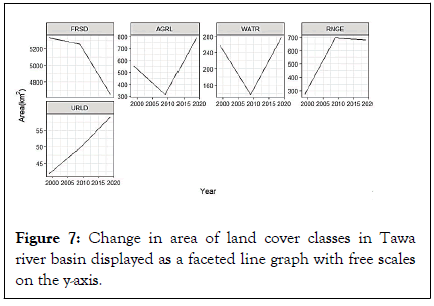
Figure 7: Change in area of land cover classes in Tawa river basin displayed as a faceted line graph with free scales on the y-axis.
| FRSD | AGRL | WATR | RNGE | URLD | |
|---|---|---|---|---|---|
| FRSD | 424647.81 | 56134.44 | 4187.43 | 44782.38 | 3645.27 |
| AGRL | 27206.1 | 16645.86 | 1202.4 | 9167.76 | 1052.73 |
| WATR | 2673.72 | 653.13 | 21117.87 | 1104.84 | 195.3 |
| RNGE | 8874.09 | 3945.42 | 995.94 | 12430.71 | 676.08 |
| URLD | 1510.83 | 1554.48 | 151.74 | 635.94 | 339.21 |
Table 3: Change in hectares from 1999-2019 in Tawa river basin with 1999 classes as rows and 2019 classes as columns.
LULC change form one class to other classes
The table shows the Land Use Land Cover (LULC) classes and their corresponding areas in Hectares (ha) for the Tawa river basin in the years 1999, 2009, and 2019. The LULC classes include Forest (FRSD), Agriculture (AGRL), Water bodies (WATR), Range lands (RANGE), and Urban and low dense Built-up lands (URLD). In 1999, the largest LULC class was forest, covering 533,398.7903 ha, which accounted for 82.63% of the total area of the Tawa river basin. Agriculture was the second-largest LULC class, covering 55,274.7005 ha or 8.56% of the total area. Water bodies covered 25,745.000 ha or 3.99% of the total area, while Range land and Urban and Built-up lands covered 26,922.7464 ha (4.17%) and 4,192.2228 ha (0.65%), respectively. In 2009, the forest cover decreased slightly to 525,809.5890 ha (81.45%), while agriculture land decreased to 31,446.8910 ha (4.87%). Water bodies, however, increased significantly to 136,545.0642 ha (2.11%), and range lands increased to 69,668.8388 ha (10.79%). Urban and Built-up lands also slightly increased to 4,963.0770 ha (0.77%). In 2019, the forest cover further decreased to 464,914.9235 ha (72.02%), while agriculture land increased to 78,932.3133 ha (12.23%). Water bodies decreased to 27,655.6229 ha (4.28%), while range lands slightly decreased to 68,122.1383 ha (10.55%). Urban and Built-up lands increased to 5,908.6419 ha (0.92%) [21]. Overall, the Tawa river basin has experienced changes in its land use land cover over the years, with a decrease in forest cover and an increase in agriculture land. The water bodies and range lands have also shown varying trends, while urban and built-up lands have remained relatively stable (Table 4).
| FRSD | AGRL | WATR | RNGE | URLD | |
|---|---|---|---|---|---|
| FRSD | 79.61191 | 10.523945 | 0.7850489 | 8.395689 | 0.683406 |
| AGRL | 49.21967 | 30.114709 | 2.1753112 | 16.585771 | 1.904537 |
| WATR | 10.38545 | 2.536934 | 82.027519 | 4.291497 | 0.758598 |
| RNGE | 32.96193 | 14.654873 | 3.6993207 | 46.172644 | 2.511232 |
| URLD | 36.03907 | 37.080292 | 3.6195792 | 15.169601 | 8.091456 |
Table 4: Change in hectares from 1999-2019 in Tawa river basin with 1999 classes as rows and 2019 classes as columns.
LULC change matrix analysis
The given table represents the area in percentage of five land use classes (FRSD, AGRL, WATR, RNGE, and URLD) in a particular region or watershed. The rows of the table represent the actual land use classes, while the columns represent the predicted classes. Each cell in the table represents the percentage of the area of the actual land use class that was classified as a predicted land use class. For example, the first row represents the FRSD (Forest) land use class, and the first column represents the predicted land use class [22].
The value in the cell FRSD-FRSD is 79.61%, which means that 79.61% of the area classified as FRSD in the actual land use map was correctly predicted as FRSD. Similarly, the cell AGRLFRSD (second row, first column) represents the percentage of area classified as FRSD in the actual map that was misclassified as AGRL, which is 10.52%.
The overall accuracy of the classification can be determined by summing up the diagonal values of the table (i.e., forest-forest, agriculture to agriculture, water body to water body class, range land to range land, urban land to urban land class), which represents the correctly classified areas, and dividing it by the total area of the define region. In this case, the overall accuracy would be (79.61+30.11+82.03+46.17+8.09)/100=0.6499 or 65%.
The land use change over the 20-year period the study finds the forest cover is quit decline from the time period between the 1999 to 2009. The major forest area is decline between the 2009 to 2019-time period because most of the forest land convert into agriculture and other purpose. Tawa river basin the major land cover area is forest [23,24] (Figures 8-10).
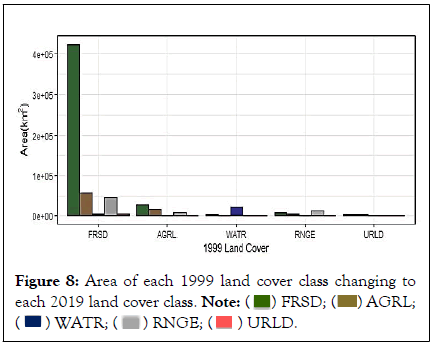
Figure 8: Area of each 1999 land cover class changing to each 2019 land cover class.
Note: ( ) FRSD; (
 ) AGRL; (
 ) WATR; (
 ) RNGE;
(
 ) URLD.
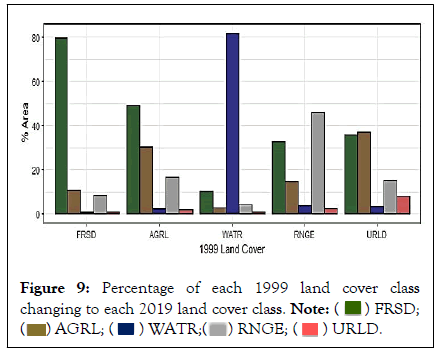
Figure 9: Percentage of each 1999 land cover class
changing to each 2019 land cover class.
Note: ( ) FRSD; (
 ) AGRL; (
 ) WATR; (
 ) RNGE;
(
 ) URLD.
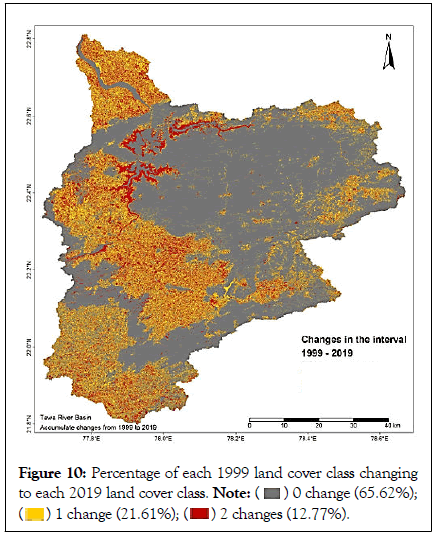
Figure 10: Percentage of each 1999 land cover class changing to each 2019 land cover class.
Note: ( ) 0 change (65.62%);
(
 ) 1 change (21.61%); (
 ) 2 changes (12.77%).
The objective of this study is to analysis and understand the change of land use and land cover changes and their dynamics that occurred in the Tawa river basin between the years 1999 and 2019 using remotely sensed data for easily analysis of land use for different human activities such as cultivation and settlement development past 20-year time period. In this research paper finds the land use and land cover and the study area have five class of LULC such as forest, agriculture, water body, Range land for gazing purpose and settlement which is less dense area. The pattern and trend observe in the present study is a forest area is decreases from 1999 to 2019 and agriculture increases and with parallel settlement area also increases with growing population. Increases population size with time, the observed LULC changes are mainly connected with the growing population and their demand for natural resources through fuelwood, charcoal production, and expanding cultivated and settlement areas in Tawa river basin. These changes creating problem which effect the natural system and disrupt the natural settings of the basin. biodiversity loss, continues use of land resource that leading to land degradation, and hydrological cycle disturbance in the basin. Since there is forest cover used to be brought for cultivation and agriculture activities. Hence, there is a risk to decrease in the extent forest cover land in the near future. The implication is that the recent tendency may lead to more land degradation. This research finding of this study highlights, the need for a proper local to regional level planning required and complete assessment of human activities in the study area and the adaptation of sustainable LULC practices such as close supervision of, forest land conservation through the restoration of degraded and impoverished lands and limiting further expansion of areas. To reverse undesirable situations associated with LULC changes in the study area, local communities should be provided with alternative livelihood strategies, sustainable land use planning and management, and appropriate implementation of plans to conserve forests, soil, and water.
[Crossref] [Google Scholar] [PubMed]
[Crossref] [Google Scholar] [PubMed]
[Crossref] [Google Scholar] [PubMed]
Citation: Rajput PK (2024) Mapping and Analyzing Land Use/Land Cover Changes: A Case Study of Tawa River Basin, Hoshangabad District, MP, India. J For Res.13:498.
Received: 27-Feb-2024, Manuscript No. JFOR-24-29823; Editor assigned: 01-Mar-2024, Pre QC No. JFOR-24-29823 (PQ); Reviewed: 15-Mar-2024, QC No. JFOR-24-29823; Revised: 22-Mar-2024, Manuscript No. JFOR-24-29823 (R); Published: 29-Mar-2024 , DOI: 10.35248/2168-9776.24.13.498
Copyright: © 2024 Rajput PK. This is an open-access article distributed under the terms of the Creative Commons Attribution License, which permits unrestricted use, distribution, and reproduction in any medium, provided the original author and source are credited.