Journal of Chromatography & Separation Techniques
Open Access
ISSN: 2157-7064
+44 1300 500008
ISSN: 2157-7064
+44 1300 500008
Research Article - (2013) Volume 4, Issue 5
A simple, sensitive and specific RP-HPLC method with UV detection was developed for the simultaneousestimation of losartan, atenelol and hydrochlorothiazide in tablet dosage form and telmisartan as an internal standard. Separation was achieved with an phenomenex luna 5 μ CN 100R, 250×4.60 mm 5 micron size column, ambient temperature with a low pressure gradient mode with mobile phase containing acetonitril, and 0.2% of diammonium hydrogen orthophosphate buffer pH 2.8 adjusted with orthophosphoric acid (50:50). The flow rate was 1 mL min-1 and eluent was monitored at 230 nm. The selected chromatographic conditions were found to effectively separate losartan (LOSAT), atenelol (ATEN) and hydrochlorothiazide (HCT) with retention time of 6.0, 5.0 and 4.0 min respectively. The proposed method was found to be rectilinear over the range of 25-150 μgmL-1, 25-150 μgmL-1 and 6.25-37.50 μgmL-1 for losartan, atenelol and hydrochlorothiazide respectively. The proposed method was found to be accurate, precise, reproducible and specific and it can also be used for routine quality control analysis of these drugs in biological samples either alone or in combined pharmaceutical dosage forms
Keywords: HPLC, Hydrochlorothiazide, Atenolol, Losartan and Telmisartan
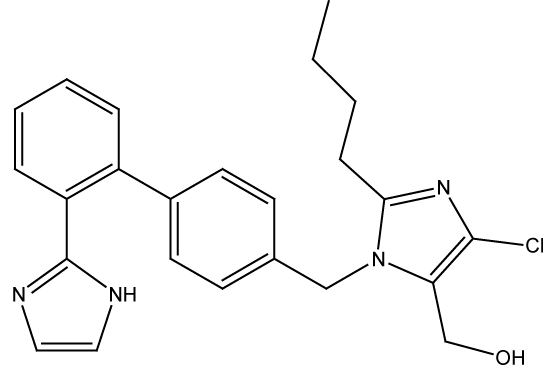
Losartan potassium is monopotassium salt of 4-butyl-4-chloro-1- [[2’-(1H-tetrazole-5-yl)[1,1’-biphenyl]-4-yl]methyl]-1H-imidazole-5- methanol. It is a selective, compitative angiotensin II receptor type 1 (AT1) receptor antagonist. Losartan administration results in a decrease in total peripheral resistance and cardiac venous return.
However, several methods have been described for the determination of Losartan potassium drug substance in tablets. Various methods developed are HPLC [1,2], spectrophotometric [3-5], capillary electrophoresis (CE) [6], HPTLC [7], LCMSMS [8] and voltametric [9].

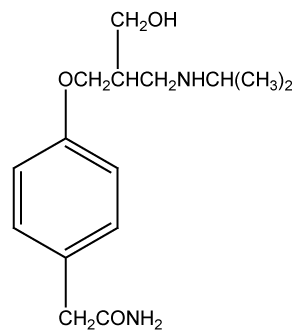
Atenolol is a beta-adrenergic blocking agent, By blocking the stimulation of these nerves, atenolol reduces the heart rate and is useful in treating abnormally rapid heart rhythms. Atenolol also reduces the force of contraction of heart muscle and lowers blood pressure. By reducing the heart rate, the force of muscle contraction, and the blood pressure against which the heart must pump, atenolol reduces the work of heart muscle and the need of the muscle for oxygen. Since angina occurs when oxygen demand of the heart muscle exceeds the supply, atenolol is helpful in treating angina.
Many methods are reported for the determination of atenelol alone and in combinational dosage forms are HPTLC [10,11], HPLC [12-16], spectrofluorimetric [17] and LCMSMS [18].

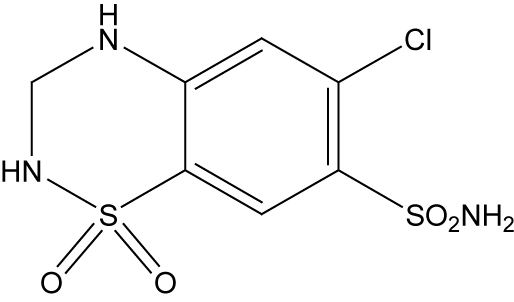
Hydrochlorothiazide (HCT), 6-Chloro-3,4-dihydro-2H-1,2,4- benzothiadiazine-7-sulphonamide-1,1-dioxide is the potent orally diuretic and antihypertensive agent related to chlorothiazide. This inhibits active chloride reabsorption and thus increases the excretion of sodium chloride and water.
There are many published determination methods for HCT in tablets using spectrophotometric [19-21], fluorodensistometric [22], gas and liquid chromatographic [23-25], LCMS [26] and polarographic techniques [27].

A new combination dosage form of LOSAT, ATEN and HCT is indicated for the treatment and management of hypertension. The focus of present study was to develop and validate simple precise and accurate method for the determination of losartan, atenelol & hydrochlorothiazide using telmisartan as an internal standard in tablet dosage form.
Chemicals and reagents
Working standards, Losartan and Atenelol were from Aurbindo Laboratories, Hyderabad, India. Hydrochlorthiazide and Telmisartan were from Aristo Pharmaceutical Ltd. Mumbai, India. Diammonium hydrogen orthophosphate, Orthophosphoric acid used were AR grade purchased from Merck. HPLC solvents like, Acetonitril, Methanol and water from Ranchem, Mumbai. The pharmaceutical dosage form containing 50 mg LOSAT, 50 mg ATEN and 12.5 mg HCT, LOSARBETA H 150 mg 20 tablets (Unichem laboratories) purchased from a local drug store. Telmisartan which was employed as an internal standard (IS) was obtained from Rambaxy Laboratories, New Delhi.
Instrumentation
The method development and validation was performed on a Shimadzu LC2010 integrator a 4-liquid gradient HPLC system (Kyoto Japan), provided with high speed auto sampler, column oven, degasser. LC solution software was used for data acquisition.
Chromatographic condition
The chromatographic column, phenomenex luna 5 µ CN 100R, 250×4.60 mm (5 micron size) column was used as stationary phase. The mobile phase was prepared with acetonitrile and buffer (50:50). Buffer solution was prepared by dissolving 0.2% diammonium hydrogen orthophosphate in 100 mL of water. The pH was adjusted to 2.8 with orthophosphoric acid; flow rate was 1 mL min-1 and injection volume was 20 µl. The detection was performed at 230 nm using UV detector at 25°C.
Standard preparation
Separate stock solutions of 1000 µg mL-1 of losartan, atenelol and hydrochlorothiazide were prepared in Acetonitrile, then 1 mL of stock solution was transferred into 10 mL of standard volumetric flask and diluted with mobile phase. The prepared stock solutions were stored at 25°C protected from light.
Preparation of calibration plot
Standard solutions were freshly prepared from the stock solution by diluting with mobile phase to obtain concentration range 25, 50, 75, 100, 125 & 150 µg mL-1 of Losartan, 25, 50, 75, 100, 125 & 150 µg mL-1 of Atenolol and 6.25, 12.5, 18.75, 25.0, 31.25 & 37.5 µg mL-1 Hydrochlorthiazide respectively. Each solution was injected in triplicate and chromatographed under the chromatographic conditions specified above. Telmisartan (10 µg mL-1) was used as internal standard for determination of mixtures of, Losartan, Atenelol and Hydrochlorothiazide with Telmisartan. Linear relationships were obtained when drug to- internal standard peak-area ratios were plotted against the corresponding concentrations for each drug.
Sample preparation
Average weight was calculated by weighing 20 tablets (LOSARBETA H). The tablets were crushed into homogenous powder. A quantity of powdered tablets equivalent to one tablet containing 50 mg of losartan 50 mg of atenelol and 12.5 mg of hydrochlorthiazide was transferred into a 100 mL volumetric flask. To this flask, 50 mL of Methanol were added, and the solution was sonicated for 25 min with intermittent shaking. The solution was cooled to ambient temperature. Then the volume was made up with Acetonirtile and centrifuged at 10,000 rpm for 10 min. The centrifuged solution filtered through a 0.45 µm Nylon filters (Millipore, Milford, MA, USA). From the filtered solution, aliquots of appropriate volume were transferred to 10 mL volumetric flasks and diluted to volume with mobile phase to furnish the concentration range listed in table 1.
Linear range
The linearity of the method was evaluated by analyzing different concentration of the drugs. According to ICH recommendations, at least five concentrations must be used. In this study six concentrations were chosen, in the ranges 25-150 µg mL-1 losartan, 25-150 µg mL-1 of atenolol and 6.25-37.50 µg mL-1 hydrochlorthiazide, respectively.
Accuracy and precision
The accuracy of the method was determined by recovery experiments using the standard addition method. Each solution was injected in triplicate and percentage recovery was calculated. The precision of the method was assessed by studying intra-day and interday variation. In the intra-day studies, standard and sample solutions were analysed in triplicate on the same day and percentage RSD was calculated. In the inter-day studies, standard and sample solutions were analysed in triplicate on three consecutive days and percentage RSD were calculated.
Limits of Detection (LOD) and Limit quantitation (LOQ)
In accordance with ICH recommendations [28], the approach based on the standard deviation of the response and the slope of the calibration plots was used to determine detection and quantification limits. LOD and LOQ values were estimated as [(standard deviation of repeatability)/(Slope of the regression equation)] by multiplying with 3.3 and 10 respectively. The values obtained are given in table 1.
| Losartan | Atenolol | Hydrochlorthiazide | Telmisartan (IS) | |||||
|---|---|---|---|---|---|---|---|---|
| Retention time (min) | Peak area | Retention time (min) | Peak area | Retention time (min) | Peak area | Retention time (min) | Peak area | |
| Mean | 6.0 | 68535 | 5.0 | 36348 | 4.0 | 127824 | 7.4 | 416588 |
| SD | 0.05 | 673.67 | 0.10 | 458.72 | 0.06 | 3842.97 | 0.02 | 3758.79 |
| RSD | 0.96 | 0.98 | 2.09 | 1.26 | 1.53 | 3.00 | 0.331 | 0.90 |
Table 1: Results of system suitability study.
Selectivity
The selectivity of the method was evaluated by assessing whether excipients present in the pharmaceutical formulations interfered with the analysis. A placebo for each tablet was prepared by mixing the respective excipients (plain lactose with 5% of starch as binder), and solutions were prepared by following the procedure described in the section on sample preparation. The commonly used tablet excipients did not interfere with the method.
Robustness
Robustness is a measure of capacity of analytical methods to remain unaffected by small but deliberate variation of the operating conditions. This was tested by studying the effect of change of mobile phase pH by ± 0.2, the amount of buffer in the mobile phase by ± 2%, and detector wavelength by ± 2 nm.
To develop and validate an efficient method for analysis of these drugs in pharmaceutical formulations, preliminary tests were performed with the objective of selecting optimum chromatographic conditions. The separation was tried using either columns described previously in the literature or alternative stationary phases. The main problems encountered during these investigations were tailing, poor peak shape and lack of resolution between losartan, atenelol, hydrochlorthiazide and IS. To solve these problems, three columns, C18, C8, and CN, were used for simultaneous determination of the drugs. The best resolution and peak shape, without excessive tailing, were obtained by use of the CN column. The effect of both mobile phase composition, flow rate and pH were also studied. The best resolution with reasonable retention time was obtained with mobile phase containing acetonitrile and 0.2% of diammonium hydrogen orthophosphate buffer pH 2.8 adjusted with orthophosphoric acid (50:50) with 1.0 mL min-1 flow rate. A major reason for using a concentration of 0.2% was to achieve maximum sensitivity of UV detection at low wavelengths. Members of this class of antihypertensive drugs contain weak benzene chromophores and are characterized by low molar absorptivity, so the detector was set at 230 nm to increase the sensitivity of the method. The specificity of the method is illustrated in figure 1 which indicates separation of the compounds was complete. Average retention times ± standard deviation for IS, LOSAT, ATEN & HCT were 6.06 ± 0.058, 5.8 ± 0.106 and 4.06 ± 0.062 min, respectively, for six replicate analyses. The students t test is performed and for the corresponding T value is 3.66, 3.67 and 3.67 for LOSAT, ATEN and HCT and the degree of freedom P is less than 0.005 (p value is 0.0032, 0.0032 & 0.0035 for LOSAT, ATEN and HCT) therefore the difference is significant. In determination of accuracy and precision, recovery was 100 ± 3%, which indicates the method is accurate, and intra-day and inter-day variation, as RSD, were no more than 1.83%, indicating the method is precise. In determination of the robustness of the method, slight variation of mobile phase pH, amount of buffer, in the mobile phase, and detector wavelength had no significant effect on chromatographic resolution.
Method validation
System suitability: The RSD values of peak area and retention time for drugs and IS are within 2% indicating the suitability of the system (Table 2).
| Name of the drug | Actual concentration (µg mL-1) | Intra-day | Inter-day | ||||
|---|---|---|---|---|---|---|---|
| Found concentration (µg mL-1) ± SD | RSD (%) | RME (%) | Found concentration (µg mL-1) ± SD | RSD (%) | RME (%) | ||
| LOSAT | 50 | 49.84 ± 0.129 | 0.258 | 0.116 | 49.90 ± 0.080 | 0.160 | 0.072 |
| 75 | 74.92 ± 0.065 | 0.086 | 0.039 | 74.92 ± 0.062 | 0.083 | 0.037 | |
| 100 | 99.84 ± 0.117 | 0.117 | 0.052 | 99.84 ± 0.117 | 0.117 | 0.052 | |
| ATEN | 50 | 49.82 ± 0.190 | 0.381 | 0.170 | 49.91 ± 0.046 | 0.092 | 0.041 |
| 75 | 74.86 ± 0.117 | 0.156 | 0.070 | 74.87 ± 0.117 | 0.156 | 0.070 | |
| 100 | 99.96 ± 0.024 | 0.024 | 0.011 | 99.87 ± 0.066 | 0.066 | 0.029 | |
| HCT | 12.5 | 12.44 ± 0.043 | 0.347 | 0.155 | 12.46 ± 0.045 | 0.362 | 0.162 |
| 18.75 | 18.70 ± 0.024 | 0.129 | 0.058 | 18.66 ± 0.064 | 0.342 | 0.153 | |
| 25 | 24.98 ± 0.005 | 0.022 | 0.010 | 24.96 ± 0.029 | 0.114 | 0.051 | |
Table 2: Intra-day and inter-day precision and accuracy of LOSAT, ATEN and HCT.
Linearity: The calibration curves were prepared by plotting the peak areas of the drug to IS which were linear in the range of 25-150, 25-150 and 6.25-37.5 µg mL-1 LOSAT, ATEN and HCT, respectively. Peak area ratios and concentrations were subjected to least square linear regression analysis to calculate the calibration equations and correlation coefficients. The mean regression equations were found as Y=0.002X (R2=0.988 n=6), Y=0.001X–0.002 (R2=0.993 n=6) and Y =0.013X (R2=0.990 n=6) for LOSAT, ATEN and HCT, respectively. y=ax+b where “y” is the peak area ratio of drugs, “a” is the slope, “b” is the intercept and “x” is the concentration of the measured solution in µg mL-1. The result shows that there is an excellent correlation between the peak area ratios and the concentrations of drugs in the range tested.
LOD and LOQ: The LOD was 0.003 µg mL-1 for LOSAT, 0.06 µg mL-1 for ATEN and 0.015 µg mL-1 for HCT at a signal to noise ratio of 3.1. The limit of quantification was determined as 0.05 LOSAT, 0.2 µg mL-1 for ATEN and 0.05 µg mL-1 for HCT at a signal to noise ratio of 10:1.
Precision: Intra-day precision was performed by relative standard deviation of five repeated assays of samples at the three concentration levels. Inter-day precision was determined by analyzing the same set of samples of five different days. The RSD values were found to be 0.083- 0.258% for LOSAT, 0.024-0.381% for ATEN and 0.022-0.362% for HCT respectively, indicating good precision shown in table 2.
Recovery: To examine the accuracy of the method, recovery studies were carried out by standard addition method. The percent recovery of the added standard to the assay samples was calculated from:
Recovery %=[(C1-Cu)/Ca] X 100
Were C1 is the total concentration of analyte found; Cu is the concentration analyte present in the formulation; and Ca is the concentration added to the formulation. The average percent recoveries obtained as 98.18-100.1% indicate good accuracy of the method in table 3.
| Name of the drug | Amount of drug in tablet (µg)a | Amount of pure drug added (µg) | Total found (µg)b (Mean±SDc) | RSD (%) | Recovery of pure drug added (%) |
|---|---|---|---|---|---|
| LOSAT | 49.96 | 50 | 99.92 ± 0.018 | 0.018 | 99.92 |
| 49.96 | 75 | 124.86 ± 0.093 | 0.075 | 99.87 | |
| 49.96 | 100 | 149.87 ± 0.074 | 0.049 | 99.91 | |
| ATEN | 49.89 | 50 | 99.69 ± 0.395 | 0.396 | 99.59 |
| 49.89 | 75 | 124.86 ± 0.061 | 0.049 | 100.0 | |
| 49.89 | 100 | 149.84 ± 0.074 | 0.049 | 99.92 | |
| HCT | 12.48 | 12.5 | 24.91 ± 0.017 | 0.067 | 99.47 |
| 12.48 | 18.75 | 31.20 ± 0.011 | 0.037 | 99.87 | |
| 12.48 | 25.0 | 37.42 ± 0.026 | 0.070 | 99.74 |
aLOSAR-BETA H (50 mg LOSAT, 50 mg ATEN, 12.5 mg of HCT)
bFive independent analyses
cStandard deviation
Table 3: Results of recovery studies by standard addition method.
Specificity: The specificity of the RP-HPLC method was determined by the complete separation of LOSAT, ATEN, HCT and IS as show in figure 1 with parameters like retention time (tR), resolution (Rs) and tailing factor (T). The peaks obtained for LOSAT, ATEN, HCT and IS where sharp and have a clear baseline separation.
Robustness: To ensure the insensitivity of the HPLC method to minor changes in the experimental conditions it is important to demonstrate robustness of the method. None of the modifications caused a significant change in the resolution between the drugs and IS, peak area RSD, USP tailing factor, peak width or theoretical plates.
A simple, rapid, and reliable LC method has been established for simultaneous determination of LOSAT, ATEN and HCT either alone or in their ternary formulations. The method has several advantages, including rapid analysis, a simple mobile phase, simple sample preparation, and improved sensitivity. It is suitable for analysis of these antihypertensive agents in their ternary formulations in a single isocratic run, in contrast with previous methods. This makes the method suitable for routine analysis in quality-control laboratories.
The authors would like to thank JSS University Mysore, India, Principal, administrative officer JSS college of Pharmacy Mysore, for providing all facilities to complete this research work.