Journal of Thyroid Disorders & Therapy
Open Access
ISSN: 2167-7948
ISSN: 2167-7948
Rapid Communication - (2015) Volume 4, Issue 2
Anaplastic thyroid cancer (ATC) is the most lethal type of thyroid cancer, with a mean survival of six months from the time of diagnosis. Using patient-derived ATC cell lines, we have recently shown that ATC contains a minority population of cancer stem cells that can grow as self-renewing, non-adherent thyrospheres. Compared to bulk tumor cells raised in monolayers, these thyrospheres have increased clonogenic and tumor-initiating potential, and they robustly initiate tumors that closely resemble human ATC when orthotopically implanted into the thyroids of immunodeficient mice. Here we use the Affymetrix GeneChip analysis to identify gene expression differences between thyrospheres and monolayer cells from the human ATC cell line THJ-11T. Our microarray analysis identified a total of 1,659 differentially expressed gene transcripts, many of which have been implicated in key pathways such as those governing cell proliferation, migration, invasion, vasculogenesis, and chemoresistance.
These results indicate that thyroid cancer stem cells have a distinct molecular signature. These data will be helpful for the design of future therapeutic strategies that directly target thyroid cancer stem cells.
Anaplastic thyroid cancer (ATC) is the most deadly of all thyroid cancers and is responsible for more deaths than all other endocrine cancers combined. It is an undifferentiated cancer that arises from the follicular cells of the thyroid. It lacks the typical follicular structure of normal thyroids, and does not express differentiated thyroid markers such as thyroglobulin, thyroperoxidase, sodium-iodide symporter, or the receptor for thyroid-stimulating hormone. Although ATC has been postulated to dedifferentiate from well-differentiated papillary or follicular thyroid cancers, it has recently been discovered that ATC contains a small subpopulation of cells termed cancer stem cells (or cancer-initiating cells) that can self-renew and divide both symmetrically and asymmetrically. These cells have the ability to differentiate into a multitude of tumor cell types [1-5].
Cancer stem cells may be isolated through a variety of techniques, including flow cytometry based on the expression of specific cell-surface markers such as CD133, CD44 and ALDH [6-9]. The sorting of side populations of cancer cells through Hoechst 33342 dye exclusion is an alternate approach [10]. Additionally, recent studies have shown that the sphere-formation assay is an equally efficient method of separating cancer stem cells from many primary tumors or cancer cell lines [2,5,11-13]. We and other laboratories have shown that these self-renewing cancer stem cells can be enriched under sphere-forming conditions. When the resulting thyrospheres are injected orthotopically into the thyroid glands of immunodeficient mice, they generate tumors that closely resemble human thyroid tumors [2,5]. In previous studies we used a bioluminescent human thyrosphere model to examine two patient-derived ATC cell lines: THJ-11T and THJ-16T [14]. We found that as few as 100 thyrosphere-derived single cells were sufficient to form a tumor when orthotopically injected into immunodeficient NOD/SCIDIL2rg-/- mice, and that tumors could be detected with live imaging as early as seven-days after implantation [13]. In contrast, at least 5×10⁵ parental monolayer cells (a 5000-fold increase) were required to generate a tumor in the same model. This robust bioluminescent human thyrosphere model establishes the tumorigenic role of human thyrospheres in promoting ATC. Furthermore, it validates the cancer stem cell model of ATC that as few as 100 thyrosphere cells are sufficient to develop tumors in mice.
Here we performed a genome-wide gene expression analysis with the Affymetrix GeneChip Array to gain more insight into the molecular characteristics of human thyrospheres. We identified a unique gene expression profile in thyrospheres generated from the human ATC cell line THJ-11T, and analyzed the interactions among the differentially expressed gene transcripts with the Ingenuity iReport TM program.
Cell culture and sphere-forming assay
The human ATC cell line THJ-11T was provided by Dr. John Copland of Mayo Clinic. Cells were cultured in RPMI-1640 medium (Cellgro) supplemented with 10% fetal bovine serum (FBS), nonessential amino acids, sodium pyruvate, and penicillin-streptomycin-amphotericin B. Cultures were maintained in a humidified chamber in a 5% CO2/air mixture at 37°C. To obtain thyrospheres, single cells were plated at 5,000 cells/well on ultra-low-attachment six-well plates and thyrospheres were harvested after seven days as described previously [2,13].
DNA microarray analysis and network analysis
Total RNA was isolated from purified thyrospheres or from the monolayer cells of THJ-11T. 100 ng of total RNA was converted to double-stranded cDNA using an oligo-dT primer encoding a T7 RNA polymerase promoter. The resulting cDNA was in vitro transcribed and labeled with biotin, followed by fragmentation of the biotinylated cRNA. Next, the fragmented cRNA was hybridized to the Affymetrix GeneChip Human Genome HG-U133 Plus 2.0 Array made available through the Saint Louis University Microarray Core Facility. Affymetrix Fluidics Station 450 was used to wash and stain the chips. The Affymetrix G3000 GeneChip Scanner detected fluorescence, and GeneChip image analysis was performed with Affymetrix GeneChip Command Console. To obtain accurate and reliable data, we studied three independent samples for each thyrosphere and monolayer group. A total of six arrays with three arrays for each group were analyzed. Data of the interactions among the differentially expressed genes were analyzed by Ingenuity iReport TM program (Ingenuity Systems, Redwood City, CA). Microarray data were deposited in GEO (accession no. GSE53050)
We used an Affymetrix Human Genome HG-U133 Plus 2.0 Array and the human THJ-11T cell line to compare gene expression in thyrospheres with that of monolayer cells (Figure 1). The HG-U133 platform was chosen for its complete coverage of the human genome. We assayed approximately 45,341 gene transcripts simultaneously on a total of six arrays (three arrays for each of the thyrospheres versus monolayer cells). We observed virtually identical gene expression patterns in the three independent arrays of each group, confirming the reproducibility of the data. We identified a total of 1,659 differentially expressed gene transcripts (DEGs) with expression levels that varied significantly, defined as a three-fold difference in expression levels with a p-value cutoff of 0.05, between thyrosphere and monolayer cells. The DEGs were annotated using NCBI Entrez Gene and analyzed with the Ingenuity Pathway Analysis program. A heat map of the top 100 DEGs is shown in Figure 2. A volcano plot of microarray data showing significance versus gene-expression ratio is provided in Figure 3.
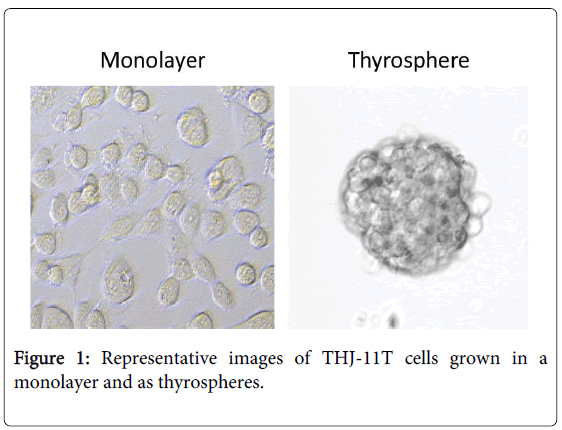
Figure 1: Representative images of THJ-11T cells grown in a monolayer and as thyrospheres.
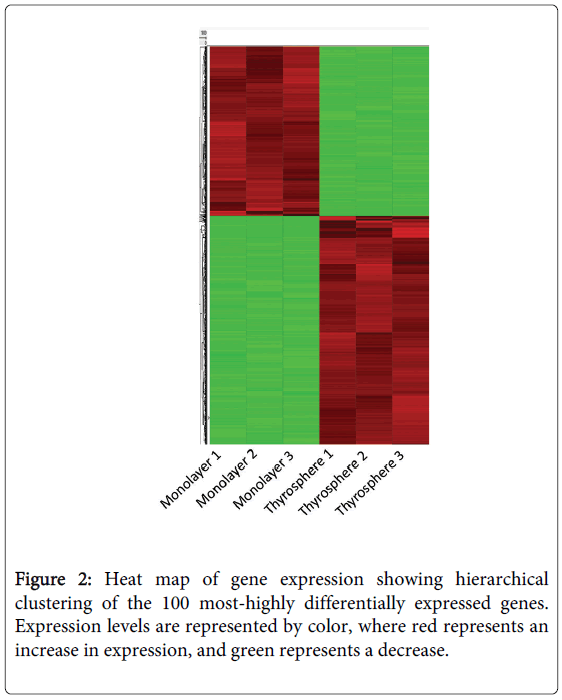
Figure 2: Heat map of gene expression showing hierarchical clustering of the 100 most-highly differentially expressed genes. Expression levels are represented by color, where red represents an increase in expression, and green represents a decrease.
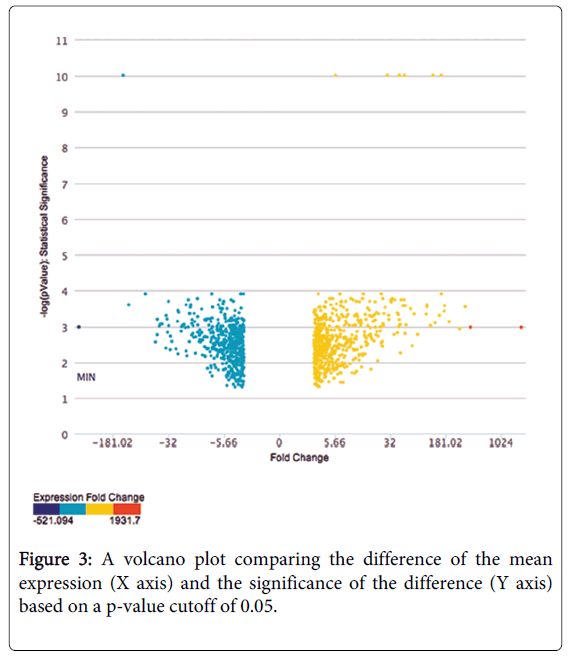
Figure 3: A volcano plot comparing the difference of the mean expression (X axis) and the significance of the difference (Y axis) based on a p-value cutoff of 0.05.
Table 1 shows the top 25 most-differentially-expressed genes in THJ-11T thyrospheres as identified by our microarray analysis. S100A8, a member of the S100 superfamily of calcium-binding proteins [15], is the gene most highly up-regulated in thyrospheres, which express 1,931-fold higher levels than do monolayer cells (p=0.0000217). Overexpression of S100A8 in breast carcinomas is correlated with disease aggressiveness as measured by grade, invasion, mitotic activity and metastasis [16]. S100A8 is also overexpressed in ATC, the most aggressive subtype of thyroid cancer in humans [17], and we recently demonstrated a novel role for S100A8 in the promotion and enhancement of ATC progression [18]. Prostaglandin-endoperoxide synthase 2 (PTGS2), also known as cyclooxygenase-2, is the second-most highly up-regulated gene in thyrospheres, which express 394-fold higher levels than do monolayer cells ((p=0.0000213). Our analysis indicated that ABCA6 is significantly up-regulated (158-fold) in thyrospheres as compared to monolayer cells. ABCA6 is a member of the superfamily of ATP-binding cassette transporters (ATP-binding cassette, subfamily A (ABC1), member 6). A group of ABC transporters including ABCA3, ABCC2, ABCA6, ABCC6 and ABCD2 has been reported to play a role in the chemoresistance of acute myeloid leukemia [19]. Further studies will be required to determine whether ABCA6 promotes chemoresistance in ATC. In addition to these candidates, our microarray analysis identified several previously unknown genes that may play key roles in regulating ATC cells. For example, COL13A1 is the most highly down-regulated in thyrospheres, which express 521-fold lower levels than do monolayer cells (p=0.0000207). It encodes the alpha chain of one of the non-fibrillar collagens [20]. The function of this gene product in ATC is unknown. We next performed an unbiased analysis for pathway, process and disease association of the DEGs using Ingenuity iReportTM. Several genes that are up-regulated in thyrospheres are likely to be involved in cell migration and invasion, including S100A8, PTGS2, LUM, LYP1B1, PECAM1, MMP2, CSF2, and VCAM1. Other up-regulated genes, including PTGS2, LUM, CYP1B1, ANGPTL4, NOX5, ITBG3 and CCNA1, promote cell proliferation. Many other genes we identified are also implicated in key pathways, such as those governing signaling by PPAR, IGF-1, IL-6, IL-10, HER-2, P53 and NF-κB, and by VDR/RXR activation (Table 2). Further studies are needed to determine whether these genes have any prognostic or therapeutic value in ATC.
| Up-regulated | Down-regulated | ||||
|---|---|---|---|---|---|
| Gene Symbol | Fold Change | p-Value | Gene Symbol | Fold Change | p-Value |
| S100A8 | 1931.7 | 2.17E-05 | TJP2 | -17.9034 | 8.07E-04 |
| PTGS2 | 394.583 | 2.13E-05 | GPR109B | -18.3439 | 7.00E-07 |
| LUM | 334.578 | 9.00E-07 | MARCH4 | -18.3443 | 4.81E-04 |
| CYP1B1 | 280.435 | 2.60E-05 | LOC100126784 | -23.5371 | 1.70E-06 |
| PECAM1 | 202.366 | 1.02E-05 | ANKRD33B | -23.5718 | 6.52E-04 |
| ANGPTL4 | 175.199 | 8.00E-07 | GAS6 | -23.901 | 9.70E-06 |
| NOX5 | 173.601 | 1.80E-06 | PLCB4 | -25.1541 | 3.73E-04 |
| ABCA6 | 158.383 | 1.00E-07 | TPM1 | -28.6143 | 1.51E-04 |
| ITGB3 | 149.136 | 3.70E-06 | WNT7A | -29.7926 | 7.42E-05 |
| VCAM1 | 129.89 | 1.16E-05 | PEAR1 | -30.0756 | 4.13E-04 |
| ID4 | 113.189 | 1.64E-05 | TRPC4 | -31.3703 | 2.50E-06 |
| NCRNA00284 | 101.298 | 7.00E-07 | ALPK2 | -31.5871 | 1.73E-05 |
| RARRES1 | 101.189 | 9.00E-07 | FGF2 | -31.7969 | 4.00E-07 |
| PI3 | 98.7677 | 2.70E-06 | LOC642587 | -33.2161 | 6.40E-06 |
| MMP2 | 75.5661 | 5.87E-05 | FGFBP1 | -34.3165 | 3.70E-06 |
| ANXA10 | 67.8518 | 2.60E-06 | EDN1 | -34.5695 | 3.38E-04 |
| MB | 63.8275 | 2.57E-04 | KISS1 | -38.6972 | 1.37E-05 |
| SLITRK6 | 60.6599 | 1.30E-06 | PADI1 | -41.2152 | 1.40E-05 |
| ASB2 | 52.7098 | 1.50E-05 | C7orf58 | -42.2938 | 1.86E-05 |
| DHRS9 | 51.4966 | 8.00E-07 | MEOX1 | -45.1244 | 6.60E-06 |
| KYNU | 51.2442 | 5.10E-05 | DKK1 | -45.308 | 6.06E-05 |
| SLC16A6 | 44.1407 | 5.82E-04 | RBM24 | -47.7938 | 1.64E-04 |
| CSF2 | 43.6137 | 1.44E-05 | RBMS3 | -65.298 | 1.00E-07 |
| HTR7 | 42.4529 | 7.30E-06 | PDE1C | -109.802 | 7.00E-07 |
| EGLN3 | 41.9343 | 1.98E-05 | COL13A1 | -521.094 | 2.07E-05 |
Table 1: Top 25 up- or down-regulated genes in human thyrospheres, ranked by expression level
| Pathways | p-Value | Genes |
|---|---|---|
| PPAR Signaling | 5.09928E-06 | PTGS2, IL1RL1, IL33, IL1RN, IL37, CITED2, IL1R1, IL12, CREBBP, RRAS, MAP4K4, MAP3K14, PDGFA, TNF, PDGFB, IL18, FOS |
| VDR/RXR Activation | 6.38077E-06 | HSD17B2, CSF2, IL1RL1, SEMA3B, IGFBP3, RUNX2, CDKN1A, CXCL10, PDGFA, GADD45A, CST6, DEFB4A/DEFB4B, CYP24A1, THBD, COL13A1 |
| Tissue Factor Signaling | 2.89682E-05 | ITGB1, CTGF, PTK2B, RRAS, EGR1, ITGA6, FRK, ITGB3, VEGFA, PIK3R3, AKT3, PIK3CD, CYR61, CSF2, MMP1, EGFR, FGF5 |
| IGF-1 Signaling | 0.000117945 | IGFBP4, CTGF, RRAS, IGFBP7, PTK2, PIK3R3, FOS, NOV, IRS1, IGF1R, IGFBP3, AKT3, PIK3CD, CYR61, RASA1 |
| HER-2 Signaling | 0.000425018 | PIK3R3, ITGB1, RRAS, NRG1, CDKN1A, AKT3, PIK3CD, MMP2, ITGB8, ITGB4, ITGB3, EGFR |
| IL-10 Signaling | 0.000527193 | IL1R2, IL33, FOS, MAP3K14, IL18, IL1RL1, IL1RN, MAP4K4, IL37, IL1R1, TNF |
| IL-6 Signaling | 0.000808592 | MAP3K14, RRAS, IL1RL1, MAP4K4, IL1R1, IL37, IL33, IL1R2, COL1A1, FOS, IL18, IL1RN, TNF |
| PAK Signaling | 0.001585823 | MYL9, PIK3R3, MYLK, PTK2, ITGB1, PTK2B, PDGFA, RRAS, PIK3CD, TNF, PDGFB, ITGA4 |
| NF-κB Signaling | 0.001959586 | TLR1, MAP3K14, RRAS, CREBBP, MAP4K4, IL37, IL1R1, IL33, IL1R2, PIK3R3, IL18, CD40, IL1RN, IGF1R, AKT3, PIK3CD, TNF, EGFR |
| p53 Signaling | 0.002319164 | PIK3R3, TP53INP1, TP63, GADD45B, GADD45A, THBS1, CDKN1A, PERP, AKT3, PIK3CD, CHEK2 |
Table 2: Gene pathways differentially expressed in thyrospheres, using the Ingenuity Pathways Analysis System
In summary, our discovery of a distinct molecular signature of thyroid cancer stem cells will enable the elucidation of disease mechanisms and the evaluation of the relative contributions of genes responsible for the aggressiveness of ATC. It may also help identify novel therapeutic targets for intervention.
We thank Dr. John A. Copland for providing the THJ-11T cell line. We also thank Audrey Watson and the Saint Louis University Microarray Core Facility for microarray analysis. This work was supported by the National Institutes of Health Grant R01 DK068057 (to R.Y.L.).
Author Disclosure Statement. The authors have declared that no competing interests exist.