Journal of Biomedical Engineering and Medical Devices
Open Access
ISSN: 2475-7586
ISSN: 2475-7586
Original Research Article - (2022)Volume 7, Issue 10
Background: This study was performed to study possible causes of Portal Vein thrombosis, a potentially deadly complication of specific foregut surgical procedures.
Methods: Mathematical models of blood flow to the foregut organs, stomach, duodenum, spleen, and liver, were created in MATLAB. Pathologic conditions were created by removing or adding the electrical components in the circuit modeled in MATLAB. These modifications represented surgical variation and hemodynamic changes. Comparing the input and output waveforms and comparing them to the known wave from live subject samples were able to model conditions where the likelihood of portal vein thrombosis is most likely to occur.
Results: Ligation of the gastroepiploic vessels produce significant flow disruption in our model, significantly more than dehydration, causing portal vein flow reduction and possible portal vein thrombosis.
Conclusion: Summary and potential implications.
Trial registration: No registration or IRB was required. The study did not involve any human or animal subjects.
Physiology; Anatomic pathology; Biomedical engineering; Biomedical modeling; MATLAB; Portal vein thrombosis; Laparoscopic sleeve gastrectomy
Portal Vein Thrombosis (PVT), blood clot formation in the Portal Vein (PV), is a potentially life-threatening condition. Possible causes may include decreased flow and pressure in the portal venous system and reduced liver circulation [1]. A very high index of suspicion for those at risk, early detection, and prompt treatment results in a favorable outcome in most patients [2]. Surgery involving the liver and the spleen has been described as a risk factor for PVT [3,4]. In addition, several case series have reported PVT after laparoscopic Sleeve Gastrectomy (SG) to treat morbid obesity [5,6].
The increased pressure and flow resistance caused by the anatomical and vascular changes following the devascularization of the greater curvature of the stomach has been hypothesized as a risk factor for PVT [7]. However, this theory raises the question of whether variability in the surgical technique results in PVT after SG. Therefore, we specifically looked at the extent of devascularization of the greater curvature of the stomach as a risk factor and a possible cause of PVT. We also modeled dehydration and hypercoagulability as alternative causes for PVT without any anatomical changes.
In our modeling and simulation, ligation of the left gastroepiploic artery and, to a much lesser degree, the vein results in significant flow reduction in splenic and portal veins. This reduced flow in the portal vein may be a substantial factor in flow disruption resulting in portal vein thrombosis. The dissection of the greater curvature should be adjacent to the stomach to preserve the left gastroepiploic artery and vein. Hypercoagulability caused by dehydration appeared to be a less significant factor.
We have created a model for the flow dynamics of PV using electrical circuitry. The model was subjected to emulating surgical changes to identify possible variations in flow resistances resulting in PVT. This was accomplished using the Simulink module of MATLAB (R2021a).
PVT is considered a rare event in the general population, with an incidental finding rate of usually less than 1% [8]. There has been an increasing awareness of PVT and its complications in cancer in cancer patients [9]. In non-surgical patients, it is recognized that most PVT patients have liver cirrhosis and portal hypertension. The pathophysiology may be related to the decreased flow through the liver, possibly by increased pressure secondary to decreased compliance of the vascular space. PVT has been reported after weight-loss surgical procedures [10,11]. Increased intra-abdominal pressure, the release of Vasopressin, and dehydration have all been suspected to be risk factors for PVT [12,13]. Cases of PVT may rise as the number of SG performed increases. The current literature reports an incidence of 0.3-0.6% for PVT after SG [14,15]. Even though the incidence may be low [16], its outcome is potentially fatal, and avoidance of the complication and early detection and treatment is critical to successful recovery.
Causes
The etiology and risk of PVT have been classified and reported into local (50%-70%) and systemic (30%-70%) factors [17,18]. PVT's frequently reported localized risk factors include cirrhosis and abdominal inflammatory conditions. In addition, Hepatocellular, pancreatic, and cholangiocarcinoma have been implicated as PVT risk factors [19,20]. Inflammatory bowel disease, pancreatitis, cholecystitis, liver transplantation, hypercoagulable states, myeloproliferative disorder, and protein C or S deficiency also increase the risk of PVT [21,22]. As for the surgical causes, specifically SG, local and systemic causes should be considered. The local causes may include any changes to flow dynamics similar to those noted in cirrhosis. Systemic causes after SG may include Insufflation [23], manipulation of portosystemic vessels [24], dehydration, and hyper coagulopathy [21,25,26]. These proposed mechanisms have been hypothesized with no definitive scientific clinical evidence [24]. Furthermore, no randomized trials have been conducted due to the ethical and technical limitations of such a study.
Clinical presentation
The clinical presentation of PVT is vague and non-specific. The patients may complain of abdominal pain, persistent nausea, and vomiting and sometimes may present with ascites [27]. In acute cases, the physical finding may be indistinguishable from immediate post-operative ones. A delay in the diagnosis of PVT will progress to fever and sepsis secondary to mesenteric and bowel ischemia. In cases where PVT is not recognized, and treatment is not initiated swiftly, it could result in intestinal perforation, shock, and death [16,24]. Chronic PVT usually presents with sequelae of portal hypertension, with gastric and esophageal variceal bleeding being reported as the most noticeable symptom.
Diagnosis
With a high index of suspicion, imaging studies are used for the early diagnosis of PVT. The most sensitive test for diagnosis of PVT is the Computed tomography of the abdomen with IV contrast to include both arterial and venous images [28,29].
Treatment
If possible, the management of PVT involves early anticoagulation and hydration. In rare circumstances, in patients with cirrhosis, Trans-jugular Intrahepatic Portosystemic Shunt (TIPS) placement may be indicated [30]. Resolution of symptoms and prevention of thrombus extension is the ultimate goal of treatment [31].
Method of modeling
The blood flow dynamics of PVT in surgical patients have only been hypothesized based on possible suspected causes such as dehydration, insufflation of the peritoneal cavity, and vascular flow dynamic changes [24]. Our model created was based on the most common radiologic findings defining the arterial and venous anatomy of the stomach, liver, and spleen [32,33].
To examine the vascular flow changes as a possible contributing factor to PVT, we designed and emulated an electrical model based on the vascular system of the Celiac axis, portal, and systemic venous drainage of the stomach, spleen, and liver.
There were several assumptions made. First, the blood viscosity was assumed to be constant throughout the vascular system, arterial and venous. Second, the distributive effect of the circulation in the unnamed vessels was nominal and not modeled. Third, the electrical modeling was based on matching the waveform obtained from ultrasonography of the significant vessels [34]. Forth, the descriptive subcircuit of each vessel was based on the presumption that the waveform into and out of the blood vessel will maintain the same shape with different aptitudes given the resistance and compliance of the blood vessel. Therefore, each major named artery after the celiac axis was constructed based on the above assumption and modeled accordingly. Fifth, we assumed a net-zero volume loss in and out of the spleen and stomach. Our model assumed no lymphatic losses.
We hypothesize that sleeve gastrectomy's surgical technique may contribute to the increased incidence of PVT in SG. Although the procedure of SG may be well defined, there is a significant variation between the methods and dissection used by surgeons when mobilizing and de-vascularizing the greater curvature of the stomach. Variations include the size of the Bougie, the extent of dissection proximally and distally on the greater curvature and the proximity of devascularization on the stomach, and avoidance of ligation of left gastroepiploic and gastrosplenic branches of the splenic artery. Given the broad variation in the surgical approach of SG, we elected to examine possible vascular causes as contributing factors to PVT. Specifically, we looked at the ligation of the left gastroepiploic and gastrosplenic branches as potential risk factors for PVT.
Electrical modeling
The electrical model of arterial flow has been defined by Windkessel's model [35,36]. As a mathematical model, Windkessel provides a predictable and reproducible analog of vascular flow in electrical circuitry [37]. Blood pressure, stroke volume, heart rate, blood vessel size, vessel thickness, and compliance are all described in terms of voltage potential differences, current, frequency, capacitance, resistance, and a mathematical function of those variables [38,39].
Numerical modeling and electrical circuitry emulation have been published previously for significant branches of the aorta, including the carotids and circle of Willis, and conditions such as arterial stenosis [40-42]. In addition, the simulation of blood flow in the abdominal aorta has been described using a three-dimensional deformable model to describe vascular compliance, blood flow velocity, and pressure gradients [43]. Our analysis is the first in mathematical modeling of visceral arterial and venous flow for a specific surgical pathology of abdominal organs.
For the electrical circuit simulation, we designed the simplified circuit model representing blood vessels to and from the stomach and spleen (Figure 1).
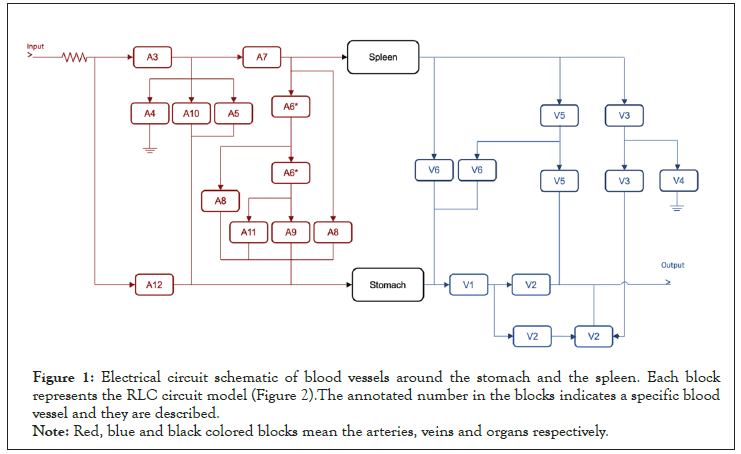
Figure 1: Electrical circuit schematic of blood vessels around the stomach and the spleen. Each block
represents the RLC circuit model (Figure 2).The annotated number in the blocks indicates a specific blood
vessel and they are described.
Note: Red, blue and black colored blocks mean the arteries, veins and organs respectively.
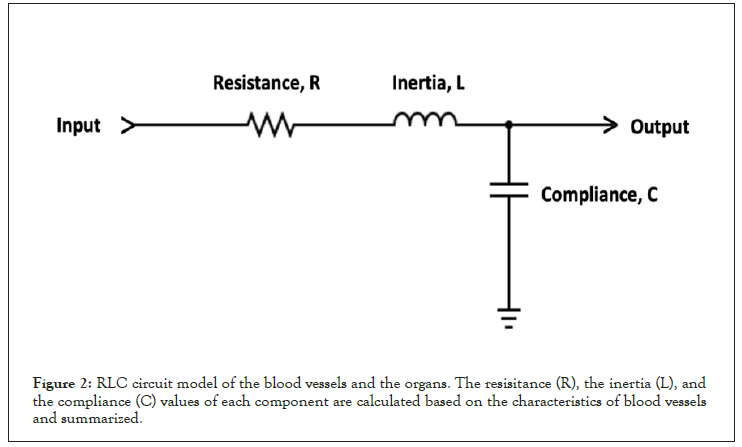
Figure 2: RLC circuit model of the blood vessels and the organs. The resisitance (R), the inertia (L), and the compliance (C) values of each component are calculated based on the characteristics of blood vessels and summarized.
In the block diagram, red and blue blocks represent arteries and veins, respectively, while the stomach and spleen are illustrated in black. Each anatomical structure (vessel, organ) is represented by a sub circuit comprising a resistor, capacitor, and inductor. The vessel size, wall thickness, and compliance differences are reflected in the difference in the resistance, capacitance, and inductance values of the represented circuit [44] (Figure 2).
Each block, including the stomach and spleen, is modeled with the resistance (R), the compliance (C), and the inertia (L) of blood vessels and organs, as shown in Figure 2. The values of circuit elements are calculated based on blood viscosity, vessel diameters, and the thickness of blood vessels [44], and the values are summarized in Table 1. The input waveform of the system is modeled to replicate the ultrasonography of the abdominal aorta [45] with the modulation frequency and the carrier frequency of 1.33 Hz (which corresponds to 80 bpm of the heart rate) and 1 kHz, respectively (Figure 3). The amplitude of the input waveform is simulated as 1.2 V and 0.8 V at the first and second plateaus to mimic the blood pressure of 120 mmHg and 80 mmHg, respectively. The output waveform is measured at the terminal of portal veins (V2 blocks in Figure 1).
| Vessel number | Description | Compliance (µF) | Resistance (kΩ) | Inertia (µH) |
|---|---|---|---|---|
| A1 | Ascending aorta | 1211.813 | 0.011 | 0.197 |
| A2 | Thoracic aorta | 2153.308 | 0.126 | 1.215 |
| A3 | Abdominal aorta | 261.917 | 0.81 | 2.221 |
| A4 | Abdominal aorta | 303.276 | 0.067 | 0.427 |
| A5 | Left gastric | 13.562 | 13.847 | 7.898 |
| A6 | Right gastric | 4.572 | 161.958 | 30.749 |
| A7 | Splenic | 166.666 | 5.984 | 7.291 |
| A8 | Left gastroepiploic | 1.553 | 131.056 | 18.689 |
| A9 | Right gastroepiploic | 0.137 | 433.116 | 40.608 |
| A10 | Common hepatic | 97.888 | 0.184 | 0.582 |
| A11 | Gastroduodenal | 6.487 | 1.93 | 1.565 |
| A12 | Proper hepatic | 19.88 | 4.401 | 3.342 |
| V1 | Left gastric | 0.401 | 79.714 | 214.213 |
| V2 | Portal vein | 1.839 | 51.97 | 139.659 |
| V3 | Splenic | 0.758 | 115.294 | 309.828 |
| V4 | Inferior mesenteric | 17.907 | 2.658 | 7.144 |
| V5 | Left gastroepiploic | 0.002 | 877.605 | 2358.371 |
| V6 | Left gastroepiploic | 0.002 | 877.605 | 2358.371 |
| Stomach | Stomach | 29.452 | 2238.72 | 6016.070 |
| Spleen | Spleen | 0.236 | 55968.000 | 150401.8 |
Table 1: Description and RLC values of blood vessels and organs.

Figure 3: (a) Input waveforms replicate the abdominal aorta’s ultrasonography with1.33Hz of the modulation frequency and 1 kHz of the carrier frequency. (b) The magnified image shows the modulated sinusoidal signal having 1 kHz frequency. (c) The ultrasonography image of the abdominal aorta.
The circuit model was simulated using licensed MATLAB (R2021a) and its Simulink module. Simulating the effect of the ligation of the Left and right gastroepiploic artery (A6, A8) and left gastroepiploic veins (V5 and V6) was emulated in the circuit model by deleting the corresponding blocks in Simulink. Figure 4 shows the output waveforms before and after ligating the arteries and veins described above. The simulation results revealed that the ligation of said vessels lowers the amplitude (pressure) on portal veins by a factor of 3.5, from 0.7 mV to 0.2 mV, a 70% reduction.
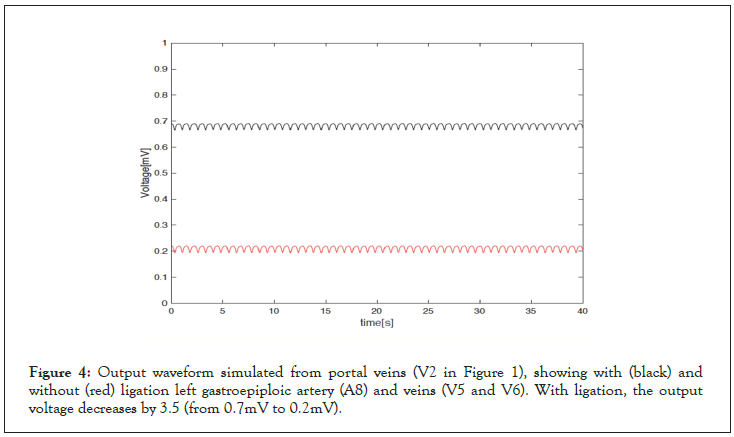
Figure 4: Output waveform simulated from portal veins (V2 in Figure 1), showing with (black) and without (red) ligation left gastroepiploic artery (A8) and veins (V5 and V6). With ligation, the output voltage decreases by 3.5 (from 0.7mV to 0.2mV).
The model was then disrupted based on the number of possible scenarios suspected to contribute to the incidence of PVT. Namely, these were interruptions in the arterial and venous system, which could lead to either stagnation off the floor of the portal vein or significant disruption of the pressure gradient between dirt arterial input and venous output [46].
We demonstrated that ligation of the branches of the Left gastroepiploic and splenic-gastric vessels (artery and vein) results in significant flow reduction in the portal vein by over 70%. This was significantly more than a 50% increase in viscosity, resulting in a 15% decrease in flow.
To simulate hypercoagulable states, we added the resistance at the input side of the whole circuit. Higher viscosity decreases the blood flow, and it can be mimicked in the circuit model by increasing the resistance (decreasing the current flow). We chose the resistance value to be the same as the magnitude of impedance value of the whole circuit. Figure 5 shows the magnitude of impedance curve of the whole circuit model over the frequency. At the carrier frequency (l kHz), the magnitude of the impedanceis measured to be 115 Ω. Adding the resistance at the input node of the circuit model (Figure 1) decreases the simulated output voltage from 0.7 mV to 0.6 mV as shown in Figure 6.
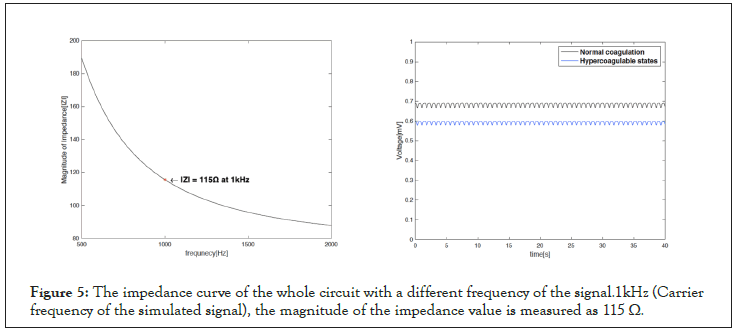
Figure 5: The impedance curve of the whole circuit with a different frequency of the signal.1kHz (Carrier frequency of the simulated signal), the magnitude of the impedance value is measured as 115 Ω.
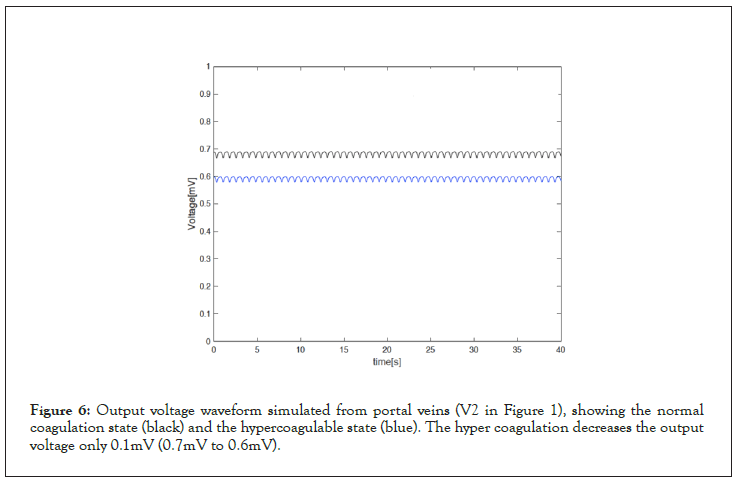
Figure 6: Output voltage waveform simulated from portal veins (V2 in Figure 1), showing the normal coagulation state (black) and the hypercoagulable state (blue). The hyper coagulation decreases the output voltage only 0.1mV (0.7mV to 0.6mV).
Portal vein thrombosis remains to be a challenging condition with significant morbidity and mortality. Our modeling has identified a possible cause for the higher incidence of PVT with SG. With ligation of gastroepiploic vessels in SG, the risk of PVT may be significantly increased. Dehydration in our model represents a less likely risk factor as a cause for PVT.
For ethical reasons, randomized human clinical trials are not possible. However, animal studies may be used as viable alternatives to support our modeling study. Our modeling shows that it may be clinically significant to de-vascularize the greater curvature of the stomach directly on the serosa to avoid ligation of the gastroepiploic vessels.
None
Ara Keshishian, Study Design, Outline, anatomical and pathological perspective, Jaehoon Lee, Electrical engineering modelling, Santiago Salgado, Literature search, proofreading.
No funding was provided.
No competing interest to Report.
All the basic MATLAB Data are available and provided with the submission.
Ethics approval and consent to participate
No Ethics approval or IRB was needed since no live subjects were included.
[Crossref][Google Scholar][PubMed]
Citation: Keshishian A, Lee J, Salgado S (2022) Modeling and Simulation for Identification of Possible Cause for Portal Vein Thrombosis: A Complication of Sleeve Gastrectomy. J Biomed Eng Med Dev.7:241
Received: 07-Oct-2022, Manuscript No. BEMD-22-19480; Editor assigned: 10-Oct-2022, Pre QC No. BEMD-22-19480 (PQ); Reviewed: 24-Oct-2022, QC No. BEMD-22-19480; Revised: 31-Oct-2022, Manuscript No. BEMD-22-19480 (R); Published: 07-Nov-2022 , DOI: 10.35248/2475-7586.22.07:241
Copyright: © 2022 Keshishian A, et al. This is an open access article distributed under the terms of the Creative Commons Attribution License, which permits unrestricted use, distribution, and reproduction in any medium, provided the original author and source are credited.