Journal of Oceanography and Marine Research
Open Access
ISSN: 2572-3103
ISSN: 2572-3103
Research Article - (2017) Volume 5, Issue 1
In this study, a nonlinear model for estimation of the tidal currents in shallow waters is presented. This hydrodynamic model, based on shallow water equations, has investigated the effects of Earth’s rotation and changes in topography and friction effects. According to the given model, the direction and velocity of tidal currents in each hour of a day along the year, for low amplitude waves at Khurmusa and Asaluyeh in Persian Gulf, can be calculated. This study has shown that the average velocity, during the tidal currents at Khurmusa’s level, is 0.36 m/s and the maximum speed is 0.999 m/s, while these values for Asaluyeh’s are respectively 0.17 m/s and 0.847 m/s. The comparison of the output of the model with experimental data has shown that the model has a good accuracy.
<Keywords: Modeling; Tidal currents; Persian Gulf; Hydrodynamic model; Shallow water
Ocean currents flow in complex patterns affected by wind, water salinity, temperature, topography of the ocean floor, and the earth’s rotation. Most ocean currents are driven by wind and solar heating of surface waters near the equator, while some currents result from density and salinity variations of the water column. Ocean currents are relatively constant and flow in one direction, in contrast to tidal currents along the shore.
While ocean currents move slowly relative to typical wind speeds, they carry a great deal of energy due to the density of water, which is more than 800 times denser than air. Because of this physical property, ocean currents, and especially tidal currents, contain an enormous amount of energy that can be captured and converted to a usable form. From the other side, the tidal action is one of the most important impact factors in a coastal area, while the horizontal scale of a tidal current is much greater than its vertical scale.
The Persian Gulf, is an important economic and political region owing to its oil and gas resources and is one of the busiest waterways in the world. Countries, bordering the Persian Gulf, are the United Arab Emirates, Saudi Arabia, Qatar, Bahrain, Kuwait and Iraq on one side and Iran on the other side (Figure 1).
The Persian Gulf is ∼990 km long and has a maximum width of 370 km, with the average depth 36 m, which occupies a surface area of ∼239 000 km2.
This Gulf is a semi-enclosed, marginal sea that is exposed to arid, sub-tropical climate, while has an oscillation period between 21.6 and 27 h for tidal waves (from estimates by Defant [1]). In practice, semidiurnal and diurnal waves generate resonant interactions in the basin, which lead to a system of amphidromic points of Kelvin-Taylor type. There are many researches which have analyzed the tidal currents of Persian Gulf [2-5]. Among them can mention Robert-Evans [6] who summarized early research concerning tidal analysis with the daily flow characteristics of the tidal currents in the central part of the Persian Gulf, where has higher daily tidal fluctuations as compared with the other part of the Persian Gulf. Lardner et al. [7] presented a model with the monthly mean wind-induced drift and density gradient for the Persian Gulf ground level.
In another study, Jochen and Sadrinasab [8] studied the circulation and water mass properties of the Persian Gulf, based on a three-dimensional hydrodynamic model (COHERENS) in a fully prognostic mode. They found that the Persian Gulf experiences a distinct seasonal cycle in which a gulf wide cyclonic overturning circulation establishes in spring and summer, but this disintegrates into meso-scale eddies in autumn and winter.
In a more recent study, used a homogeneous shallow-water model with free surface to model the tidal circulation in the Persian Gulf. The numerical finite-difference model coupled with a high precision bathymetric data to obtain the bottom topography. According to their results the model accurately reproduced the tidal phase and amplitude observed at 42 tidal gauges in the region, while the sea-surface elevation forecast by the model was in close agreement with in-situ measurements of pressure in the Straits, performed during the GOGP99 experiment.
In this study, a nonlinear model for analyzing the tidal currents water by the shallow western north coast of the Persian Gulf has been provided. The aim of the present study is the determination of the direction and magnitude of the tidal currents in order to obtain the sedimentation, the path of oil pollution, the coastal erosion, marine transportation and coastal structural design.
In providing a mechanistic description of the tidal model in Shadow Ocean, it is often useful to measure the material or momentum transfer through a surface. We are particularly interested in the tidal modeling through three dimensional flow behaviors, with the following general equation:
 (1)
(1)
In which ρ is the density, and  represents the forces due to pressure changes and 2 Ω×U is the curiulis force. The gravity force is shown by
 , while
  present the friction forces. In our case study the following assumption, is considered.
 (2)
(2)
Where H is the water depth and L is the wavelength of the tidal wave.
Mass conservation is realized as the parcel volume and density change in complementary manners, where the volume of a fluid parcel changes according to the divergence of the velocity field. In regard to the incompressible flow of the water, the continuity equation will be as presented in equation 3:
 (3)
(3)
In terms of dimensional analysis, the relation in Eq. 3 can be concluded that:
 (4)
(4)
Based on the equation of (4) and (2), the following equation is concluded:
w <
Another assumption that shall be considered is the low amplitude of the motion. This condition is shown in equation 6:
or  (6)
(6)
Here, η0 is the amplitude, and H0 is the average depth of the sea level. The effect of the friction is considered as  , in which τs is the stress due to the wind and τbis related to the sea bed one, so that we can have:
 (7)
(7)
 (8)
(8)
Here  is the traction coefficient and h is the laminar depth of the water, which considered equal to H0. Expanding the governing equations, can be represented in the following forms:
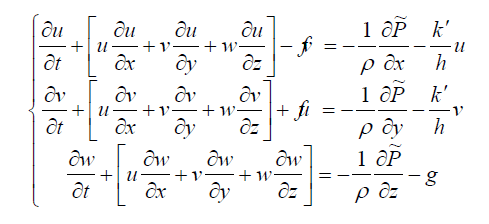 (9)
(9)
For the pressure gradient, where is in the form of p (x, y, z, t), and since h=H0+η, they can be written as:
 (10)
(10)
 (11)
(11)
And consequently the governing equations will be as follows:
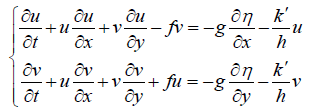 (12)
(12)
In regard to the small amplitude (η0 < H0), the below equation is assumed:
 (13)
(13)
Thus the final equations are obtained as follows:
 (14)
(14)
By defining of x operator in the form of  , the above equations simplify be the below equations:
 (15)
(15)
If U and V are considered as U=H0 and, then we can write the below equations:
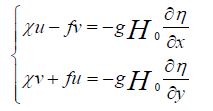 (16)
(16)
Using a continuity equation, we have:
 (17)
(17)
After performing mathematical operations on (I) and (II) the below equations are obtained:
 (18)
(18)
 (19)
(19)
Each component of the wave is considered to be  , that
 is the vector wave number. Coupling the above equations leads to follows:
 (20)
(20)
Due to the shape of the oscillating wave, which depends on the time; the below equations are obtained for the speed:
 (21)
(21)
 (22)
(22)
According to the above equations, the components of the tidal current can be calculated as follows equations:
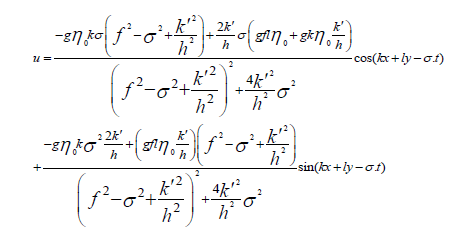 (23)
(23)
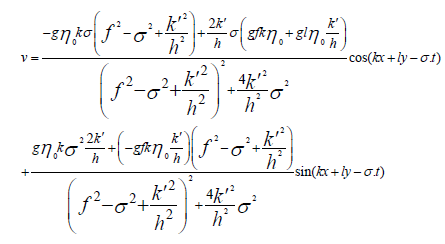 (24)
(24)
Since it’s difficult to calculate the components of the wave number vectors, the value of the parallel component of the diffusion velocity (u1 ) and the value in the perpendicular direction (u⊥ ) will be more useful, which are calculated by the following equations:
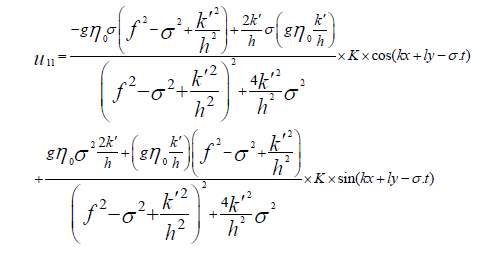 (25)
(25)
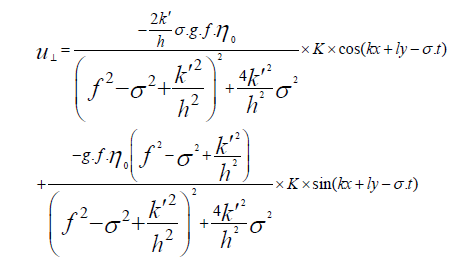 (26)
(26)
The tidal current model, can be expressed as follows:
 (27)
(27)
To determine the accuracy of the modeling based on the given governing equation, the output of the model has been compared and checked with the existing data from two stages; at first, the tidal currents in Asaluyeh region measured and compared with the field data and at the second, the same procedure has been done for Khure_musaregion.
Programming model was executed in this way that: At first, an application is modeling from accessible orders in the Admiralty tidal charts, and then interpolated the coefficients of the node and the astronomical characteristics belongs to each component for the region. Then, by using of the explained contents, the other application being model that results the velocity and tidal current. In addition to the file of the first part, the data about the beginning and the end of the modeling period (day, month and year) is considered as the input for the model. Longitude and latitude of the studied station, as well as the depth of the station and distance of the flow meter to the sea level, the amplitude of each component and Greenwich lag phase have been considered as the inputs. The tidal characteristics in each station are got from the same tidal diagrams (Table 1).
| Phase delay GMT | Amplitude (m) | Tidal current component |
|---|---|---|
| 147.86 | 0.5 | Component M2 |
| 196 | 0.15 | Component S2 |
| 201.56 | 0.2 | Component K1 |
| 178 | 0.1 | Component O1 |
Table 1: Asaloyeh’s station tide’s features.
This chart has gotten based on field measurements, Fourier analysis and drawing from the tide lines. The intended values, are calculated by interpolating of each specified distance. The depth of the station is gotten from the same method, from the hydrographic plan of the Persian Gulf’s, Khure_musa’s region. Since the governing equations is for low Amplitude waves in shallow water, in the first step, the output values are compared with field values in Asaluyeh region. Thus field values in Asaluyeh region may be appropriated for comparing with the results of the modeling. Geographic Profile in Asaluyeh station and tidal property in the region are input for model that is as follows.
After running the program, results are obtained as presented in Table 2.
| Error percentage | Average of field amounts | Average of field amounts (the present article) |
|---|---|---|
| 2.4 | 0.1617 | 0.1578 |
Table 2: Comparison the average amounts of modelled flow with the average of field amounts in 2005/1/25 in Asaloyeh.
From the comparison of the above table that physical parameters like wind pressure, the flow, density and seabed topography changes, the values of field flow’s velocity on upper layers have some errors from the field values in addition there is more topography affection on flow. Generally we can see that using program has enough accuracy to modeling tidal flows (Table 3).
| Season | The average size of obtained velocity |
|---|---|
| winter | 0.36 |
| spring | 0.32 |
| summer | 0.27 |
| autumn | 0.29 |
Table 3: Comparison of results of modeled tidal flows in 2009 (Khurmusa Station) (Asaluyeh’s Station).
First we use the data of khurmusa’s station as the input of the program and then after the performance, the amount of flow’s velocity and the dominant direction has been obtained in different hours for different stations that because of the abundance of obtained tables we separated them seasonally and the average, the highest and the lowest amount of velocity and also the average, the highest and the lowest direction of velocity has been obtained for four seasons in 2009 that after averaging in every season obtained amount of velocity will be homologized with the Table 4.
| Season | The average size obtained velocity |
|---|---|
| winter | 0.37 |
| spring | 0.42 |
| summer | 0.32 |
| autumn | 0.35 |
Table 4: Comparison of results of modeled tidal flows in 2009 (Khurmusa Station).
In addition to the above table, it points that the highest amount of velocity between seasons belongs to spring with the obtained average amount of 0.42 m/s and the lowest amount of velocity belongs to summer with the obtained average amount of 0.032 m/s. At this stage we have considered a random station to investigate. Geographic specifications of a random khurmusa’s station are:
For modeling the seabed of Khurmusa and Persian Gulf with having the depth of water in different areas we can create a picture from seabed topography by the Surfer software that in Figure 2 the topography has been shown by the existing data in the area of the Persian Gulf that Khurmusa is located in it (Table 5).
| Phase delay GMT | Amplitude (m) | Tidal current component |
|---|---|---|
| 332 | 0.664 | Component M2 |
| 13 | 0.238 | Component S2 |
| 258 | 0.294 | Component K1 |
| 305 | 0.457 | Component O1 |
Table 5: Khurmusa’s station tide’s features.
With running program, flow for seasons that are modeled in the Khurmusa’s station has been shown in Table 6.
| Hours | Flow’s direction modeled amounts for khurmusa’s station | Flow’s modeled amounts for khurmusa’s station | ||||||
|---|---|---|---|---|---|---|---|---|
| Spring | Summer | Autumn | Winter | Spring | Summer | Autumn | Winter | |
| 0 | 0.016 | 0.01 | 0.002 | 0.04 | 181.06462 | 181.12481 | 179.90668 | 181.03279 |
| 1 | 0.1 | 0.423 | 0.287 | 0.153 | 181.68727 | 181.62082 | 180.63028 | 181.69982 |
| 2 | 0.234 | 0.662 | 0.376 | 0.317 | 183.17151 | 183.23037 | 181.06284 | 184.36900 |
| 3 | 0.333 | 0.723 | 0.458 | 0.578 | 353.02256 | 272.06865 | 181.42356 | 355.13886 |
| 4 | 0.674 | 0.674 | 0.502 | 0.673 | 359.33899 | 359.05125 | 182.20488 | 359.68467 |
| 5 | 0.756 | 0.631 | 0.525 | 0.724 | 0.37395 | 0.32378 | 184.39171 | 0.67714 |
| 6 | 0.793 | 0.291 | 0.573 | 0.75 | 0.86438 | 0.84626 | 357.69622 | 1.31613 |
| 7 | 0.797 | 0.032 | 0.544 | 0.723 | 1.27775 | 1.24497 | 0.26925 | 2.24186 |
| 8 | 0.601 | 0.586 | 0.306 | 0.568 | 1.81826 | 2.07482 | 0.98741 | 12.54969 |
| 9 | 0.298 | 0.902 | 0.035 | 0.425 | 2.91897 | 2.79627 | 1.49767 | 178.71620 |
| 10 | 0.23 | 0.949 | 0.386 | 0.208 | 164.37934 | 90.12952 | 3.09594 | 179.99315 |
| 11 | 0.65 | 0.987 | 0.666 | 0.79 | 179.62582 | 179.40478 | 167.16631 | 180.65430 |
| 12 | 0.969 | 0.675 | 0.8 | 0.98 | 181.03106 | 180.59478 | 179.41679 | 181.09264 |
| 13 | 0.912 | 0.425 | 0.756 | 0.98 | 181.03106 | 181.19728 | 180.62258 | 181.56468 |
| 14 | 0.61 | 0.302 | 0.543 | 0.975 | 181.48128 | 182.46886 | 181.30782 | 183.02788 |
| 15 | 0.23 | 0.025 | 0.213 | 0.897 | 181.95887 | 182.88771 | 181.98692 | 195.84620 |
| 16 | 0.181 | 0.369 | 0.153 | 0.693 | 190.52221 | 349.20063 | 195.12995 | 356.75920 |
| 17 | 0.502 | 0.569 | 0.469 | 0.201 | 358.03359 | 359.99509 | 358.90354 | 0.25416 |
| 18 | 0.646 | 0.743 | 0.66 | 0.319 | 0.32197 | 0.89099 | 358.68403 | 0.80466 |
| 19 | 0.567 | 0.784 | 0.686 | 0.468 | 1.09622 | 1.62084 | 0.67703 | 1.20882 |
| 20 | 0.283 | 0.691 | 0.548 | 0.67 | 1.86507 | 4.47044 | 1.10890 | 2.02659 |
| 21 | 0.136 | 0.572 | 0.392 | 0.669 | 3.58153 | 173.62426 | 1.52779 | 2.64993 |
| 22 | 0.056 | 0.471 | 0.274 | 0.472 | 177.78807 | 179.85999 | 2.68223 | 36.71043 |
| 23 | 0.037 | 0.262 | 0.054 | 0.27 | 179.84845 | 180.35166 | 31.10451 | 179.21660 |
Table 6: The modeled flow values for Khuremusa’s station.
Considering that a harmonic force causes the tide, we expect that changes of the water level and also the changes of water’s flow velocity in the khurmusa’s station have coordinate changes that is clearly seen in the next diagram (Figure 3).
As shown the flow vector at this station for the most of the day are aligned with the East West axis. For modeling the tidal flow in Khurmusa and Asaluyeh some stations are mentioned with the distance of 2.5 kilometers and then the specifications of these stations(longitude and latitude, depth, range of tidal components and delay phase of the components) were given to the program as the input data (Figure 4), the program was implemented for a given time. The output data has been drawn by the Surfer program as a field vector. These results are presented in the Figure 5.
The modeled values and flow’s vector field diagram both show that the stronger flows are related to the shallow areas.
From Comparing the results of modeled program with field amounts and theories it can be concluded that modeled values on the surface of water, shows good results in every region, and seasonal modeling in the Khurmosa shows that the highest tidal flow velocity is in the spring with the average of 0.42 m/s and the lowest flow velocity is in the summer with the average of 0.32 m/s and also seasonal modeling in Asaloyeh shows that the highest tidal flow velocity is in the winter with the average of 0.36 m/s and the lowest flow velocity is in the summer with the average of 0.27 m/s, also tidal flow direction, shows counterclockwise circulation flow in the Persian gulf. According to the drawn diagrams, the direction of tidal flow in the coastal edges, has a special scattering that comes from the seabed friction, little depth in the area and the seabed’s uneven topography.