
Immunotherapy: Open Access
Open Access
ISSN: 2471-9552

ISSN: 2471-9552
Research Article - (2022)Volume 8, Issue 3
Object: This study is to identify Small Cell Lung Cancer (SCLC) driver genes, annotate enrichment functions and key pathways, and also verify Monastrol therapeutic effect.
Methods: The gene expression profiles of GSE40275 and GSE43346 was analyzed to identify the DEGs (Differentially Expressed Genes) between SCLC and the normal tissue. GO (Gene Ontology), KEGG (Kyoto Encyclopedia of Genes and Genomes) analysis and PPI (Protein-Protein Interaction) network analysis were conducted to find out the enrichment functions, pathways and hub genes. Moreover, in vitro, MTT assay, colony-forming assay, and the scratch assay were performed to verify the effect of Monastrol.
Results: There were common 129 up-regulated and 176 down-regulated DEG’s between SCLC samples and normal lung samples. KIF11, NDC80, and PBK were identified as hub genes after PPI network analysis. The q-PCR results showed that genes KIF11, NDC80 and PBK consistently expressed higher in cancer cells than in normal cell lines. An invitro assay showed that Monastrol inhibited SCLC cellular viability, proliferation and migration (P<0.01).
Conclusion: KIF11, NDC80 and PBK were aberrantly expressed and could be potentially applied as diagnostic biomarkers, therapeutic targets and prognostic biomarkers. Monastrol was a promising drug in the treatment of SCLC patients.
Bioinformatics; Lung science; SCLC; Monastrol
Lung cancer, one of the leading causes of cancer-related deaths worldwide, is the most common type of cancer in men and the fourth most common in women [1]. Small Cell Lung Cancer (SCLC) with a high degree of malignancy and high mortality is account for about 13%-20% of all lung cancer cases. In developed countries such as the United States, SCLC is estimated to represent about 16% of new lung cancer diagnoses, which means that about 35,000 new cases occur annually [2]. In under developed countries, the percentage of SCLC cases is higher. More than 130,000 new diagnoses of SCLC and 100,000 deaths from this disease were estimated to have occurred in China in 2013 Small cell cancer is highly aggressive [3]. This kind of tumor cell is characterized by rapid doubling time and is not suitable for traditional surgical therapy but is sensitive to both chemotherapy and radiation. Unfortunately, these conventional treatment methods are both short and not curative in most cases with an average 5-year survival rate below 7%. No major treatment advances have occurred over the past 30 years [4]. In patients with the extensive-stage disease, chemotherapy alone can palliate symptoms and prolong survival in most patients; however, long-term survival is rare [5]. The management of SCLC is still a very challenging cause of disease outcome has remained stubbornly poor due mainly to limited options for effective treatment. Although according to some preclinical studies about the understanding of SCLC, the c-kit inhibitor and other agents targeting angiogenesis could show inhibition on it, the results of the actual use were somewhat disappointing and unexpected. Meanwhile, there is no clear expatriation of the neoplastic processes of SCLC [6]. In this way, conducting such a study that comprehensively depicts the molecular pathogenesis of SCLC development as well as identifies novel therapeutic agents is necessary and crucial. Monastrol, a potent and cell-permeable inhibitor targeted KIF11 with an IC50 value of 14 μM, which causes aberrant interactions with the microtubule, and reversals at the ATP hydrolysis step, might have anti-SCLC therapeutic effects [7].
The hallmarks of cancer are the most crucial to the development of SCLC, including genomic instability and mutations, evading growth suppressors, resisting cell deaths, sustaining proliferative signaling and enabling replicative immortality. The genomic instability of SCLC is higher than in most cancers. SCLC has a mutation rate of 5.6 to 7.4 mutations per Mb, and about 175 mutations per tumor. However, few specific driver genes have been proved related to SCLC pathogenesis. To further clarify the molecular pathogenesis of this tumor, our study also used bioinformatics methods combined with GO, KEGG analysis and PPI network analysis, employing mRNA microarray datasets to screen out the hub genes and key pathways associated with SCLC.
Microarray data
The gene expression profiles of GSE40275 and GSE43346 were collected from the GEO database (The Gene Expression Omibus, http://www.ncbi.nlm.nih.gov/geo). These profiles contained 40 SCLC samples and 44 normal samples totally.
Identification of DEGs
The analysis was conducted based on raw data using the software Gene spring (version 11.5, Aglient, USA). The category of the mRNA expression data was realized with hierarchical clustering analysis. The probe quality control in Gene spring was limited by Principal Component Analysis (PCA), and probes with intensity values below the 20th percentile were filtered out using the “filter probe sets by expression” option. Then, the DEG’s were identified using a classical t-test with a P-value cutoff of<0.05 and a change>2 fold, which was applied for statistically significant definition. At last, the Venn plot analysis regarding DEG’s was conducted (http://bioinformatics.psb.ugent.be/webtools/Venn/).
Gene ontology and pathway enrichment analysis of DEGs
The DAVID database (Database for Annotation, Visualization and Intergrated Discovery, http://david.abcc.ncifcrf.gov/), provided a comprehensive set of functional annotation tools to understand the biological meaning underlying plenty of genes. GO (Gene Ontology) was a useful method for analyzing biological processes, molecular function and cell components of genes and KEGG (Kyoto Encyclopedia of Genes and Genomes) was a base for gene function analysis and genomic information link. In this study, GO and KEGG pathway enrichment analyses were performed using DAVID for DEG’s functions analysis.
PPI network construction and modules selection
STRING (Search Tool for Retrieval of Interacting Genes, http://string.embl.de/) can provide PPI (Protein-Protein Interaction) analysis for bioinformatics studies. Then, the software Cytoscape was applied to screen hub genes and modules with MCODE (Molecular Complex Detection). Moreover, the function and pathway enrichment analysis of DEG’s in modules were performed.
Cell lines and reagents
Human normal pulmonary epithelial cells (BEAS-2B), human normal embryonic lung fibroblast cells (MRC5), human small cell lung cancer cells (H446) and human lung adenocarcinoma cells (A549) were purchased from the ATCC (American Type Culture Collection). Those cell lines were cultured in Dulbecco’s Modified Eagle’s Medium (DMEM, Hyclone, USA) supplemented with 10% fetal bovine serum (FBS, Gibco, USA). These cells were cultivated in 5% CO2 and 95% air at 37°C. And Monastrol, the small molecule inhibitor, was purchased from Apexbio Inc. (Apexbio, Houston, USA).
Real-time quantitative reverse transcription PCR
Aim to confirm the expression of hub genes in SCLC cell lines and normal human pneumonocytes, we performed qRT-PCR using FastStart Universal SYBR Green Master (ROX) (Roche Diagnostics) in a CFX96 Real-Time System (Bio-Red) according to the manufacturer’s instructions and expression levels were normalized to glyceraldehyde-3-phosphate dehydrogenase (GAPDH). The 2-△△Ct method was used for qRT-PCR data analysis.
MTT assay
The cancer cells (H446, A549) and normal cells (BEAS-2B, MRC5) were plated into 96-well culture plate with a density of 500 cells/well and were treated with different doses of Monastrol respectively. The MTT reagent (Sigma) was dissolved in PBS (5 mg/ ml) to measure the viability of cells. On the day of measurement, the medium was replaced with fresh DMEM supplemented with 10% FBS and diluted MTT (1:10, 10% MTT), and incubated for 3, 5 hours at 37°C. Then, the incubation medium was removed and formazan crystals were dissolved in a 200 μl solution of DMSO. The ELx800 absorbance microplate reader (BioTek Instruments, VT, USA) was applied to quantify the MTT reduction by measuring the light absorbance at 570 nm. Each test was repeated 3 times.
Colony-forming assay
The cancer cells (H446, A549) were cultured in Petri dishes with 50 cells/cm2. After 24 hours, those cells were treated with different doses of Monastrol respectively. After ten days in vitro growth, colonies were counted. Then, colonies were rinsed with PBS, fixed in 4% paraformaldehyde, stained with 5% crystal violet for half an hour, and rinsed twice with water.
In vitro scratch assay
The H446 and A549 cells were cultured on 24-well PermanoxTM plates. A 1 ml pipette tip across each well was used to create a consistent cell-free area. The loose cells were washed out gently using DMEM. Then, the cells were exposed to different doses of Monastrol. After the scratch and at 0, 12, 24 hours, the images of the scraped area were captured with phase-contrast microscopy. The remaining wounded area and the scratch width at six different points per image were measured.
Western blotting
The H446 and A549 cells were planted at a density of 2 105 cells per well in six-well plates and treated with different doses of Monastrol. Total proteins were extracted and electrophoretically separated after 48 hours. The proteins were transferred to membranes, which were subsequently incubated with secondary antibodies after being treated with primary antibodies against KIF11 and β-actin. The membranes were visualized with an enhanced chemiluminescence detection system (Pierce; Thermo Fisher Scientific, Inc.).
Statistical analysis
All statistic data were entered into SPSS 20.0 (SPSS Inc., Chicago, Illinois, USA) for analysis. Independent-samples t-test was conducted to analyze quantitive data. P values<0.05 were set as significance level.
Identification of DEGs and gene function analysis
The gene expression level of GSE40275 and GSE43346 were shown in the volcano plots (Figure 1A). Altogether 305 DEGs were picked up between normal and SCLC mRNA expression samples shown in the VENN plots (Figure 1B). The mutual DEGs were uploaded to DAVID respectively, to identify the further insight into those genes. The detailed results of GO and KEGG pathway analysis were shown in Table 1 and Figure 1C. The GO and KEGG analysis results revealed that the mutual up-regulated DEGs were mainly associated with cell division, nucleoplasm, protein binding, and Cell cycle. Meanwhile, for the mutual down-regulated DEG’s, the GO and KEGG analysis results primarily enriched in immune response, plasma membrane, scavenger receptor activity, and Complement and coagulation cascades.
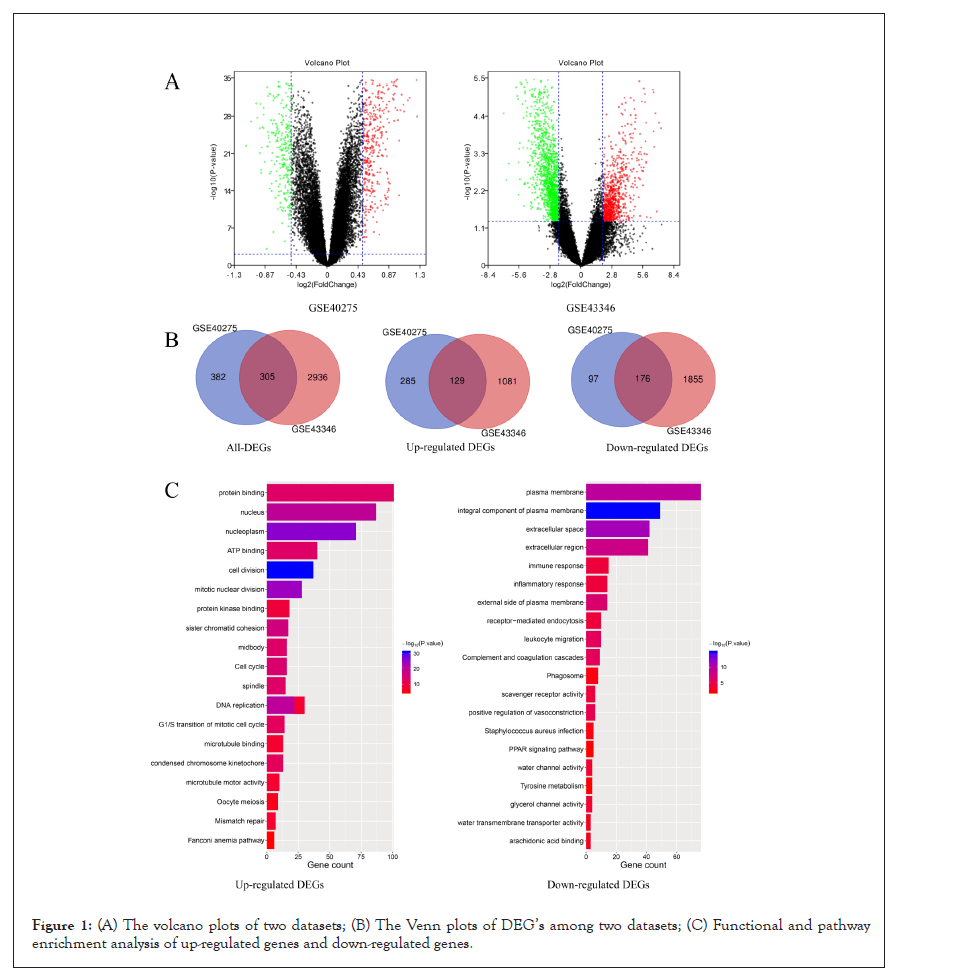
Figure 1: (A) The volcano plots of two datasets; (B) The Venn plots of DEG’s among two datasets; (C) Functional and pathway enrichment analysis of up-regulated genes and down-regulated genes.
| Gene symbol | Degree | Between ness | Gene symbol | Degree | Between ness |
|---|---|---|---|---|---|
| TOP2A | 112 | 0.11660323 | AURKA | 95 | 0.00363657 |
| BUB1 | 103 | 0.01249734 | MELK | 95 | 0.0102998 |
| CCNB1 | 103 | 0.01055831 | RFC4 | 94 | 0.0142881 |
| CCNA2 | 99 | 0.00526077 | PBK | 94 | 0.00957059 |
| KIF11 | 99 | 0.00331167 | BUB1B | 93 | 0.00216013 |
| NDC80 | 98 | 0.00388508 | CDKN3 | 93 | 0.03636562 |
| TTK | 98 | 0.00316118 | CDC6 | 92 | 0.0049405 |
| CHEK1 | 97 | 0.00509206 | CCNB2 | 92 | 0.00226211 |
| NCAPG | 96 | 0.00241139 | DTL | 92 | 0.00224199 |
| ASPM | 96 | 0.00537039 | RACGAP1 | 91 | 0.00170142 |
Table 1: Functional and pathway enrichment analysis of DEG’s in SCLC.
Module screening from the PPI network
All DEGs among these samples were analyzed with a PPI network, and the hub genes were screened with degrees>90 based on the STRING database. The top 20 genes were identified as hub genes listed in Table 2. And heat maps of these hub genes expressions were shown in Figure 2. Among those genes, the node degree of TOP2A was the highest one, and which degree were 112. Moreover, after MCODE analysis, the top 3 significant modules were obtained, showed in Figure 3. The functional annotation and enrichment of these modules were also performed, showed in Table 3. Enriched function analysis revealed that genes in module 1 were primarily related to protein binding, cell division and cell cycle. In modules 2-3, genes were mainly enriched in the inflammatory response, Chemokine signaling pathway, and cellular defense response.
| Functional and pathway enrichment analysis of DEGs in SCLC | |||||
|---|---|---|---|---|---|
| Expression | Category | Term | Count | % | P-value |
| Up-regulated | GOTERM_BP_DIRECT | GO:0051301~Cell division | 37 | 28.91 | 7.54E-32 |
| GOTERM_BP_DIRECT | GO:0007067~Mitotic nuclear division | 28 | 21.88 | 1.72E-24 | |
| GOTERM_BP_DIRECT | GO:0006260~DNA replication | 22 | 17.19 | 3.46E-21 | |
| GOTERM_BP_DIRECT | GO:0007062~Sister chromatid cohesion | 17 | 13.28 | 2.45E-17 | |
| GOTERM_BP_DIRECT | GO:0000082~G1/S transition of mitotic cell cycle | 14 | 10.94 | 3.99E-13 | |
| GOTERM_CC_DIRECT | GO:0005654~Nucleoplasm | 71 | 55.47 | 1.59E-26 | |
| GOTERM_CC_DIRECT | GO:0005634~Nucleus | 87 | 67.97 | 2.70E-20 | |
| GOTERM_CC_DIRECT | GO:0030496~Midbody | 16 | 12.5 | 8.93E-15 | |
| GOTERM_CC_DIRECT | GO:0005819~Spindle | 15 | 11.72 | 7.88E-14 | |
| GOTERM_CC_DIRECT | GO:0000777~Condensed chromosome kinetochore | 13 | 10.16 | 5.98E-13 | |
| GOTERM_MF_DIRECT | GO:0005515~Protein binding | 101 | 78.91 | 1.97E-14 | |
| GOTERM_MF_DIRECT | GO:0005524~ATP binding | 40 | 31.25 | 9.95E-14 | |
| GOTERM_MF_DIRECT | GO:0019901~Protein kinase binding | 18 | 14.06 | 8.97E-10 | |
| GOTERM_MF_DIRECT | GO:0003777~Microtubule motor activity | 10 | 7.81 | 4.15E-09 | |
| GOTERM_MF_DIRECT | GO:0008017~Microtubule binding | 13 | 10.16 | 2.20E-08 | |
| KEGG_PATHWAY | hsa04110: Cell cycle | 16 | 12.5 | 9.02E-16 | |
| KEGG_PATHWAY | hsa03030: DNA replication | 8 | 6.25 | 2.68E-09 | |
| KEGG_PATHWAY | hsa03430: Mismatch repair | 7 | 5.47 | 5.91E-09 | |
| KEGG_PATHWAY | hsa04114: Oocyte meiosis | 9 | 7.03 | 5.59E-07 | |
| KEGG_PATHWAY | hsa03460: Fanconi anemia pathway | 6 | 4.69 | 2.42E-05 | |
| Down-regulated | GOTERM_BP_DIRECT | GO:0050900~Leukocyte migration | 10 | 5.85 | 2.52E-06 |
| GOTERM_BP_DIRECT | GO:0045907~Positive regulation of vasoconstriction | 6 | 3.51 | 1.21E-05 | |
| GOTERM_BP_DIRECT | GO:0006955~Immune response | 15 | 8.77 | 5.17E-05 | |
| GOTERM_BP_DIRECT | GO:0006954~Inflammatory response | 14 | 8.19 | 7.07E-05 | |
| GOTERM_BP_DIRECT | GO:0006898~Receptor-mediated endocytosis | 10 | 5.85 | 7.42E-05 | |
| GOTERM_CC_DIRECT | GO:0005887~Integral component of plasma membrane | 49 | 28.65 | 1.26E-15 | |
| GOTERM_CC_DIRECT | GO:0005615~Extracellular space | 42 | 24.56 | 8.63E-12 | |
| GOTERM_CC_DIRECT | GO:0005886~Plasma membrane | 76 | 44.44 | 3.59E-10 | |
| GOTERM_CC_DIRECT | GO:0005576~Extracellular region | 41 | 23.98 | 6.74E-09 | |
| GOTERM_CC_DIRECT | GO:0009897~External side of plasma membrane | 14 | 8.19 | 1.04E-07 | |
| GOTERM_MF_DIRECT | GO:0005044~Scavenger receptor activity | 6 | 3.51 | 7.16E-05 | |
| GOTERM_MF_DIRECT | GO:0015254~Glycerol channel activity | 4 | 2.34 | 1.51E-04 | |
| GOTERM_MF_DIRECT | GO:0015250~Water channel activity | 4 | 2.34 | 3.75E-04 | |
| GOTERM_MF_DIRECT | GO:0050544~Arachidonic acid binding | 3 | 1.75 | 8.02E-04 | |
| GOTERM_MF_DIRECT | GO:0005372~Water trans membrane transporter activity | 3 | 1.75 | 0.0011953 | |
| KEGG_PATHWAY | hsa04610: Complement and coagulation cascades | 9 | 5.26 | 2.73E-06 | |
| KEGG_PATHWAY | hsa04145: Phagosome | 8 | 4.68 | 0.0033576 | |
| KEGG_PATHWAY | hsa05150: Staphylococcus aureus infection | 5 | 2.92 | 0.00526332 | |
| KEGG_PATHWAY | hsa00350: Tyrosine metabolism | 4 | 2.34 | 0.01047714 | |
| KEGG_PATHWAY | hsa03320: PPAR signaling pathway | 5 | 2.92 | 0.0112204 | |
Table 2: Top 20 hub genes which were screened with a degree of more than 90.
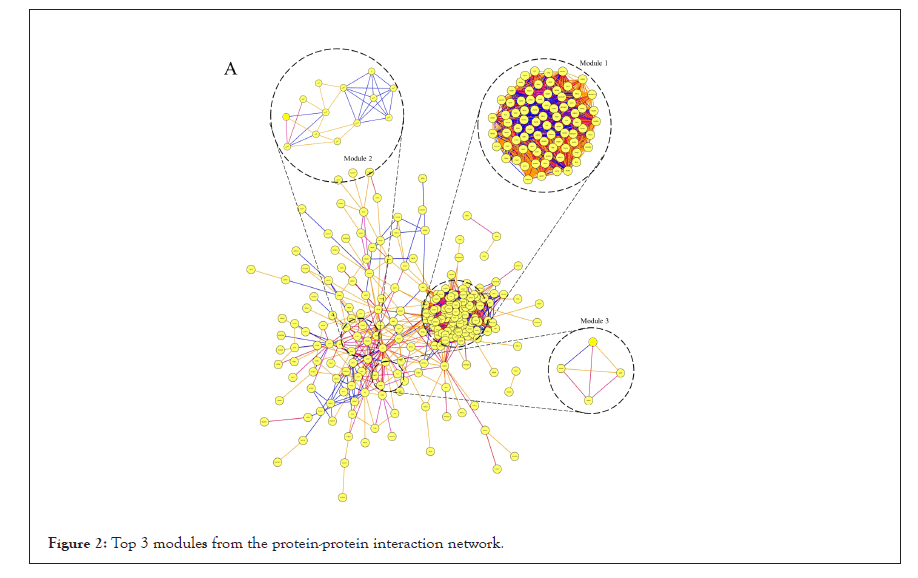
Figure 2: Top 3 modules from the protein-protein interaction network.
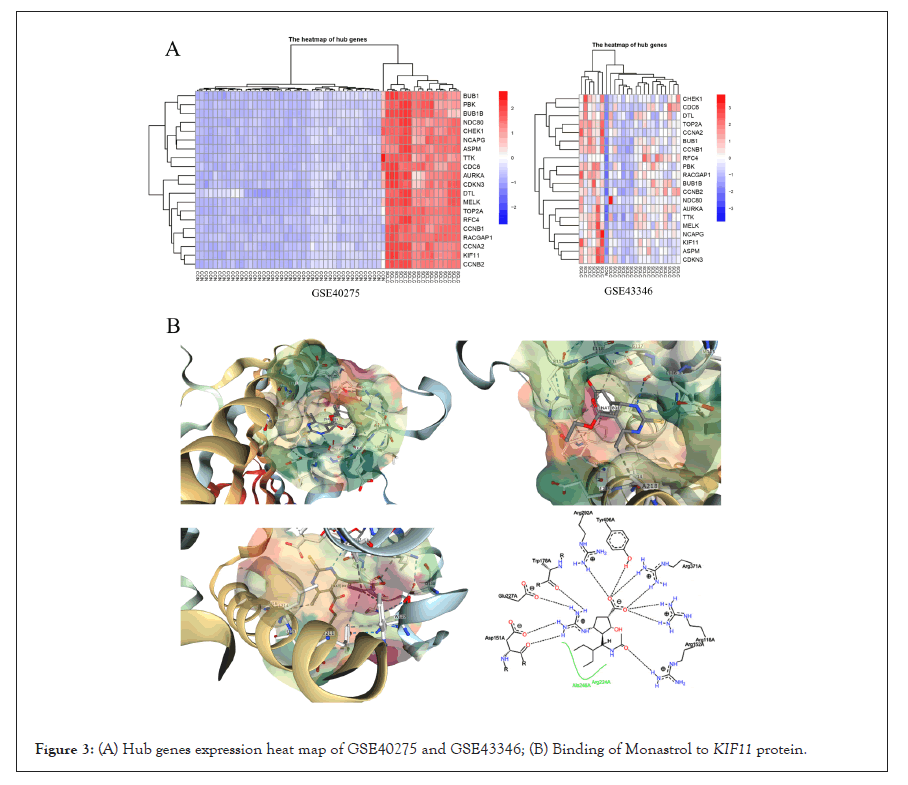
Figure 3: (A) Hub genes expression heat map of GSE40275 and GSE43346; (B) Binding of Monastrol to KIF11 protein.
| The functional annotation and enrichment of modules genes | |||||
|---|---|---|---|---|---|
| Module | Term | Count | P value | FDR | Genes |
| Module 1 | GO:0051301~Cell division | 74 | 6.45E-15 | 7.65E-12 | KIF23, STIL, PRC1, EZH2, KNTC1, TTK, AURKA, PTTG1, MCM10, KIF2C, CDCA8, TOP2A, CCNA2, CDCA5, KIF14, CDC6, DTL, KIF15, TPX2, NUSAP1, DEPDC1, MCM2, PBK, UBE2C, ECT2, MCM6, RFC5, RFC3, RFC4, SPAG5, RRM2, ZWINT, BUB1B, MELK, SHCBP1, KIF4A, BLM, NEK2, FOXM1, KIAA0101, CHEK1, CEP55, HMMR, SPC25, NCAPH, POLE2, NCAPG2, NCAPG, BUB1, FBXO5, ASF1B, POLQ, EXO1, RAD51AP1, MKI67, GMNN, KIF18A, NUF2, CENPF, NDC80, CENPE, CDC20, CDC25C, CENPK, RACGAP1, CDKN3, RAD54L, BRCA1, CCNB1, PLK4, CCNB2, PCNA, CKS2, KIF20A |
| 33 | 3.32E-15 | 2.00E-29 | NEK2, KNTC1, AURKA, PTTG1, SPC25, KIF2C, CDCA8, NCAPH, CDCA7, NCAPG2, NCAPG, CDCA2, BUB1, FBXO5, CCNA2, CDCA5, KIF14, CDC6, KIF11, TPX2, NUF2, CENPF, NDC80, CENPE, CDC20, CDC25C, UBE2C, CCNB1, CCNB2, SPAG5, ZWINT, CKS2, BUB1B | ||
| hsa04110: Cell cycle | 14 | 4.74E-15 | 3.87E-12 | CDC6, TTK, CDC20, CHEK1, PTTG1, MCM2, CDC25C, MCM6, CCNB1, CCNB2, PCNA, BUB1, BUB1B, CCNA2 | |
| Module 2 | GO:0006954~Inflammatory response | 6 | 3.97E-06 | 0.0054503 | C5AR1, OLR1, PTGS2, C3, CCL21, CXCL2 |
| GO:0005886~Plasma membrane | 8 | 8.01E-03 | 7.5487027 | CAV1, IL1R1, CD36, C5AR1, OLR1, C3, CXCL16, GNG11 | |
| hsa04062: Chemokine signaling pathway | 4 | 2.73E-03 | 2.697201 | CCL21, CXCL16, CXCL2, GNG11 | |
| Module 3 | GO:0006968~Cellular defense response | 2 | 1.10E-02 | 10.662027 | NCF2, MNDA |
Table 3: The functional annotation and enrichment of modules genes.
Validation of common hub genes by qRT-PCR
To validate the expression of KIF11, NDC80, PBK, and TOP2A in human normal lung cells (BEAS-2B, MRC5), human small cell lung cancer cells (H446), and human lung adenocarcinoma cells (A549), qRT-PCR was performed. The results shown in Figure 4A revealed among those cell lines that genes KIF11, NDC80, PBK, and TOP2A were consistently expressed higher in cancer cells than in normal cell lines (P<0.05).
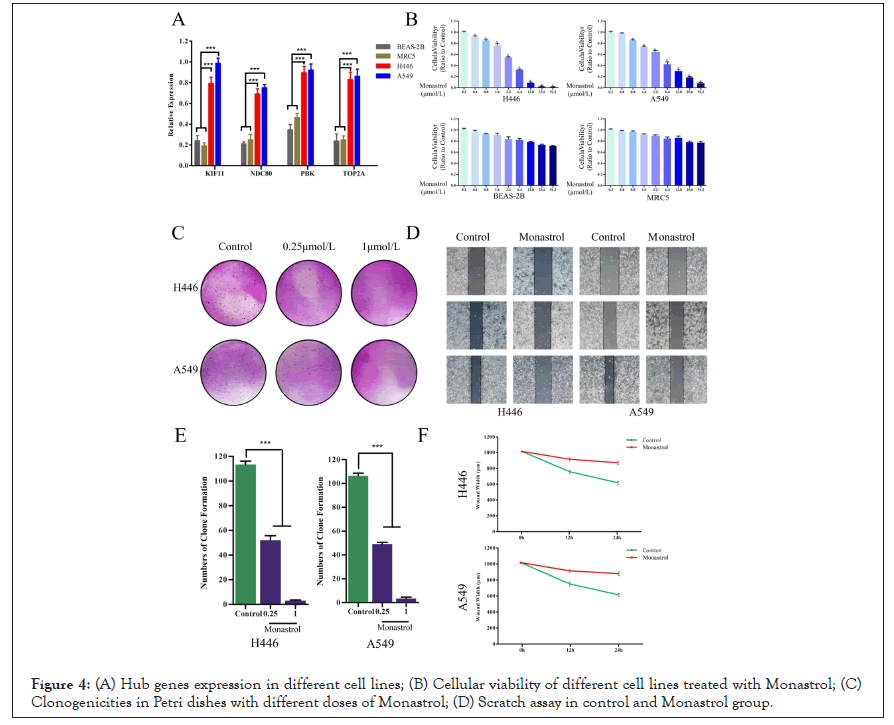
Figure 4: (A) Hub genes expression in different cell lines; (B) Cellular viability of different cell lines treated with Monastrol; (C) Clonogenicities in Petri dishes with different doses of Monastrol; (D) Scratch assay in control and Monastrol group.
Monastrol reduces the proliferation of SCLC cells
To evaluate the sensitivity of lung cancer cells to Monastrol, the survival cells after treatment were calculated by MTT assay. As shown in Figure 4B, following the augment of drug concentrations, the cellular viability (ratio to control) in cell lines H446 and A549 decreased significantly. However, BEAS-2B and MRC5 still had high cellular viability even subjected to the highest dose. Monastrol was relatively tolerated for normal lung cells lines. To determine the anti-cancer effects of Monastrol in SCLC cells, we performed a colony-forming assay. The results showed us that less and smaller clonogenicities in Petri dishes with Monastrol than that in the control group (Figure 4C). The percentage of clone formation in control was significantly higher than in drug groups (0.25 μmol/L, 1 μmol/L).
Monastrol inhibits the migration of SCLC cells
The widths of scratched areas were measured after the scratch, after 12 h, and after 24 h, to research the migration of SCLC cells. In Figure 4D, the width of the scratch was significantly smaller after 24 h in the control group. However, there was only a slight decrease in the Monastrol group. In addition, after 24 h, the wounds in the control group were also smaller than in the drug group significantly. Monastrol reduces KIF11 expression in SCLC cells.
Monastrol suppresses the expression of KIF11 in SCLC cells
We used Western blotting to confirm that the effects of Monastrol were caused by its suppression of KIF11 in SCLC cells. The expression of KIF11 reduced as Monastrol concentrations increased, according to Western blotting (Figures 5A and 5B). These data suggested that Monastrol inhibits KIF11 and thereby promotes apoptosis in SCLC cells.
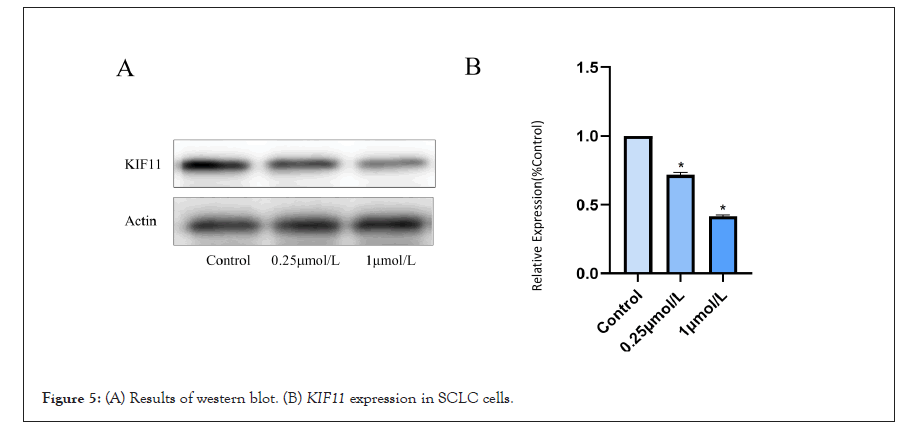
Figure 5: (A) Results of western blot. (B) KIF11 expression in SCLC cells.
SCLC is often diagnosed in an advanced stage, which is a highly aggressive malignancy associated with early metastasis, rapid progression, and poor survival. First-line chemotherapy provides good response rates in advanced disease, but SCLC often relapses, progression-free and overall survival is limited. Few related genes and molecular pathways have been studied by previous researchers, there is an urgent need for comprehensive analysis regarding SCLC [8,9]. And clinical diagnosis, treatment, and prognosis would be significantly improved if the appropriate targets are identified. Our study used bioinformatics analysis techniques combined with a complicated and refined algorithm to identify key genes and pathways, which could provide potential targets for SCLC diagnosis and treatment. And screening anti-SCLC drugs based on targets to improve clinical treatment.
GSE40275 and GSE43346 datasets were downloaded, and then we screened normal tissues and SCLC tissues samples from them, also identified the DEG’s between normal tissues and SCLC tissues. Results showed that there were 305 DEGs, 129 up-regulated and 176 down-regulated. The functions and corresponding signaling pathways of DEG’s were investigated by GO and KEGG analysis. The cell division and sister chromatid cohesion biological process are up-regulated observably, at the same time, the ratios of nucleusrelated components are up-regulated obviously. These changes may favor the preparation for DNA replication and promote the self-duplication of SCLC cells. The infinite proliferation of tumor cells is actually the abnormality of cell division and might be the result of Insensitivity to Antigrowth Signals. The signal pathway of Oocyte meiosis abnormal activation suggests that there is a difference in the incidence of SCLC between men and women. Meanwhile, the formation of neovascularization is closely related to the development of tumors, Fanconi anemia pathway exceeding activation plays an important role in the occurrence and development of SCLC. The positive regulation of vasoconstriction is down-regulated, and the continuous supply of blood flow is related to the need for adequate blood supply for the growth of tumor tissue. The changes in extracellular membrane components regulate the recognition and signal transmission between tumor cells and promote the migration of tumor cells at the same time. At the same time, the scavenger receptor activity is suppressed which may cause the body unable to recognize and remove abnormal cells, leading to carcinogenesis, and then SCLC occurs. These results further explain the tumor formation mechanism of SCLC and also provide novel ideas for further study of SCLC in the future.
PPI network of DEG’s was constructed using the STRING database and Cytocape. Three hub genes (KIF11, NDC80, and PBK) were identified as driver genes closely related to SCLC development and they had never been reported related to SCLC in previous studies. KIF11, kinesin family member 11, located in Chr10q23.33, encodes a motor protein that is known to be involved in spindle assembly, control of mitotic spindle structure, and chromosome behavior during mitosis [10,11]. The function of this protein includes chromosome positioning, centrosome separation, and establishing a bipolar spindle during cell mitosis. Kinesin motor domains couple cycles of ATP hydrolysis to cycles of microtubule binding and conformational changes that result in directional force and movement on microtubules [12]. Meanwhile, KIF11 dephosphorylation can lead to a mitotic exit, and the expression level of this gene is low in normal lung tissue [13,14]. In SCLC cells, overexpression of this gene may lead to a rise in phosphorylated Erk1/2 levels, and promote bipolar spindle assembly and chromosome segregation [15-17]. And this gene also plays a role in DNA repair, gives assistance for some protein transport from the trans-Golgi network to the cell surface, and contributes to mitotic spindle checkpoint activation and Tat-mediated apoptosis in CD4- positive T-lymphocytes, which may boost the progress of small cell lung cancer development. Given these circumstances, KIF11 might be a potential microtubule-related target for proliferating SCLC cells [18-21]. It prompted us to hypothesize that Monastrol, a potent and cell-permeable inhibitor that targeted KIF11 with an IC50 value of 14 μM, which causes aberrant interactions with the microtubule, and reversals at the ATP hydrolysis step, might have anti-SCLC therapeutic effects [22-24]. And it had also been verified by the following assays in this study. The drug in protein binding structure 1X88 was downloaded in the PDB dataset (Protein Data Bank, http://www.rcsb.org/), and shown in Figure 3B.
NDC80, kinetochore complex component, located in Chr18p11.32, encoded protein consists of an N-terminal microtubule-binding domain and a C-terminal coiled-coiled domain that interacts with other components of NDC80 kinetochore complex, which directly modulates microtubule dynamics [25]. This protein functions to organize and stabilize microtubule-kinetochore interactions and is required for proper chromosome segregation. Aurora A kinase phosphorylates NDC80 to regulate metaphase kinetochoremicrotubule dynamics [26] and Aurora B-NDC80-Mps1 signaling axis is governing accurate chromosome segregation in mitosis [27]. Overproduction of NDC80 in cancer cells unfavorably absorbs protein interactors through the internal loop domain and leads to a change in the equilibrium of microtubule-associated proteins [28]. NDC80's interaction with either growing or shrinking microtubule ends such as differentially regulating mammalian kinetochore coupling to polymerizing and depolymerizing microtubules can be tuned by the phosphorylation state of its tail [29,30]. N-terminusmodified NDC80 can suppress tumor growth by interfering with kinetochore-microtubule dynamics [31]. Our study showed that this gene, which was the core of the interaction with multiple genes, had a pivotal position in SCLC tissues. The expression of this gene was abnormally regulated because NDC80 was a driver gene of SCLC, we hypothesized its abnormal activation would promote the initiation of SCLC, it might play an important role during SCLC development and it might be a biomarker in the early diagnosis of SCLC. Accordingly, NDC80 could be considered an important therapeutic target for SCLC.
PBK, PDZ binding kinase, this gene locates at Chr8p21.1 and encodes a serine/threonine protein kinase related to the dual specific Mitogen-Activated Protein Kinase (MAPK) family. This kinase can increase the rate of mitosis and expands malignant T cells [32]. FoxM1-regulated PBK exerts oncogenic activities via the activation of the beta-Catenin pathway [33]. CDK1-mediated mitotic phosphorylation of PBK is involved in cytokinesis and inhibits its oncogenic activity [34]. PBK promotes lung cancer resistance to EGFR tyrosine kinase inhibitors by phosphorylating and activating c-Jun [35]. PBK mediates promyelocyte proliferation via Nrf2-regulated cell cycle progression and apoptosis [36]. TOPK/ PBK promotes cell migration via modulation of the PI3K/PTEN/ AKT pathway and is associated with poor prognosis in lung cancer [37]. Increased levels of PBK may contribute to tumor cell development and progression through suppression of p53 function and consequent reductions in the cell-cycle regulatory proteins such as p21 [38]. PBK augments tumor cell growth following a transient appearance in different types of progenitor cells in vivo as reported [39]. Overexpression of this gene has been implicated in tumorigenesis. Over expression of PBK contributes to tumor development and poor outcome of SCLC [40]. PBK might play a pivotal role in SCLC invasion and metastasis [41]. Our research confirms that the expression of this gene was abnormal regulated and it is a core driver gene of SCLC.
The effects of Monastrol were evaluated in the present study with MTT assay, colony-forming assay, and scratch assay in vitro. In MTT assay, the cellular viability (ratio to control) in H446 and A549 cell lines was revealed dose-depended decreased when treated with Monastrol. In the colony-forming assay, the numbers and size of clonogenicities in the Monastrol group were significantly less than in the control group, which was consistent with the results that Monastrol can reduce the proliferation of SCLC cells. In scratch assay, the wound widths in the control group decreased sharply along with time and were smaller than that in Monastrol group after 48 h significantly. That implied that Monastrol strongly inhibited the migration of SCLC cells. All these results suggest that Monastrol has the potential effect on treating SCLC, which is worthy of further study.
Our study screened out the DEG’s and key pathways in SCLC. The DEG’s identified in this study provided comprehensive insight into the molecular mechanism of SCLC pathogenesis. Three hub genes: KIF11, NDC80, and PBK were aberrantly expressed and could be potentially applied as diagnostic biomarkers, therapeutic targets, and prognostic biomarkers. Meanwhile, Monastrol, a potent inhibitor of KIF11, suppressed the proliferation and migration of SCLC cells and was a promising drug in the treatment of SCLC patients.
We thank the foundation of the Henan Medical Science and Technology Public Relations Project (LHGJ202105534) of the First People's Hospital of Xinxiang for financial support of this work.
Citation: Lv X, Wang X, Zhou P, Jiang S, Zhou B, Xie H, et al. (2022) Monastrol Targeted KIF11 Showed Potential Treatment Effective of Small Cell Lung Cancer. Immunotherapy. 8:195.
Received: 02-May-2022, Manuscript No. IMT-22-17620; Editor assigned: 05-May-2022, Pre QC No. IMT-22-17620 (PQ); Reviewed: 20-May-2022, QC No. IMT-22-17620; Revised: 26-May-2022, Manuscript No. IMT-22-17620 (R); Published: 06-Jun-2022 , DOI: 10.35248/2471-9552.22.8.195
Copyright: © 2022 Lv X, et al. This is an open-access article distributed under the terms of the Creative Commons Attribution License, which permits unrestricted use, distribution, and reproduction in any medium, provided the original author and source are credited.