Journal of Drug Metabolism & Toxicology
Open Access
ISSN: 2157-7609
ISSN: 2157-7609
Research Article - (2021)Volume 12, Issue 3
The objective of this research was to develop the phenytoin loaded bionanosuspension by using the novel biopolymer from Juglans regia. The different ratio of phenytoin and biopolymer (1:0.8, 1:1,1:2,1:3,1:4,1:5,1:8) were taken for preparation of formulations PJ1-PJ7. The bionanosuspension were evaluated for spread ability test, pH% entrapment efficacy, bio nanoparticles size in bionanosuspension, zeta potential, stability study and in-vitro drug release study. The formulation PJ2 with 1:1 drug biopolymer ratio was found to be best stable bionanosuspension on the basis of above evaluation parameters. The best formulation PJ2 showed the significant satisfactory results for different evaluations with t 50% of 18.09 hours and t 80% of 29.77 hours with r2 value of 0.9970. The best formulation PJ2 showed up to 86.56% ± 3 drug release in 36 hours. The bionanosuspension was found to be stable and safe for the delivery of Nano sized phenytoin using the isolated biopolymer having a unique stabilizer cum retardant property.
Bio polymer; Bio nanoparticles; Bio nanosuspension; Phenytoin; Epilepsy; Nano sizing; Juglans regia seed
Polymers are the boon in field of drug delivery systems. These have been proved as the backbone for drug delivery systems designing. These play a very important role in designing of novel drug delivery systems to overcome a number of complications in drug delivery system designing [1]. These are used for controlling the release of the drug in desired manner. The hydrophilic and lipophilic polymers are the first choice for getting the desired release in controlled, sustained, extended, pulsed, prolonged release at the desired sites. Apart of this, these synthetic and semisynthetic polymers are produced by a number of chemical reactions and purification processes. Since these are produced by a number of unit processes which are costly.
Now days a number of researches are under investigation for avoiding the environmental, physiological and economic issues associated with the synthetic and semisynthetic polymers. So an alternative to synthetic and semisynthetic polymers are under investigation having novelty, potentiality, and all other benefits with minimum adverse effects on environment and physiology of the human beings. One of the alternatives to synthetic and semisynthetic polymers is biopolymers [2] which have drawn the attention of researchers in designing of novel drug delivery design. Biopolymers are novel, intelligent and smart polymers which have been isolated from many natural sources [3].
The nanoparticles are one of the most preferred and advanced carrier systems [4] for the treatment of CNS disorders. Since nanoparticles [5] are can easily reach to brain after crossing the BBB and significant concentration of drug may be achieved for prolonged time. So the nanoparticles prepared by using novel isolated biopolymer are referred as bio nanoparticles as these are biocompatible and biodegradable with efficient drug targeting.
Now as the drug delivery system advancement phenytoin loaded bio-Nano suspension [6] may be one of the innovative novel drug delivery system.
Epilepsy is a neurological disorder [7] in which the brain activity becomes abnormal and shows the repeated, uncontrolled, and sudden changes in brain. In epilepsy [8,9] there are abnormal changes in electrical activity of brain. The epileptic episodes are called as convulsions. There are two types of seizures one is generalized seizure and other is partial seizure. The generalized seizure occurs in whole brain and the partial seizure occurs in any one part of the brain. The partial seizure can be converted in the generalized seizure. There are a number of factors and conditions which may cause the epilepsy after affecting the brain activity in abnormal way.
In this research work bionanosuspension [10] with the dispersed bio nanoparticles loaded with nanosized Phenytoin has been prepared by using the novel biomaterial from seeds of Juglans regia. The biopolymer was isolated from the seeds of Juglans regia. The isolated biopolymers [11] showed the significant result in physic-chemical characterization. It also showed the release of nanosized Phenytoin in sustained manner from the formulated bio nanoparticles in the form of bionanosuspension. In this way the isolated biopolymers [12] from the natural source like seeds of Juglans regia. So isolated biopolymer [13] from Juglans regia may be used as an alternative of available synthetic and semi synthetic polymers. This isolated biopolymer is biodegradable and biocompatible.
Chemicals and reagents
Phenytoin was obtained as a gift sample from Affy pharma private limited, Baddi. The Juglans regia (Akhroth seeds or kernels) was purchased from the market of Lucknow. All other chemicals used were of analytical grade.
Isolation of biopolymer from kernel
The Juglans regiaseeds were purchased from the local market of Lucknow. 200 gram of seed was weighed and soaked in double distilled water overnight. The swollen seeds were taken and their outer covering was removed. The uncovered seed was grinded in grinder as a paste. If necessary small quantity of distilled water (100 ml) was added during the grinding. This paste as a slurry was filtered through the muslin cloth. The collected filtrate was centrifuge at 5000 rpm for 10 minutes. After centrifugation the supernatant was taken. Centrifugation was done to remove any residue. Then half of the supernatant was treated with acetone in 1:1, 1:2 and 1:3 ratios. Another half of supernatant was treated with the methanol in the same ratios as acetone. Then these were place in refrigerator for overnight. Then after treatment these were centrifuged at 5000 rpm for 30 minutes. The supernatant was discarded and the biomaterial as a sediment collected and air dried. If any moisture is there can be dried in desiccators for 48 hours. If the biomaterial consists of any oil, can be removed by washing with acetone or chloroform. This procedure for isolation was optimized by repeating six times and then percentage yield was calculated. The obtained biomaterial was passed through sieve number 200 and stored for further use [14].
Yield of biomaterial
The isolated biopolymer was calculated for their %yield. This was calculated six times (n=6) with the help of digital balance (Labmann). This was calculated on the basis of weight of the isolated dried biopolymer powder obtained to the amount of the raw material used for extraction process ratio multiplied with 100. The total weight of isolated biopolymer was noted and %yield was calculated with standard deviation. The %yield was calculated by dividing weight of dried biopolymer powder with the weight of raw materials used and multiplied with 100.
Isolated biopolymer characterization
The physic-chemical properties of isolated biopolymer were characterized [15] for color, odor, taste and solubility. The chemical tests for presence of carbohydrate and proteins were also performed. The isolated biopolymer was also characterized for SEM analysis, DSC testing, FTIR spectroscopy, mass spectroscopy and NMR spectroscopy [16].
Physic-chemical characterization
The color, odor, texture of isolated biopolymer were physically evaluated. The color changing point was determined by using the melting point test apparatus. The isolated biopolymer was filled in the capillary tube and it was kept in melting point apparatus. The apparatus was switch on and observed for the temperature at which there was change in the color and melting of biopolymer starts. The temperature was observed with the help of thermometer. The organoleptic properties like Color, odor and taste were observed. The pH was determined for 1% aqueous solution with the help of digital pH meter (Cystronics). The tests were performed in triplicate (n=3).
Solubility of biomaterial
The solubility study of the isolated biopolymers was performed in different solvent systems like distilled water, methanol, diethyl ether and acetone, the excess of the isolated biopolymer was added in 10 ml of the specific solvent system in beaker gradually. The solution was dispersed well and kept for 24 hours on orbital shaker for achieving equilibrium state. Then the solution was centrifuged at 400 rpm in centrifuge for 10 minutes and then filtered to get the clear solution. Then the filtrate was allowed for measurement in double beam UV spectrophotometer machine (Mapada). The procedure was performed in triplicate for each isolated biopolymer.
Particle size analysis
This was performed by using optical microscopy method. The isolated biopolymer was taken on the glass slide and added 1 drop of glycerin. The cove slip was placed on the drop and examined with the help of calibrated eye piece micrometer under the optical microscope. During examination about 100 particles were counted and particle size distribution was determined. This was performed in triplicate and calculated with the help of formula.
Determination of rheological properties of biomaterial bulk density, tapped density and angle of repose
The bulk density of the isolated biopolymer was calculated by taking accurately pre-weighed biopolymer in measuring cylinder and then the bulk volume was measured. This was performed in triplicate. The tapped density of the isolated biopolymer was measured by taking a pre-weighed biopolymer in measuring cylinder and then tapped for 100 tapping. Then the tapped volume was determined. This was performed in triplicate. Then the tapped density was calculated. For determination of angle of repose funnel method was used. Accurately weighed powder material was taken in funnel. The height of funnel was adjusted so that it touches the tip of funnel just touches the apex of heap of blends. The blends were allowed to flow through funnel freely on the surface. This was performed in triplicate. The angle of repose was determined from the ratio of tan-1 of ratio of height of the pile and radius of pile. The obtained results were correlated.
Consolidation index
It is used for determination of flow properties. It is very simple, fast and widely used method for determining powder flow characteristics. This was performed in triplicate. This was calculated as the ratio of subtracted value of tapped and bulk density with tapped density. According to Carr’s index powder with 10% flow ability is considered as excellent flow characteristics. Powder with less than 15% flow ability is considered as powder with good flow characteristics and above reveals about poor flow property.
Chemical test for carbohydrate, proteins and reducing sugar
1 ml of biopolymer solution (5% biopolymer solution in distilled water) was taken in test tube. Add two drops of Molisch reagent. Add 1-2 ml of conc. Sulfuric acid in the test tube and observe for the formation of purple color at the interface of two layers.
Biuret test was performed for the confirmation of proteins. 2 ml of Juglans regia solution was taken in test tube (5% biopolymer solution in distilled water); add 1 ml of sodium hydroxide solution with addition of copper sulphate solution drops. The mixture was kept aside for five minutes and observe any color changes. The appearance of violet color confirms the presence of proteins.
The 2 ml of biopolymer solution (5% biopolymer solution in distilled water) was taken in test tube followed by addition of 1 ml each of Fehling's solution A and Fehling's solution B. The mixture was heated in water bath for few minutes in water bath and observes for precipitate. The brick red precipitate appearance after heating confirms the presence of reducing sugar in the isolated biopolymer.
Sem analysis
The isolated biopolymer was analyzed by scanning electron microscope. In SEM analysis the external surface and internal structure was characterized. The small quantity of biopolymer was taken and fixed on aluminum studs and the coated with gold with the help of coater sputter under vacuum. Then the SEM image was observed for the sample under test.
Spectrophotometric analysis
FTIR spectroscopy: The FTIR spectroscopy was done by preparing the KBr discs. 1 mg of isolated biopolymer was taken and mixed with 100 mg of dried and desiccated solid KBr (Potassium bromide). The mixture was mixed in mortar and pestle and placed in IR lamp to remove any moisture. The mixture was converted into disc by using the hydraulic pump under the pressure of 10 tons. The prepared KBr disc was placed in disc holder in the path of IR radiation. The spectrum was recorded into the range of 4000- 200 cm1.
DSC (Differential scanning calorimeter)
In DSC testing is the thermal analysis technique in which the heat flow into or out of the sample is determined as the function of temperature. Here the sample was taken and exposed to controlled temperature program. The glass transition temperature was determined. The heat flow range was 50-300 The DSC thermo gram was recorded.
Mass spectroscopy
This is the laboratory technique in which the sample of biopolymers was introduced in the through the inlet system. The gas phase ions of the compound were produced. Then molecular ion fragmentation, the ions separated in mass spectrometer according to their mass to charge ratio. A mass spectrum of ion abundance versus mass to charge ratio was obtained.
NMR spectroscopy
The NMR spectroscopy was done for spectral analysis of isolated biopolymer. The sample was dissolved in specific solvent like CDCl3. The mixture was pumped in the instrument at high rate flow. The valve switch was used to stop the flow. The measurement was performed. After the finishing of measurement the spectrum was processed and analyzed in automation computer.
Cytotoxicity evaluation of bio-polymer on neuroblastoma cell line
Cytotoxicity evaluation of isolated bio-polymer was done on Neuroblastoma cell line. The materials used are Cell line –SHSY-5Y, (human breast cancer cell line), Ham F-12 media, fetal bovine serum (FBS), and antibiotic-antimitotic solution from thermoscintific and MTT reagent from sigma Aldrich, USA. Tissue culture flask, six well micro-culture plates from Eppendorf, Germany. In methods maintenance of cell lines, sub culturing process of cell lines, trypsinization, and cryopreservation of cell lines was done. In MTT assay the formazan product is analyzed spectrophotometric ally (540 nm) after dissolution in DMSO, the spectra of treated and untreated cells giving an estimate of the extent of Cytotoxicity.
Nano sizing of phenytoin
500 mg of Phenytoin was taken and dissolved in 25 ml of methanol. The clear solution was sonicated for 15 cycles continuously. During sonication 25 ml of purified water as added slowly drop by drop till precipitation was observed. The obtained precipitate was allowed for centrifugation. After each sonication cycle the sample was allowed for absorbance and % transmittance (%T) and %blockage (100-% transmittance) measurement. The residue was recovered and then dried to collect the nanosized Phenytoin in nanoparticles range. This nanosized Phenytoin obtained by this standard solvent evaporation method, was evaluated for different parameters. The dried nanosized Phenytoin was packed and stored for further use. The Phenytoin was also nanosized by novel sonication method. Here 500 mg of Phenytoin was taken and mixed with dextrose and 25 ml double distilled water. This dispersed solution was sonicated for 15 cycles continuously. During sonication 25 ml of purified water as added slowly drop by drop till precipitation was observed. The obtained precipitate was allowed for centrifugation. After each sonication cycle the sample was allowed for absorbance and % transmittance (% T) and % blockage (100-% transmittance) measurement. The residue was recovered and then dried to collect the nanosized Phenytoin. The procedure was repeated in triplicate [17].
Drug-excipient interaction study
The drug-biopolymer interaction study was performed by the UV spectroscopy method. The In wet method the mixture of phenytoin and biopolymer in ratio of 1:1,1:3 and 3:1 was prepared and wetted with distilled water (1 ml) and then dried in oven at 50˚C for one hour to remove the water content. The dried mixture was treated with methanol in order to dissolve the phenytoin and further λmax was determined and repeated for three times. In dry method the three different ratio of drug-biopolymer in same as wet method was prepared and then treated with methanol in order to dissolve the phenytoin and further λmax was determined [18]. This was repeated for three times. λmax was compared before and after the test for any change.
Formulation of phenytoin loaded bionanosuspension
The formulations of bionanosuspension were prepared by using different drug–biopolymer ratio and drug-standard polymer ratio as given in Table 1. The bionanosuspension was prepared by sonication of the mixture of drug and biopolymer along with other excipients like polyvinyl alcohol as suspending agent, sodium benzoate as the preservative, purified water and dextrose as nanosizent. The Phenytoin, Juglans regia biopolymer and other excipients were accurately weighed and triturated with addition of the double distilled water. This mixture was sonicated for 3 cycles. Then 0.5 ml of 0.5% polyvinyl alcohol was added during sonication. The volume was made up to 10 ml with double distilled water having sodium benzoate 0.1-0.5%. Add dextrose if necessary as nanosizing agent and allowed for sonication for 15 cycles. After sonication the bionanosuspension was refrigerated for two days. If no settlement is there then it means the formulation is optimized. If settlement is there the 0.5 ml of 0.5% polyvinyl alcohol was again added and allowed for sonication for 10 cycles and refrigerated for 48 hours. The different formulations were prepared and after optimization according to stability the formulations PJ1-PJ7 were prepared. After formulation their stability was tested and then evaluated for different parameters including release study [19].
| Formulations | PJ1 | PJ2 | PJ3 | PJ4 | PJ5 | PJ6 | PJ7 |
|---|---|---|---|---|---|---|---|
| Drug : Biopolymer ratio | 01:00.8 | 01:01 | 01:02 | 01:03 | 01:04 | 01:05 | 01:08 |
| Phenytoin (mg) | 10 | 10 | 10 | 10 | 10 | 10 | 10 |
| Juglansregia (mg) | 8 | 10 | 20 | 30 | 40 | 50 | 80 |
| Sodium benzoate (%) | 0.5 | 0.5 | 0.5 | 0.5 | 0.5 | 0.5 | 0.5 |
| Polyvinyl alcohol (ml) | 0.5 | 0.5 | 0.5 | 0.5 | 0.5 | 0.5 | 0.5 |
| Double distilled water (ml) | 10 | 10 | 10 | 10 | 10 | 10 | 10 |
Table 1: Formulation of phenytoin loaded bionanosuspension using Juglans regia biopolymer.
Dispersibility of bionanosuspension: 20 mg of the formulated nanoparticles was taken and dispersed in 20 ml of the distilled water in a test tube. The time for settling of the dispersed nanoparticles in the bottom was noted and then again the nanoparticles was redispersed and noticed for the dispersion. After shaking any lump or aggregates or any precipitation formation was observed. The same procedure was followed for evaluation of dispersibility of bionanosuspension. The agglomeration or precipitation was observed for the formulated bionanosuspension during dispersibility testing. The procedure was repeated in triplicate and observed.
pH of bionanosuspension
The pH of formulated bionanosuspension was evaluated with digital pH meter. The study was done in triplicate and the mean was taken and checked that the pH of the nanosuspension is in required range or not. The pH study was measured in triplicate and average values were calculated.
% Entrapment efficacy
The %entrapment efficacy was determined for the formulated bionanosuspension. The freshly formulated bionanosuspension was taken and centrifuged at 2000 rpm in ultracentrifuge. After centrifugation the supernatant was taken and diluted and the amount of drug unincorporated was measured by determining the absorbance under UV spectroscopy at 216 nm. The amount of the drug entrapped in bio nanoparticles was calculated by subtracting the amount of free drug in supernatant from the initial amount of drug taken in formulation. This determination was done in triplicate and average was calculated.
Particle size screening of bionanosuspension by UV method
The bionanosuspension was evaluated by measuring the %transmittance of the bionanosuspension. The %transmittance was measured as a function of the particle size in nano range done by sonication method. The % transmittance depends on the particle size range at the particular range that defines the size particles are below range and size of the particles beyond the range required. The %transmittance was determined before and after the sonication cycle. The %transmittance at different wavelength indicates that when the light is passed through the particles means the particle size is below that wavelength which indicates that % of the particles is below 400 nm in the mixture and the %blockade shows that the % of particles is above 400 nm. The %transmittance was measured by using the UV spectrophotometer. After each sonication cycle the %transmittance was found to be increased due to reduction of the particles to Nano range. The effect of sonication on % transmittance was observed after sonication and measuring the % transmittance after each sonication cycle.
Particle size analysis
The particle size of the bionanosuspension was characterized with the Malvern zetasizer. The particle size distribution by intensity was confirmed by using the zetasizer. This is an important factor which should be considered for stability point of view. Zeta potential of the prepared bionanosuspension was also determined for characterizing stability of bionanosuspension also to evaluate any agglomeration.
In vitro release study
The in-vitro release study was performed for the all formulation. In-vitro release study was performed by novel static method by using modified M.S (Madhav-Shankar) Diffusion apparatus. It consists of two compartment one donor and one receiver compartment. The formulation for release study was taken in donor compartment (1 ml) and the end of the donor was tied with the egg biomembrane. This donor compartment was immersed in the receiver compartment having 13 ml of pH 7.4 phosphate buffer solution. Sampling was done at different specific time interval for 36 hours. The samples were withdrawn completely and replaced with the fresh phosphate buffer solutions after every sampling. The samples were analyzed by UV Spectrophotometer for determining the released amount of the drug. The graph was plotted between the %CDR and time. The other parameters like r2, t50 and t80% were calculated for evaluation of release study, kinetic study for different formulations and selection of best optimized formulation.
Stability study
The stability study was performed as per ICH guidelines. The formulated bionanosuspension were stored at different ambient temperatures for six months. The bionanosuspension were kept at two different conditions at 25 ˚C ± 2˚ C, 60% RH and 40˚C± 2˚C, 75 RH stability chamber. The samples were observed every two weeks for their different parameters during testing period. The samples under evaluation were observed for the drug content, pH changes and also any changes in color, appearance, its entrapment efficacy and in-vitro release study.
Appearance, % yield, color changing point of isolated biomaterial
The isolated Juglans regia biopolymer showed the whitish-cream in color. The %yield of isolated biopolymer was found to be 8 ± 1.2% .The color changing point was found to be 27˚C ± 4˚C . This means that a significant yield was isolated from the natural seeds.
Characterization of isolated biopolymer
As the isolated biopolymer (appears as whitish-cream color in appearance). In physic-chemical characterization the biopolymer was found to be odorless with characteristic taste. The isolated biopolymer was soluble in water and methanol and found to be Insoluble in acetone and diethyl ether. The tests for Carbohydrate and protein showed positive test in chemical testing for these constituents. The presence of these high molecular weight constituents reveals that these are polymeric in nature. The observation of different Characterized parameters findings of isolated biopolymer of Juglans regiais shown in Table 2.
| Parameters evaluated | Observation |
|---|---|
| Color | White-cream |
| Odor | Characteristic |
| Taste | Characteristic |
| Melting point | 275˚C ± 4˚C |
| Solubility | Soluble in water and methanol |
| Insoluble in acetone and diethyl ether | |
| Carbohydrate | Present |
| Protein | Present |
Table 2: Characterization of isolated biopolymer of Juglans regia.
Particle size analysis of biomaterial
The particle size of the isolated biopolymer was to be found in the range of 54.32-314.8 μm. The result reveals that the biopolymer is of granular in nature with flaky appearance with different particle size. The flaky appearance with granular structure was also correlated with SEM image. The particles observed were found to be similar to the standard polymers.
Rheological properties of biomaterial
The different rheological characterization like bulk density was found to be 0.66 ± 012 g/cm3, tapped density 0.9 ± 0.11 g/cm3, cars index-13.5 ± 1.2% which showed the satisfactory results. Thus the isolated biopolymers were found to be free flowing and are suitable for the preparation of bionanosuspension.
Sem
The SEM (Scanning electron microscopy) analysis of the isolated biopolymer form Juglans regia showed the flaky and granular surface. Such granular and flaky structures confirm its polymeric nature. The SEM image of isolated biopolymer has been shown in Figure 1.
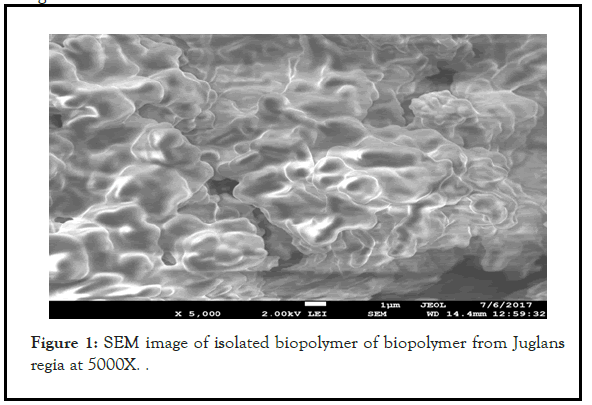
Figure 1: SEM image of isolated biopolymer of biopolymer from Juglans regia at 5000X.
FTIR spectral characterization
The I.R. Spectral analysis of biopolymer reported the presence of functional groups like hydroxyl (3395.29 cm1), alkynes (668.01 cm1), carboxylic acid (1386.63 cm1) and also other groups like amide at 1638.82 cm1, alkenes at 2926 cm1. The Presence of these functional groups is responsible for its polymeric nature like other synthetic and semisynthetic polymers. FTIR spectra have been shown in Figure 2.
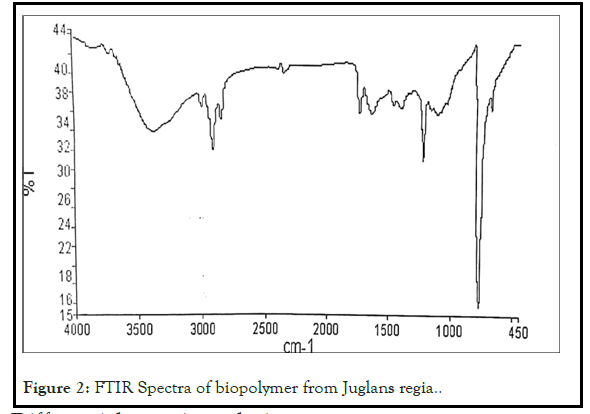
Figure 2: FTIR Spectra of biopolymer from Juglans regia..
Differential scanning calorimeter
The DSC of Juglans regia shows peaks at 83.27 Celand 128.3 Cel. The area was found to be 18.24 mj/mg and 0.55 mj/mg respectively [12]. The obtained result confirms its polymeric nature. The broad endothermic peak reveals its polymeric nature as shown in Figure 3.
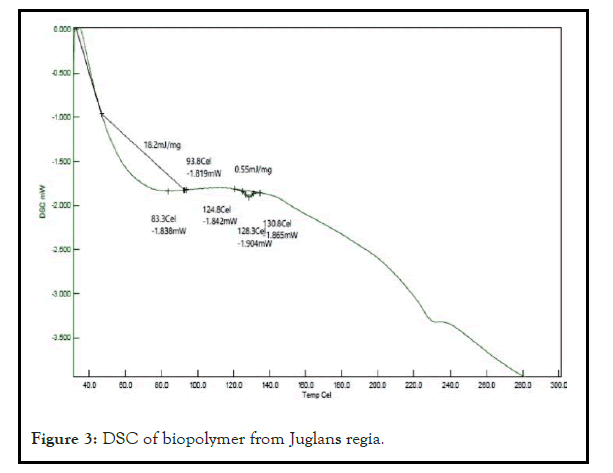
Figure 3: DSC of biopolymer from Juglans regia.
Mass spectroscopy
Mass spectral analysis of the isolated biomaterial reveals that the isolated biopolymer is polymeric in nature due to presence of high molecular weight structure. The presence of the high molecular weight confirms the presence of proteins. The high resolution mass spectra of isolated biopolymer showed the parent peak at m/j 579.29. Its large molecular weight structure like proteins which indicates its polymeric nature as shown in Figure 4.
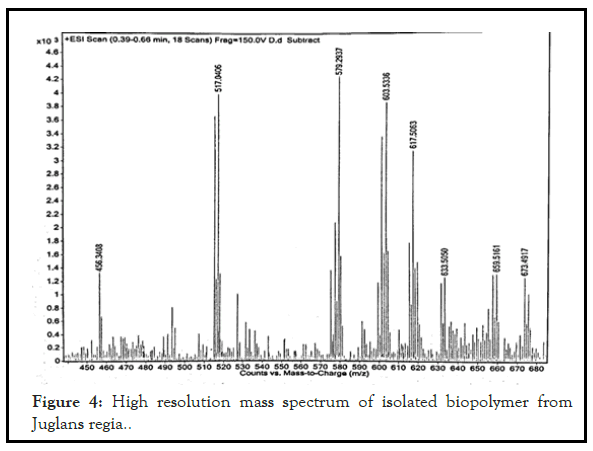
Figure 4: High resolution mass spectrum of isolated biopolymer from Juglans regia..
NMR spectroscopy
The NMR spectra shows the presence of peaks like peak at 0.90 ppm which reveals the presence of primary alkyl group, peak at 1.25 ppm confirms the presence of methylene group, at 1.26 ppm shows the presence of hydroxyl group, at 2.3 ppm confirms about the presence of ester group, at 4.2 reveals about aliphatic methylene proton. The presence of these groups confirms its polymeric nature as given in Figure 5.
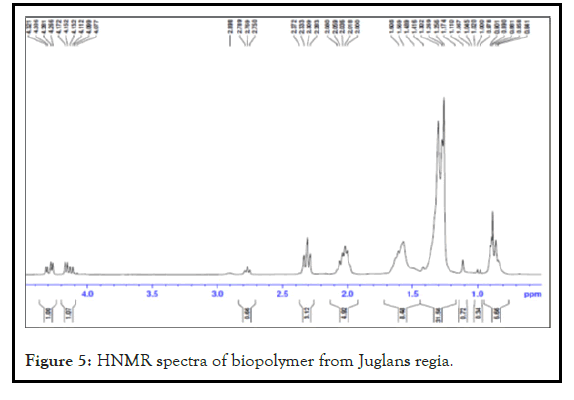
Figure 5: HNMR spectra of biopolymer from Juglans regia.
Cell line toxicity study of Juglans regia
The cell line toxicity study of Juglans regia biopolymer in the concentration of 0.31.25,62.25,125,250 and 500 (μg/ml) shows the mean % cell viability ranging from 152.38 ± 2.72% to 58.843 ± 9.27% with IC50 values (μg/ml) of >500 μg/ml.
Thus the cell viability assay data demonstrate that there is no cell death observed in assay. Along with this the IC50 value of the biopolymer was above 100 μg/ml. So the obtained data revealed that biopolymer was found to be safe and non-toxic in nature. So it can be safely used for the preparation of drug loaded bionanosuspension.
Cell-line toxicity graph of Concentration of Biopolymer Juglans regia vs. Mean % of cell viability has been shown in Figure 6.
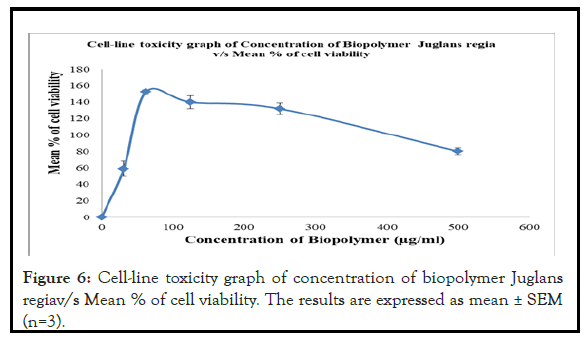
Figure 6: Cell-line toxicity graph of concentration of biopolymer Juglans regiav/s Mean % of cell viability. The results are expressed as mean ± SEM (n=3).
Nanosizing of phenytoin
The nanosizing of phenytoin was done for converting the phenytoin particle size in nano particle size range by the nano range which showed the significant results. In nanosizing the phenytoin particle size was found to be converted in nano size which was confirmed by UV screening. During the nanosizing of Phenytoin after each sonication cycle (each cycle equal to three minutes) the sample was observed for % transmittance that confirm that as the number of cycle increases the % transmittance was increased. This was due to decrease in particle size and particles are now are in nanorange. Thus % transmittance shows the % of particles below 400 nm in bionanosuspension and % blockade give an idea about the % of particles which are above 400 nm. Thus the UV method has given an idea about particles in nanorange. The % transmittance versus number of sonication cycles has been shown in Figure 7.
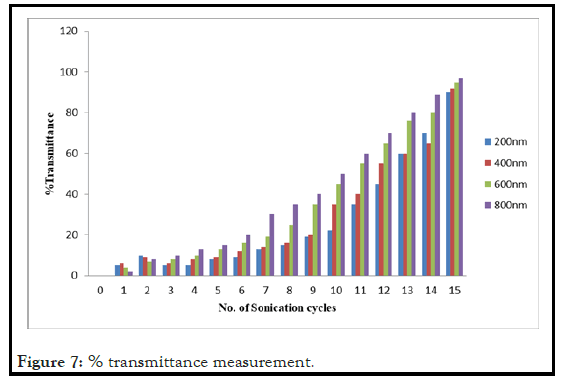
Figure 7: % transmittance measurement.
Drug-excipients interaction study
There was no significant change in λmax before (216 nm) and after the test (216 nm) in drug excipients study. The λmax was found to be much closer of the drug-biopolymer mixture as that of pure drug. It means that there was no interaction between drug and biopolymer and other excipients because there was no significant difference in λmax from that of pure drug. It was observed and confirmed that excipients is not interacting and not producing any changes in drug properties so the isolated biopolymer can be used for the preparation of bionanosuspension.
Characterization of phenytoin loaded bionanosuspension
The bionanosuspension with different drug-polymer ratio (PJ1-PJ7) were prepared. These selected, stable formulations (PJ1-PJ7) were evaluated for different parameters like dispersibility, pH studies, %entrapment efficacy, screening of bio nanosuspension particle size by UV screening, particle size analysis by Malvern Zetasizer and in-vitro release study. The findings of different evaluations are described below.
Dispersibility
The dispersibility of the formulated bio nanoparticles showed the satisfactory results. The dispersion was also found to be good [19]. All bio nanoparticles were in dispersed state during dispersion study. No aggregation or lump formation was observed.
pH
The pH of different bionanosuspension formulation was found to be satisfactory in Table 3. The pH of the bionanosuspension was found to be in range of pH 7.1 ± 0.16 to pH 7.7 ± 0.04. This means the formulations were in desired pH range that is suitable for the stability of the formulated bio-nanosuspension.
| Formulations | Observed pH |
|---|---|
| PJ1 | 7.7 ± 0.04 |
| PJ2 | 7.4 ± 0.12 |
| PJ3 | 7.4 ± 0.18 |
| PJ4 | 7.2 ± 0.21 |
| PJ5 | 7.4 ± 0.12 |
| PJ6 | 7.1 ± 0.16 |
| PJ7 | 7.3 ± 0.34 |
Table 3: Different formulations with observed their pH values.
% Entrapment efficacy
The entrapment efficacy of the formulated bionanosuspension was found in the range of 77.19 ± 1.5% to 87.4 ± 0.25%.Thus the formulated bionanosuspension showed the maximum entrapment efficacy up to 87.4% ± 0.25. Thus the formulated stable bionanosuspension showed the maximum entrapment of phenytoin.
Particle size screening of bionanosuspension by UV method
In screening of the formulated bionanosuspension PJ1-PJ7 showed all the particles in nano particles range. The screening by UV method has given an idea about the bio nanoparticles size. Here UV method has been used for screening the nanoparticles size in bionanosuspension after sonication. As the sonication cycle was increased the % transmittance was found to be increased because the particle size after sonication has come in nanorange. The% transmittance indicated about the % of particles below 400 nm and the % blockade showed the % of particles above the 400 nm when screened by UV spectrophotometry method. The bio nanoparticles of bionanosuspension were found to be reduced to 736.4 nm as confirmed by zetasizer.
Particle size analysis
The nanoparticles size analysis showed the satisfactory size range. The bio-nanoparticles size in stable bionanosuspension (PJ2) was found to be 736.4 nm after evaluation with Malvern Zetasizer. Thus the obtained size with the zeta potential of -2.69 mv confirms that the nanoparticles are in satisfactory nanorange which is responsible for the stability of bionanosuspension. The observed zeta potential for PJ2 confirms its significant stability. The result revels that biopolymer have significant inbuilt bio stabilizing property which stabilizes the formulation in nano particle range. The Particle size distribution and Zeta potential distribution of bionanosuspension has been shown in Figures 8 and 9.
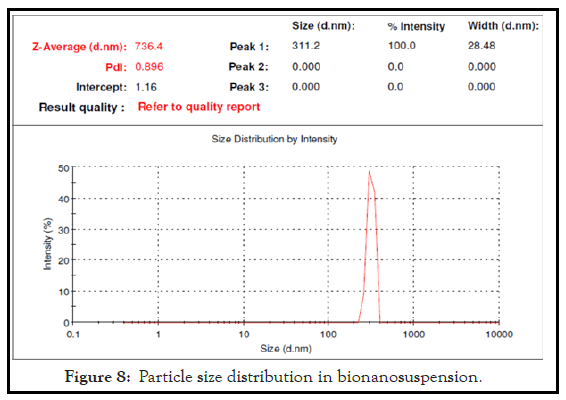
Figure 8: Particle size distribution in bionanosuspension.
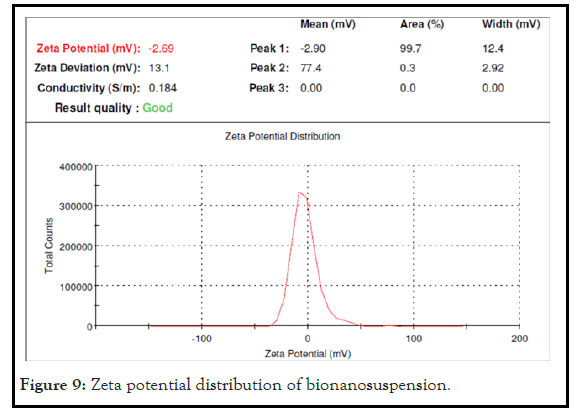
Figure 9: Zeta potential distribution of bionanosuspension.
In-vitro drug release
The In-vitro release study was done by using modified M.S. diffusion apparatus. The release kinetic study was done by using the BIT- SOFT1.12 and t 50% and t 80%, r2 were calculated. All the formulation showed more than 86.56% ± 3 drug releases in Figure 10. The in-vitro release study of different formulations showed the % drug release from 86.56% ± 3 to 98.52% ± 2. The formulation PJ2 was found to be the best formulation having to 50% of 18.09 hours and t 80% of 29.77 hours with r2 value of 0.9970 with 86.56% ± 3 drug releases in 36 hours. The kinetic study reveals that best fit model was found to be Korsmeyer Pappas and the mechanism of drug release was found to be anomalous transport. The bionanosuspension prepared with 1:1 ratio of drug and biopolymer showed a significant release of phenytoin. The result of in-vitro release study and release kinetic of the all formulations indicates the sustained release of the phenytoin was achieved from the formulated stable formulation bionanosuspension PJ2. Thus the isolated biopolymer from seeds of Juglans regia was found to have significant release rate controlling capability with excellent inbuilt bio retardant cum stabilizer property. Thus drug and biopolymer with 1:1 (PJ2) ratio showed the significant sustained release of phenytoin among all formulations which is the result of novel inbuilt bio retardant property of biopolymer which meets the need of epilepsy long term therapy.
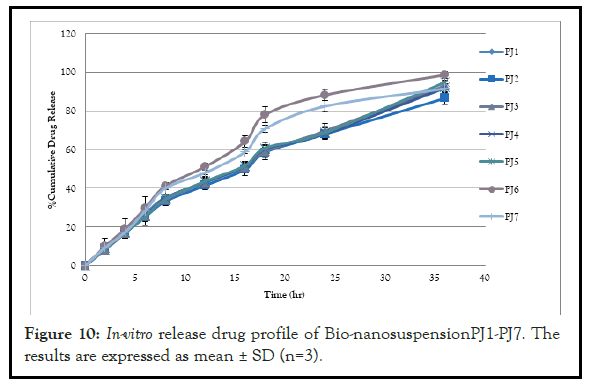
Figure 10: In-vitro release drug profile of Bio-nanosuspensionPJ1-PJ7. The results are expressed as mean ± SD (n=3).
Stability study
The optimized formulations showed no any change in λmax, entrapment efficacy and in drug release. So there was no drug loss during the study period. The other evaluation parameters also showed the satisfactory result. The best optimized formulation PJ2 was found to be stable during the study periods without any change in physical and chemical stability. There was no change in color, odor, pH and physical appearance. During the study period obtained results confirmed that the formulation was physically and chemically stable and compatible with isolated biopolymer.
There are a number of challenges which may come in frond during the design of nano carriers. The stability issues, drug entrapment efficacy, and delivery of the drug moiety on the desired sites. In this research we have designed a phenytoin loaded bionanosuspension by using a novel biopolymer isolated from natural Juglans regia seeds. By developing bionanosuspension the big issue with any dispersion system was minimized up to the significant level because of its inbuilt bio-stabilizing properties. The design of bionanosuspension loaded with nanosized phenytoin showed the significant stability. The use of nanosized phenytoin for designing the bionanosuspension showed the excellent result either in delivery of phenytoin up to the extended time or during the stability period. Thus in design of bionanosuspension the natural biopolymer played a very important role. The formulated bionanosuspension (PJ2 with 1:1 drug: biopolymer ratio) showed the satisfactory result with significant entrapment efficacy (87.4% ± 0.25), pH (7.4 ± 0.12), bio nanoparticles size of PJ2 (736.4 nm), zeta potential (-2.69 mv), drug release (86.56% ± 3 in 36 hours) and significant stability. The results reveal for its compatibility with phenytoin in bio-nanosuspension form. From these findings the biopolymer from natural source can be novel bio excipient for designing stable bionanosuspension. Biopolymer from natural sources stands as an alternative to standard synthetic and semisynthetic polymers because of its biodegradability, biocompatibility, with a number of inbuilt properties. Since biopolymer one of the excellent biomaterial which is present in natural resources but its novelty has been explored in broad. So the biopolymer can be safely used as the novel biomaterial for developing bionanosuspension in delivery of nanosized phenytoin to the target site for long term treatment of epilepsy.
In this research the bionanosuspension loaded with phenytoin were developed by using the biopolymer isolated from the seeds of Juglans regia. The optimized bionanosuspension PJ2 showed the significant drug release over 36 hours. Thus isolated biopolymer showed the excellent compatibility with phenytoin and has the significant bioretardant cum stabilizing property. The obtained outcomes reveal that the isolated biomaterial having a number of such promising characteristics may be used as a novel biomaterial for designing of bionanosuspension for delivery of phenytoin.
I wish to acknowledge Prof. Devender Pathak (Dean, Faculty of Pharmacy, UPUMS, Saifai) for encouraging me for the completion of research work. I want to also thank to SAIF, CDRI, Lucknow for providing me analytical testing facilities.
Data are available on request.
The authors declare that they have no conflict of interest.
No sources of funding
Citation: Kumar S, Madhav NVS, Pandey S (2021) Nanosized Model Drug Loaded Bio-Nano Suspension: It’s Development, Characterization and Evaluation. J Drug Metab Toxicol. 12:257.
Received: 02-Jul-2021 Accepted: 16-Jul-2021 Published: 23-Jul-2021 , DOI: 10.35248/2157-7609.21.12.257
Copyright: © 2021 Kumar S, et al. This is an open-access article distributed under the terms of the Creative Commons Attribution License, which permits unrestricted use, distribution, and reproduction in any medium, provided the original author and source are credited.