Journal of Geography & Natural Disasters
Open Access
ISSN: 2167-0587
ISSN: 2167-0587
Research Article - (2022)Volume 12, Issue 3
Background: The Andirap landslide is located on the left bank of the Kavsakbendi dam body, which was completed and put into operation in 2013, approximately 50 km from the Kozan district of Adana Province Turkey. The landslide was initially identified in the 1960s. During excavations for the construction of the dam, which began in 2009, it was determined by measuring instruments that the landslide moved between the limestone bedrock and shale to a depth of about 72 m from the surface. The extensive site and laboratory investigations were conducted to investigate the sliding mechanism of the landslide. Monitoring and stability analyses were performed to monitor the landslide's effects on the dam structure. For this purpose, the shear mass has been periodically monitored since 2013 with geodetic (superficial) and inclinometric (deep) measurements. According to the measurement results, a total displacement of 0.10 m occurred between 2013 and 2017, and between 2017 and 2020, the movement rate slowed down and decelerated to a standstill. In this study, after creating a numerical model and verification of the sliding of Andirap, which was activated in 2009, the possible behavior of the sliding under different load conditions of the dam was examined through stress-strain and stability analyses. According to the results of the analysis, no global failure was observed for the slip circle of the Andırap landslide. In the analyses carried out for the conditions in which the reservoir is full, the deep displacement of 0.11 m was consistent with deformation values of 0.04 and 0.11 m measured with inclinometers. In the analyses carried out for the load condition with full reservoir and seismic effects, it was calculated that the surface displacements reach up to 1.0 m compared to the depth displacements of around 0.13 m.
Results: As a result of this study, the creation of an actual numerical model of the site relies on the comparison of site measurements with extensive soil laboratory tests. Therefore, validated and compared numerical models of landslides can be used to predict landslide failure mechanisms over a service life.
Failure mechanism; Site numerical model; Site monitoring; Landslide; Surface geodetic measurements
A wide range of factors should be considered in the design of dams, including regional geology and morphology, topographic and climatic characteristics of the site, the presence of water resources, and static and dynamic loading conditions to reduce the problems and risks encountered during their operation. The design process must also consider the dam site and environmental landslides due to the construction and operation activities. These landslides triggered by natural events or human actions are geological events that involve the down-slope transport of soil and rock materials such as rock falls, deep failure of slopes, and shallow debris flows [1]. Many uncertainties have been associated with the triggering and propagation of landslides since these natural disasters can cause significant loss of life and property; they have been studied by many researchers over the past years. Field and laboratory studies and numerical analyses have been conducted to investigate predict, monitor, and measure the stability of landslides by reducing the impact of hazards. According to these studies, it has been stated that landslides occur as a result of an increase in shear stress in the slope mass or a decrease in the shear strength of the soil. The increase in shear stresses is caused by an increase in load on the slope, an increase in excavation, pore water and crack water pressures in the heel area, water filling in the tension cracks, and a decrease in the water level outside the slope. The reduction in the shear strength of the soil may develop due to increased water pressure on the discontinuity surfaces, sudden wetting of dry soil during seasonal changes, melting of the ice lenses formed in the cracks and voids, and degrease of cohesion of the soil [2-15]. For evaluations of the dam site and environmental landslides, the Finite Element Method (FEM) and the Limit Equilibrium Method (LEM) is widely used in the investigation of the stability of slopes under static and dynamic loads in two-dimensional (2D) and threedimensional (3D). Numerical analyses can be conducted using models that realistically consider the underground soil sections and the results of field and laboratory experiments. The success of the modeling and numerical analysis is strongly related to the precise determination of the general geology, structural geology, and stratigraphy of the sliding slopes. The boreholes can usually determine the geology of the slope in underground soil sections that will cover places that best represent the sliding mass. Material parameters determined by in situ and laboratory test results are used in numerical analyses. It is the most accurate approach to determine the soil profile at the site and transfer the site's conditions to numerical analysis. The numerical model established as a result of the studies is validated once it is confirmed that the analysis results are consistent with the monitoring measurements. Thus, according to deformation analyses, soil movements can be realistically predicted, keeping the possible loading conditions that the structure will be exposed to during its service life in mind. There are many studies in the literature using these LEM and FEM approaches. Fredj, et al. [16] Mentioned the instability of the slopes and the reasons for landslides at the slopes in mine excavations. To analyze the slope stability, back analyses were carried out by confirming the surface slides. In the analyses, the limit equilibrium method, finite element method, and finite difference method were used. The study aims to demonstrate the accuracy of the analyses in the mine excavations. Saadoun, et al. [17] studied the stability of the Chouf Amar Quarry's mine slopes by different analysis methods. Empirical, analytical, and numerical methods were used to demonstrate which method is the most accurate for the mine slopes. The FE and LE methods were compared and it was concluded that the LEM did not reflect the accuracy of the slope stability. Farid, et al. [18] studied different methods such as geomechanics, kinematics, and numerical and LE methods to evaluate the effect of the network of discontinuities on the mechanical behavior of the Chouf Amar massif and to establish a diagnosis of the stability and the movements amplitudes. By combining approaches, this study made it possible to optimize operations and improve productivity while ensuring the safety of equipment and personnel. Li, et al. [19] emphasized that numerical analyses to assess the stability of slopes are often not sufficient on their own but must be supported by monitoring results. In Zhou, et al. [20] the stability of the 530 m-high left coast excavations in the Jinping-I hydropower project was examined, and the complex geological structure was shown as the reason why the left bank excavation was very critical. A very detailed monitoring system was installed to monitor deformations, and measurements were made with both surface deformations and extensometers. On the other hand, by modeling the slope and excavation with a 3D numerical analysis, the development of deformations due to slope excavation was analyzed, and the calculation results showed that the sliding depth was consistent with the measurements. As part of the analysis of the Wujiang landslide with a volume of 1,327 × 107 m3 [21], the geotechnical characteristics and formation properties of the landslide were studied. The determined parameters and the impact on the key water dam, which was built 300 m to 590 m away from the landslide mass, were investigated by numerical analysis. As a result of the study, it was estimated that the shift occurred in the shear zone containing cracks in the bedrock, and although this landslide is an old landslide mass, it is currently evaluated as a repeated landslide mass. In further deformation analyses, it was determined that the landslide was still in the process of slow creep deformation. Thus, it was noted that the upper part of the landslide is likely to slide due to a superficial fracture and that the probability of a global failure is low. As a result of stability analysis using the Morgenstern-Price method, it was stated that the decrease in strength parameters of the soil negatively affected stability, especially due to the rise of the reservoir level. On the other hand, after this reduction, it was stated that the reservoir level increased stability by applying pressure to the dam fill surface. However, it was emphasized that the landslide should be monitored during and after the construction of the dam because the factor of safety calculated in the areas close to the dam body is quite low. To examine the stability problems that occurred during slope excavations in the Çitlakkale region within the borders of Giresun Province of Turkey, in the study conducted by Kaya, et al. [22], detailed geotechnical studies were carried out to determine the failure mechanism, and measures were taken to increase the stability of the slope. Similarly, inclinometer measurements were carried out, the motion rate of the landslide was determined, and the stability of the slope was examined using LE and shear strength reduction methods. It has been stated that stability problems in the slope are caused by excavations, and a support wall must be built on the heel to prevent the slope from sliding. In Bednarczyk [23], measurements taken with monitoring instruments placed at numerous mine sites in Poland found displacement movements at a depth of 235 m, which helped the employer, take fewer risks during excavation. It was emphasized that displacement and pore water pressure changes are also important in terms of using them as an early warning indicator, and it was important that the detailed numerical analysis that was carried out should be verified taking into account local site conditions in addition to possible hazards. In the study, to investigate the root causes of the landslide occurring in the Maharashtra region of India, the landslide was modeled by factoring in the material parameters determined from soil samples taken from the site. It was found that the cause of the slide was a negative impact on the strength of the soil as a result of excessive rain. In Shah, et al. [24], site use maps showing the cause of sliding were examined using ArcGIS monitoring systems, in addition, excessive pore water pressure elevation zones were identified as the cause of the slope shift. In the study, agricultural effects caused by drainage systems as well as excess pore water pressure rise in the development of the landslide mechanism were mapped and monitored, and recommendations were made to increase stability by controlling the factors causing the slide. In the Coltorti, et al. [25] study, which focused on the activities and characteristic features of complex landslide structures in the Tuscany region of Italy, it was stated that lithology and downstream river valleys may be the main cause of movement, especially due to gravitational influence. To confirm this activity, the study performed multitemporal analyses with the Orthophoto system in 4 separate periods: 1954, 1988, 1996, and 2013. It was emphasized that the activity classifications obtained as a result of the study are also applicable to other landslide areas with similar zones.
The Andırap landslide is located on the left bank of the Kavsakbendi dam, approximately 50 km away from the Kozan district of the Adana Province in southern Turkey (Figure 1). The geological, tectonic, and stratigraphic properties of the site and the specific tectonic and structural engineering properties of the area including the Kavsakbendi dam were studied by Özgül, et al [26]. The geological properties and groundwater conditions of the site were studied by Yüzer [27]. The geological and geomechanical characteristics of the area were explored by the Geoconsult (2009) report and local geological formations and discontinuities were identified. The general geological map was prepared during the construction period of the dam. The construction of the dam was completed between 2012 and 2013 with the completion of dam fill and face slab concrete pavement works in late 2013. To improve the sliding mass, the forces acting towards the sliding direction were reduced in the landslide area. For this purpose, the sliding mass was excavated and drainage trenches were constructed on the excavation berms to prevent the infiltration of surface water into the soil as much as possible. Additionally, inclinometer and geodesic surface deformation measurement networks were installed to monitor potential deep and surface deformations during the excavation of the dam body "Andirap landslide slope stability evaluation repor" Following studies conducted in 2013, both deep landslide movements and surface geodetic measurements and landslide movements continue to be monitored. Besides, surface deformations are monitored annually using precision air tools to increase the accuracy of surface measurements. In addition, in case of an increase in the rate of sliding since 2014, drainage trenches have been excavated in the construction area to reduce the effect of surface water. Existing drainage trenches have also been cleaned. Andırap deep slide movement occurred at the interface between limestone and shale, which is approximately 72 m below the surface. The mechanism of the landslide was first described in 1960. During the field, surveys were carried out in 2009, the exact location was determined, and the movements occurring with geodetic and in clinometric measurements were taken. It was predicted that the landslide would create a risk to the environment of the dam; an as-built 3D numerical model in AutoCAD 3D software was created for numerical analysis in the area where the landslide. After a 3D numerical model was generated of the topography, in the critical sections determined, stress-strain and limit equilibrium analyses were performed by taking into account the potential loading conditions that may affect the stability of the dam environment and its service life. Thus, the slope behavior under the different loading conditions was investigated to check whether a landslide may be encountered in the future [28, 29].
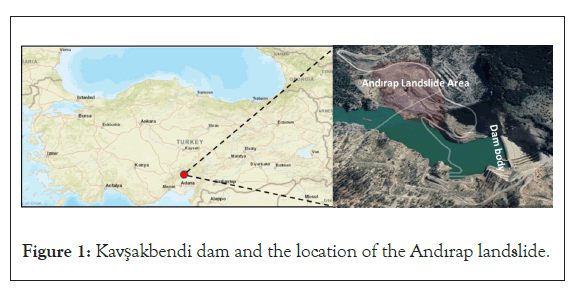
Figure 1: Kavşakbendi dam and the location of the Andırap landslide.
The general geological properties, stratigraphy, and structural geological properties of the site were investigated in detail, and a general geological map of the study area was prepared during the feasibility phase of the Kavşak dam project. The structural geology and stratigraphic thickness of the formations were determined. By recognizing the landslide movement in the early phase of the Kavsak dam project, the actual thickness of the geological formations was explored by core drillings and the strength parameters of formations were determined by site and laboratory tests. In the area where the landslide occurred, the numerical models were created for two critical sections, and stress-strain and limit equilibrium analyses were performed. Analysis results were compared with 10 years of monitoring and measurement data and verified with each other. The behavior of the landslide mass was evaluated for 3 different loading conditions. Loading conditions were taken into account, including the empty reservoir state (LC-1), the full reservoir state (LC-2), and both the full reservoir state and the effects of earthquakes [30] (LC-3). In this study, the behavior of the slope in case of water drawdown from the dam reservoir was not studied. In numerical analyses, the Mohr-Coulomb failure hypothesis [31], presented in equation (1) was used as the criterion of failure on the sliding surface. Strength parameters for short - and long-term stability analyses were determined by consolidated-undrained (CU) as well as consolidated-drained (CD) triaxial tests. Shear strength parameters for shale and limestone in the zone where the slide occurred were determined from CD tests for drainage conditions [32].
τ =σ '.tanϕ '+ c ' (Units: τ and c is kN/m2) (Equation 1)
In this equation, τ is the shear strength of the soil, c' effective cohesion, σ' is the normal effective stress acting on the shear surface, and φ' is the effective shear strength angle. Simplified Bishop and Spencer methods [33] were used for limit equilibrium analysis by using Slide® 6.0 and the sliding surfaces were assumed to be circular. Diana FX10.1, using the finite element method was used for stress-strain analysis. In two-dimensional (2D) stability analyses with Diana FX 10.1, the factor of safety against failure was determined by the strength reduction method [34-35]. In this method (equation 2), the cohesion and friction component in the Mohr-Coulomb failure criterion is gradually reduced (by dividing by the increased factor of safety F). The strength reduction process is maintained until the shear stress is equal to the shear strength. The factor of safety at the moment of failure is indicated as the factor of safety against sliding down the slope being studied.

While creating the site model primarily for numerical analysis in the AutoCAD Civil 3D® software, sections of the area were obtained by matching the topographic contour maps of the area and imported into the programs by saving them as dxf files, having processed the geological units acquired from the borehole logs. Later, an analysis was carried out by taking into account the soil structure relationships, analysis method, material parameters, and loading conditions. Standard soil and rock laboratory tests were performed to determine the physical and strength parameters of the formations. During the drilling, pressure meter tests were performed at 1.5 m intervals following the TS EN ISO 22476- 4, ISO 22476-4, and ASTM D-4719-07 standards. Sieve and hydrometer analysis (ASTM D 422) tests were performed for soil classification (ASTM D 2487). Atterberg limit tests (ASTM D 4318) were used to determine the liquid and plastic limits of the soil materials. Specific gravity and absorption tests (ASTM C 127) were carried out to determine grain density and water absorption of aggregates. Permeability tests (ASTM D5084) were performed on the hydraulic conductivity of soils and consolidation tests (ASTM D 2435) were carried out to investigate for compressibility of the clay and to determine the rate of consolidation. Ring shear tests (ASTM D 6467-06a) and triaxial tests (ASTM D 4767) were performed to get the cohesion and internal friction angle of the soils. Direct shear tests (ASTM D 5607) and uniaxial compressive strength tests (ASTM D 2938) on rock materials were performed to obtain uniaxial compressive strength, internal friction angle, and cohesion of rock units [32-28].
Andirap landslide area and soil properties
The general geological map of the Andırap region is presented in Figure 2a, and the geological formation on the right and left slopes of the dam body are illustrated. On the left slope where the Andırap slide is located, the soil layers are parallel to the landslide direction, and on the right slope, towards the mountain. The top layer of the Andırap region is covered by slope wash and its thickness of it is approximately 5 m to 30 m [29]. Rock blocks and material flows generally exist at the interface of the Andırap landslide region and massive limestone. Rock blocks that exist in the landslide area are not related to the global failure mechanism. As illustrated in Figure 2b, the geological units which were involved in the analysis are limestone, shale, slope wash, and clay. The light yellow unit is slope wash as illustrated in Figure 2 and it is located in the upper part of the Andırap landslide zone. Limestone is illustrated in light blue and it is one of the main geological units within the stratigraphic structure of the landslide mass. Limestone generally increases the resisting forces of mass and has medium to good rock strength properties and includes karstic zones. The shale rock is located stratigraphically under the limestone and it rarely outcrops. It is illustrated in dark brown in the C-C section in Figures 2a and 2b [29]. The clay is located underneath the slopewash and it does not outcrop. The geology of the Andırap region is dominated by slopewash at the surface which consists of silty clay, clay, and rock block matrix. This material generally has medium and weak strength parameters such as cohesion and internal friction angle (light yellow in Figure 2). In Figure 2, underneath the slopewash, limestone is indicated which is the main geological unit that controls the sliding mechanism of the Andırap landslide. It is shown in Figure 2 C-C cross-section that the other major geological formation that affects the Andırap landslide is the shale, as well. Shale underlies the limestone and generally has good strength parameters except for the interface of the limestone. At the interface with limestone which is defined as the slip surface line of the Andırap landslide, shale is deformed and weathered. In Figure 2, clay exists with low shear strength parameters compared to other geological units such as limestone and shale. Furthermore, the geological map of the site indicates that karstic cavity zones, stuck clay masses, quartzite, sandstone transitions, and dolomitic limestone levels are observed in the working area. The dip directions of the layers are generally from the mountain to the dam body. Layers include intermediate clay layers and sliding planes. As part of the article, an as-built 3D numerical model has been created for the region to create a realistic numerical model by precisely determining the current state of the Andırap site. For this purpose, a photogrammetric map was obtained with 80% overlay aerial photos taken from 150 m flight altitude with a Multirotor G4 surveying robot unmanned aerial vehicle. In Figure 3 pink side was obtained by the Multirotor G4 surveying robot and the map coordinate system is a 3-degree coordinate system, which was used in ED50 Datum in UTM (Universal Transversal Mercator) projection. Numerical maps were created by producing a point cloud with an accuracy of 0.04 m GSD from photos processed using Pix4D photogrammetry software. The measurements obtained from 3D maps of the site show the topographic state before and after the impounding phase of the reservoir as seen in Figure 3. Using these maps, a topographic contour map was obtained by comparing old and new topographic maps in AutoCAD Civil 3D (Figure 3). By using this topographic map, critical sections to be analyzed were obtained from the AutoCAD Civil 3D software. The parts indicated in gray represent the map created in 2010, and the coordinates are combined with the topographic map created in 2017 and illustrated in pink. Thus, an up-to-date surface map of the Andırap landslide has been obtained, ensuring that the sections best represent the soil structure. After obtaining topographic maps, drilling points were placed together with their coordinates on the contour map of the landslide, and Sections 1-1 and 2-2, were determined to use in numerical analysis. In Sections 1-1 and 2-2, the sliding surface is represented [27,36] and this surface is called a fossil landslide in the Andırap region. In Figure 3, the locations of Sections 1-1 and 2-2 and the main geological units were shown in Figure 4. The inclination of the slopewash changes from 10° to 50° in the landslide area. The slope inclinations which have high angles were reduced by excavations, especially since 2014. The slopewash layer generally has low strength properties. The slopewash material does not have a direct effect on the slope failure mechanism but at the intersection with the reservoir, surface deformations and failures occur. Clay is generally located in limestone karstic gaps in the geological history of the study area. It was encountered underneath the slopewash in Section 1-1 during the HSK-4 inclinometer establishment phase. Gypsum and anhydride intermediate geological units are also found in the clay layer. Section 2-2 is located close to the dam body side of the Andırap region and it is accepted as the final boundary of the landslide. Shale is the other major geological unit and it is located underneath the limestone mass. The thickness of clay is 5-10 m as illustrated in Figure 4, Section 1-1. It has been noted that clay occurred by subsea deposition and compression during the period of limestone formation by tectonic movements during the geological time period observed following the formation of the slopewash unit [37]. Since its strength properties are very low compared to the bedrock mass, it can be defined as the unit that is most easily subjected to deformation as a result of the decrease in shear strength with the increase in pore water pressure developed in it. The liquid limit and plastic limit values for the clay are 29% and 17%, respectively. Additionally, the unit volume weight of the clay soil was identified as 22.5 kN/m3, and the cohesion was identified as 15 kN/m2 [28]. Limestone that is obtained from borehole HSK-10 has slickensides, polished surfaces, and karstic zones. This limestone unit is classified as “Medium Rock" [38-40]. Horizontal displacement was encountered especially at the 72m depth from the surface in the HSK-10 inclinometer hole during the impounding phase of the reservoir in mid-2015. In the following period of impounding phase, an additional horizontal displacement occurred again at the depth of approximately 72 m, and the inclinometer pipe was broken due to the deformation. This displacement location is confirmed as the boundary of the Andırap fossil landslide, as evidenced in studies such as [27,35]. Karstic cavity zones, stuck clay soils, quartzite, sandstone transition zones, and dolomitic limestone zones were observed in the limestone bedrock formation. High modulus of elasticity (up to 30 GPa), high shear strength angle (φ=60°), and cohesion values of c=1.12 MPa were obtained from site and laboratory tests. According to Serafim and Pereira [37-39], rock masses give a 30 GPa modulus of elasticity, and according to Serafim and Pereira 1983, Bienawski 1989 [37-39]corresponds to a value of approximately 70 RMR according to the classification and was classified as “good rock” [37-39]. Massive and good rock masses which have not any slickenside trace zones were encountered during the excavation phase of the upstream cofferdam. Shale basement rock is considered a durable rock mass underneath the Andırap landslide, however, it is crushed and weathered at the interface-transition zone with limestone and it has lower shear strength parameters due to the movement of the Andırap fossil landslide. Therefore, the transition zone has lower internal friction angle and cohesion values relative to the main shale. Additionally, the permeability is also higher than the shale rock mass that is located in the base. In Figure 3, the sheared and crushed shale transition zone has been shown in the photo (HSK-2 depth 65.2 m-71.35 m). It can also be defined as a zone in which the shear strength is low and the Andırap mass slides over it. The RQD value is below 10 at this transition zone and has a very low modulus of elasticity and RMR values [37-39]. Shale bedrock is located between 50 m and 75 m from the surface in the Andırap region. The internal friction angle of this unit is deformation modulus is determined as E=3.1 GPa. This mass of rock can be considered bedrock and it has very low permeability. This rock mass unit disperses quickly due to its fine mineral structure when it is exposed to water directly. The material parameters used in the numerical analysis for all units are presented in Table 1. Within the scope of this article, the mechanism of the deformation-shear movement occurring at the interface zone of the limestone and shale geological units was taken into account, and the behavior of the slope mass was evaluated by numerical analysis. Figure 2 shows a view of the general geological map and Figure 2b presents the section of the main geological units surfaced in the top layer of the Andırap landslide area. Climatic factors and groundwater conditions generally affect the Andırap landslides deformation. Generally, the weather conditions are dry in the summer in the study area. However, in winter conditions, surface deformation in the slopewash increases due to the surface rainwater. Surface water could not be infiltrated easily due to the low permeability of the slopewash. While pore pressure increases in the slopewash, the strength of the material decreases. Therefore, the deformation in the slopewash increases. On the other hand, the slip surface zone of the Andırap landslide is affected by the surface water conditions. Groundwater increases the pore pressure and decreases the strength of the geological formations. Therefore, especially in the winter and rainy conditions, by increasing the groundwater level, it is expected that rate of deformation increases.
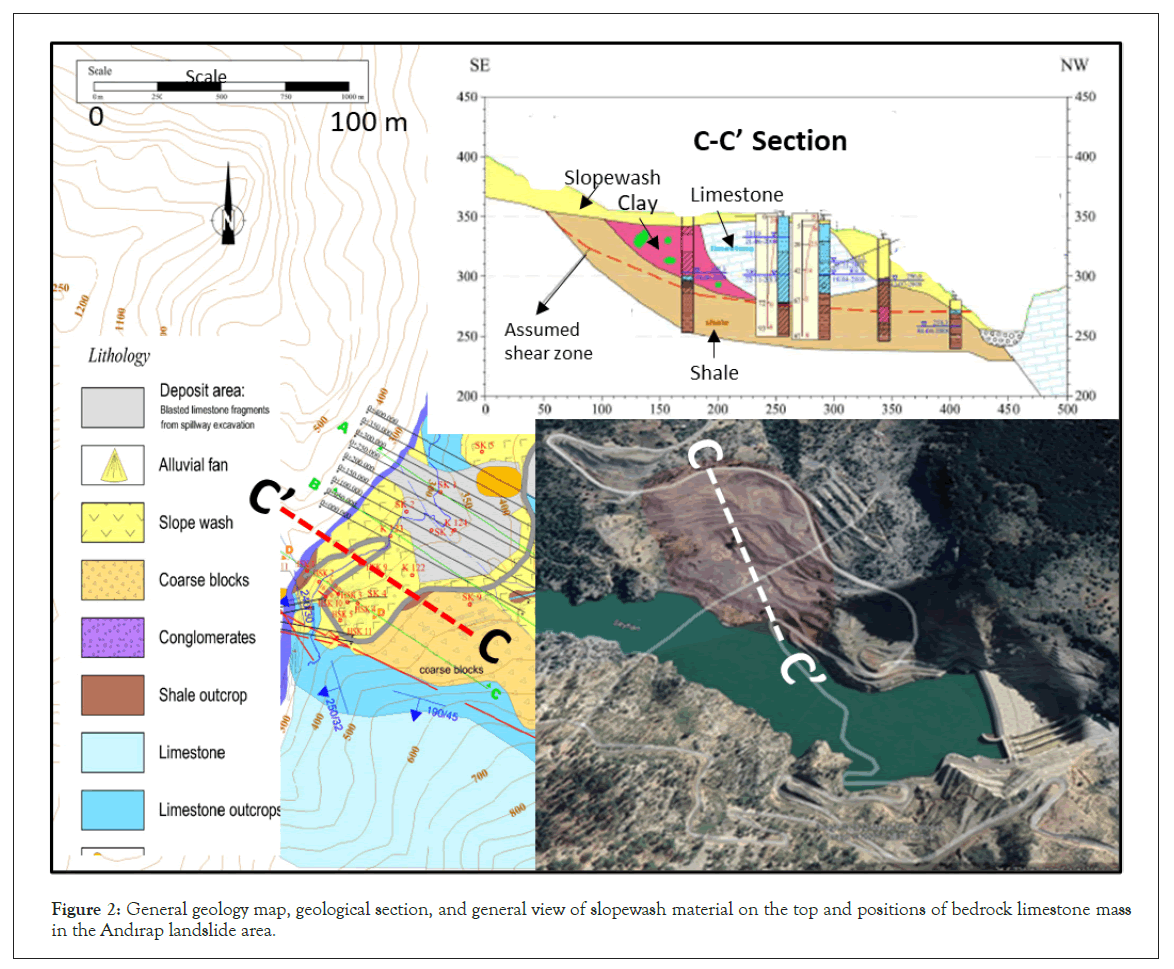
Figure 2: General geology map, geological section, and general view of slopewash material on the top and positions of bedrock limestone mass in the Andırap landslide area.
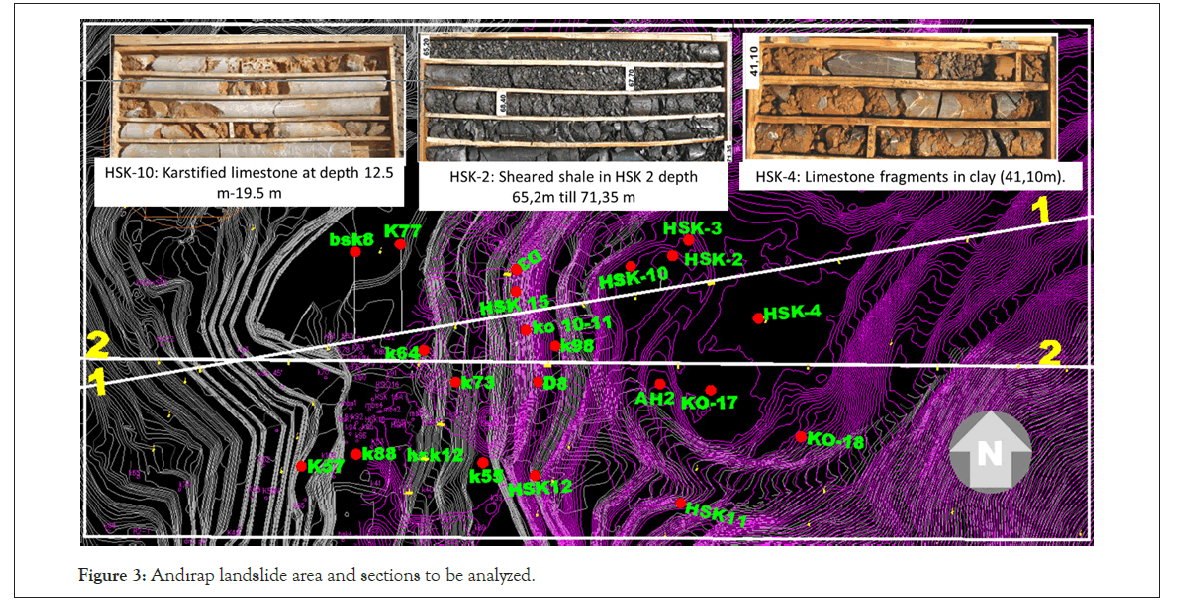
Figure 3: Andırap landslide area and sections to be analyzed.
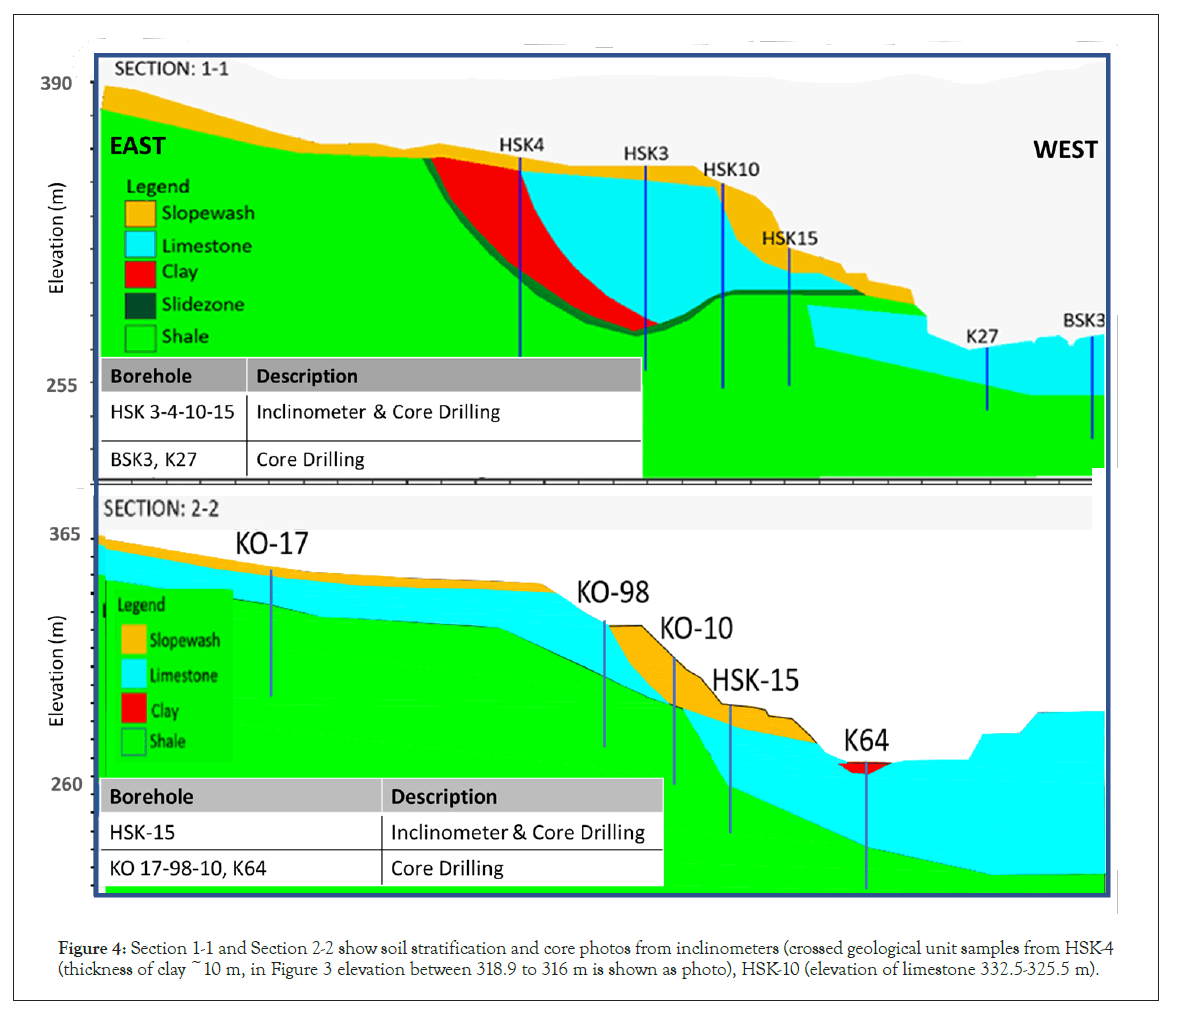
Figure 4: Section 1-1 and Section 2-2 show soil stratification and core photos from inclinometers (crossed geological unit samples from HSK-4 (thickness of clay ~10 m, in Figure 3 elevation between 318.9 to 316 m is shown as photo), HSK-10 (elevation of limestone 332.5-325.5 m).
| Geological units | Modulus of Elasticity E (MPa) | Poisson Ratio n (-) | Unit Volume Weight g (kN/m3) | Cohesion c (kN/m2) | Internal Friction Angle j (°) |
|---|---|---|---|---|---|
| Slopewash | 40 | 0.4 | 20.5 | 12 | 40 |
| Limestone | 30000 | 0.3 | 27.5 | 1120 | 57 |
| Clay | 30 | 0.4 | 22.5 | 15 | 35 |
| Transition zone | 1060 | 0.3 | 25 | 240 | 38 |
| Shale | 3100 | 0.3 | 26 | 440 | 46 |
Numerical model verification
The two sections illustrated in Figure 5 considered in the analyses are approximately 70 m to 100 m from the Kavşakbendi dam. As part of the Andırap landslide, Sections 1-1 and 2-2 were modeled in the Diana FX10.1 finite element software and the displacements that occurred between 2014 and 2019 were computed. The results of the numerical analysis were verified by comparing the inclinometer and surface topographic measurements. Displacements are illustrated for loading conditions LC-1 (Figure 5a) and LC-2 (Figure 5b) in Section 1-1. The term TDtXYZ that is mentioned in these figures refers to the resulting displacement that occurs in the case of different loading conditions. LC-1 refers to the empty reservoir, and LC-2 refers to the full reservoir loading case in the numerical analysis. LC-3 refers to full reservoir and earthquake loading cases in the analyses. In the HSK-3 and HSK- 10 inclinometer measurements, displacements were measured as 40 mm to 110 mm at the depth between 67 m and 72 m from the surface, especially in the reservoir full state. This depth coincides with the failure surface of the fossil landslide that is mentioned in the limit equilibrium analyses [29] conducted during the design phase of the dam. In later geological periods, this fossil sliding surface became stable, undergoing a period of recrystallization with high earth pressure. On the other hand, core drillings indicate the presence of a zone with low strength parameters, as seen in Figure 4, especially during the impounding phase. According to an analysis by Jung and Verdianz (2013), it was stated that the Andırap landslide would show a displacement of up to 80 mm in the direction of the reservoir after the start of the impoundments and the main reason for this displacement would be an increase in the pore water pressure in the Andırap fossil landslide zone containing crushed sliding zones. This displacement reached its maximum level in the mid-2015 within HSK-10 approximately at the depth of 67 m revealed by contraction and compression developed in the inclinometer pipe and the measurement process was ended for this inclinometer pipe. To monitor the displacements occurring after the impoundment phase (deep landslide movements after 2015), the measurements were maintained in HSK-11 (in Figure 3) and HSK-3 inclinometers. Annual displacement rates were examined according to inclinometer measurements, it was found that the rate of displacement reduced from mid-2015 and has stayed stable for the last five years (between 2015-2020). This is in line with the results of the studies carried out before and after the project phase [29,35]. The most important factor in reducing the rate of displacement is that the limestone mass that is located in front of the landslide continues from the left bank to the right bank at depths of 54 m-57 m from the surface. This limestone coincides with the elevations of 240 m-285 m in sections 1-1 and 220m-300m in sections 2-2 in Figure 4. The displacement values which were obtained by Diana FX10.1 were compared with surface geodetic measurements which were taken from the same points and are presented in Figure 5a and Figure 5b. In stress-strain analyses, the resulting displacement was calculated as 67.6 mm in the landslide area as shown in Figure 5a. Furthermore, the geodetic measurements were performed at the HSK-11 inclinometer location, and maximum displacement was measured as 50 mm. According to the results, it can be concluded that displacements obtained from the field monitoring measurements and the displacement values calculated by the numerical analysis are consistent with each other. In Section 1-1, as a result of the stress-strain analysis, it was indicated that the deformations were concentrated in the slopewash close to the reservoir. The reason for this is the increase in pore water pressure within the semi-permeable soil and the decrease of cohesion in the material. Thus, the shear strength of the slopewash decreases quicker than that of the bedrock material. A stability analysis carried out using the strength reduction method showed that large displacements occurred at the endpoints of the slopewash.
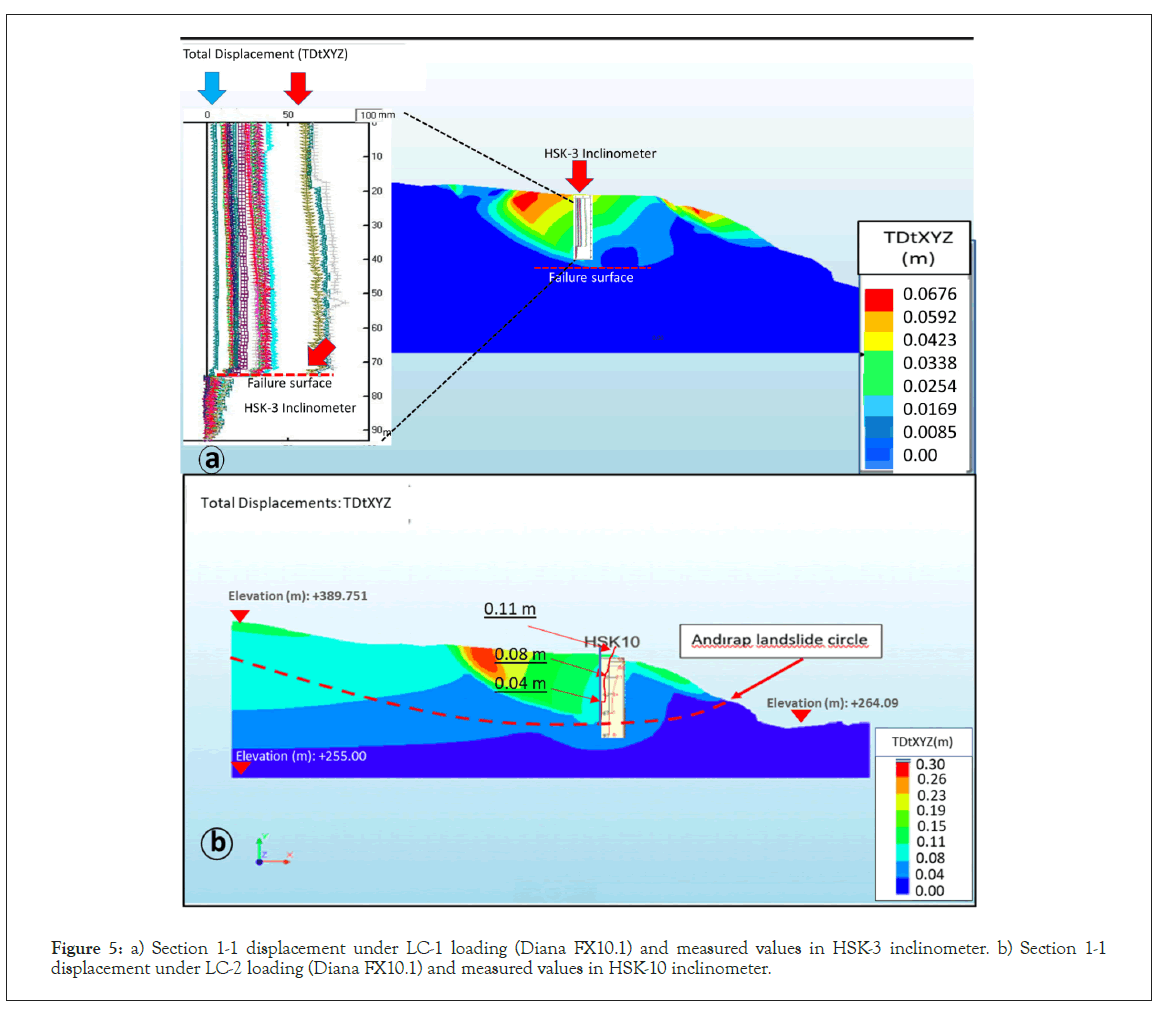
Figure 5: a) Section 1-1 displacement under LC-1 loading (Diana FX10.1) and measured values in HSK-3 inclinometer. b) Section 1-1 displacement under LC-2 loading (Diana FX10.1) and measured values in HSK-10 inclinometer.
In the case of loading without water in the reservoir (LC-1), a value of 1.15 is obtained for the factor of safety, while in the case of a full reservoir (LC-2), there is a decrease in the factor of safety by approximately 15%, and the factor of safety reduces below 1.0. According to the results of the numerical analysis, the sliding surfaces and displacements occurred at the slopewash-limestone interface transition zone as expected.
Inclinometer measurements are quite compatible with the displacements calculated from stress-strain analyses for Section 1-1. Thus, by using the verified numerical model, other analyses were performed while taking into account the other loading conditions.
Numerical analyses
The stability of the two sections on the left bank of the Kavşakbendi dam in the Andırap landslide area was calculated by stress-strain and limit equilibrium analyses, taking into account different loading conditions. In the analyses, loading conditions were taken into account, including the empty reservoir state (LC-1), the full reservoir state (LC-2), and both the full reservoir state and the effects of earthquakes (LC-3). Possible displacements and factors of safety were calculated for these loading conditions. Taking into account the above-mentioned loading conditions in two critical sections, stress-strain analyses were performed with the Diana FX10.1 finite element software, and the displacement and safety of the slope against sliding were calculated. Then, with Slide 6.0 software, which provides a solution using the limit equilibrium analysis method for each loading condition, the factors of safety against sliding were calculated. In this way, the factor of safety against sliding determined from stress-strain and limit equilibrium analysis was compared. For the LC-3 loading case, as part of the seismic hazard analysis prepared for the Kavşakbendi dam field [30], acceleration values were determined by taking into account design spectra with a repetition period of 2475 years were utilized.
Stress-strain analyses
As a result of the stress-strain analysis for the empty reservoir state in Section 1-1 (LC-1) (Figure 5a), the resultant displacement movement of the X-Y-Z directions was calculated as 67.6 mm in the slopewash and the partially weak clay soil material and the factor of safety against sliding was calculated as 1.15. The analysis result of the LC-2 loading condition is also shown in Figure 5b. Under LC-2 loading conditions, the resulting displacements approaching 150 mm were calculated within the slopewash and displacements approaching 300 mm were calculated within clay that is located in the middle of Section1-1 and the factor of safety (F) decreased below 1.0 under this condition. These displacements in the slopewash and clay indicate the shallow surface deformations and no global failure (Andırap deep landslide) occurred. The failure surfaces are developed in the slopewash due to the decrease of cohesion and in the clay due to the increase of pore water pressure. In the case of LC-3 loading, 0.217 g horizontal and 0.145 g vertical earthquake acceleration values were applied according to the previous studies on-site [30]. As seen in Figure 6a, a displacement of 0.55 m in the slopewash on the reservoir side and 1.09 m on the clay was calculated. In Section 2-2, if the reservoir is empty (LC-1), the factor of safety was calculated as 1.212, and it was determined that only surface deformations occurred (Figure 6b). In this section, the thickness of the slopewash ranges from 10 m to 30 m, and surface failures were developed in the slopewash, as in Section 1-1, close to the reservoir. The maximum displacement was calculated as 160 mm in the slopewash (Figure 6b). There is no displacement in the shale and limestone classified as bedrocks. However, the failures are very small-scale on the edges of the slopewash, and the presence of a global sliding failure surface crossing the Andırap sliding plane was not detected. In Section 2-2, under the LC-2 loading condition, the displacements increase to 200 mm by increasing 40-50mm compared to the empty reservoir loading state (LC-1) (Figure 6c). In the full reservoir case, shallow surface failures occurred due to the pore water pressure inside the mass of slopewash, as well as the increase in forces moving the slope outward due to the increase in unit volume weight. Although the factor of safety (F) was 1.125 and above 1.0, the factor of safety decreased with the increase in internal stresses. The displacements determined in the LC-3 loading condition for Section 2-2 are shown in Figure 6d. Under the LC-3 loading condition, 0.217 g horizontal and 0.145 g vertical earthquake acceleration values were considered [30]. In this loading condition, the resulting displacements (DtXYZ) in the slopewash were calculated as 1.03 m. The factor of safety was determined as lower than 1.0 for the slopewash. As these displacements increase, the factor of safety decreases below the 1.0 value. However, as seen in Figure 6d, no global failure is observed.
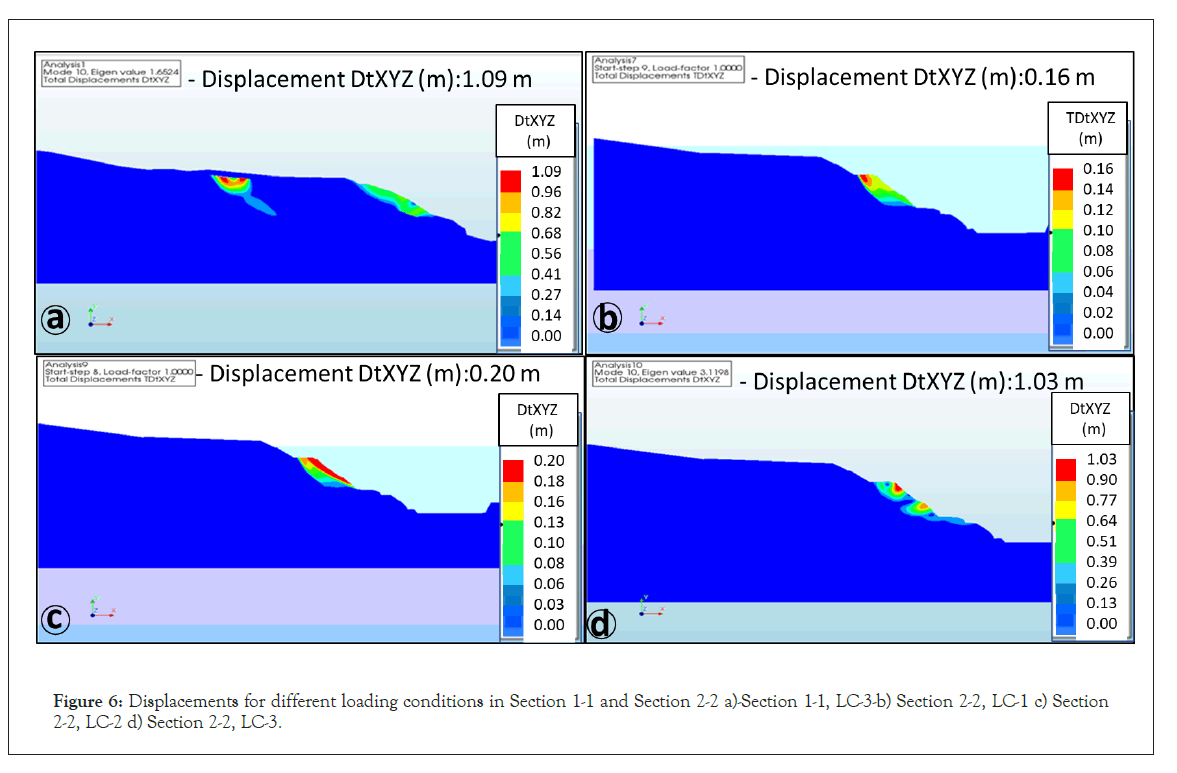
Figure 6: Displacements for different loading conditions in Section 1-1 and Section 2-2 a)-Section 1-1, LC-3-b) Section 2-2, LC-1 c) Section 2-2, LC-2 d) Section 2-2, LC-3.
Limit equilibrium analyses
The analyses were repeated in Slide 6.0 by using the limit equilibrium analysis method, and critical factors of safety and sliding surfaces corresponding to loading conditions were determined and compared with the results obtained from stress-strain analyses. Figure 7 presents the analysis results according to different loading conditions. In Figure 7a, a factor of safety of 1.102 was obtained for the LC-1 loading condition, and no deep sliding was observed. For the LC-2 loading condition (Figure 7b), the factor of safety decreases to 0.993 but again indicates failures in the surface and slopewash. The pore water pressure increased with the water within the slopewash material, and it was determined that there were surface failures in the material due to the weakening of strength parameters such as the internal friction angle and cohesion. In Figure 7c, under the LC-3 loading condition, the sliding failure surface crosses through the slopewash, but the factor of safety decreases to as low as 0.40. As in the stress-strain analysis, surface failures occurred in the slopewash, and as a result, the factor of safety decreased to as low as 0.40.
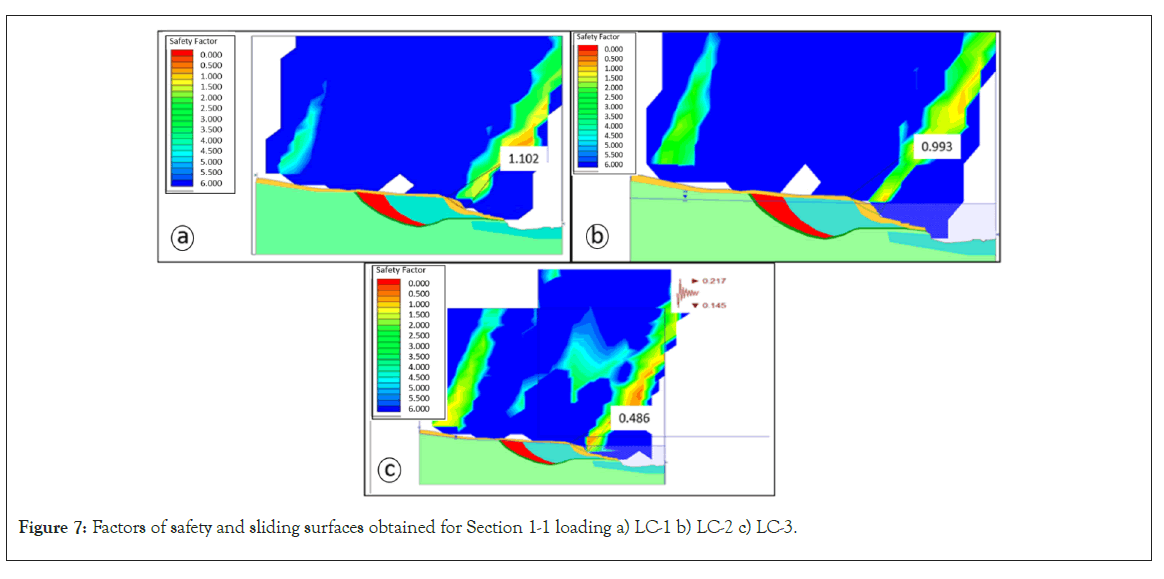
Figure 7: Factors of safety and sliding surfaces obtained for Section 1-1 loading a) LC-1 b) LC-2 c) LC-3.
There were no signs of failure in the Andırap deep landslide, which can be considered a fossil landslide. Comparing the results of the analyses, it is observed that the factor of safety of 1.102 obtained in the LC-1 loading condition and the factor of safety of 1.150 calculated from the stress-strain analysis is quite close to one another. The location of the sliding failure surface obtained from the limit equilibrium analysis and the location of the main sliding failure surfaces in the slopewash obtained from the stressstrain analysis are almost the same. The results obtained from the stress-strain and limit equilibrium analyses indicate that if there is no water in the reservoir, no global failure will occur. Figure 8 shows the factor of safety values against sliding and the locations of failure surfaces determined for LC-1, LC-2, and LC-3 loading conditions in Section 2-2. In Figure 8a, for LC-1, the sliding failure surface crosses through the slopewash, and the factor of safety is 1.395, which is close to the value of 1.200 calculated from the stress-strain analysis. Therefore it is not expected that stability problems will be encountered in the LC-1 loading case. The position of the failure surface is almost in the same position as the failure surface obtained from the stress-strain analysis. When the displacements obtained from Diana FX10.1 are evaluated, it is seen that the displacements approaching 10 mm, especially in the limestone and the slopewash, coincide with the sliding failure surface in the slopewash that is obtained from Slide 6.0. In Figure 8b, in the LC-2 loading condition, the factor of safety was found to be 1.202, while it was 1.125 in the stress-strain analysis, and the resulting failure surfaces cross through the slopewash, as observed in Slide 6.0 analyses. Under the LC-3 loading condition, the factor of safety dropped below 1.00 (F=0.759), and similarly, in the stress-strain analysis, the displacement reached 1.030m. In the analysis, no signs of a failure surface related to global deep failure were found (Figure 8c). Displacements are concentrated in the promontory parts of the slopewash. Section 3-3 of the Andırap landslide - located 600 m from the dam body - includes a 20–30 m thick slopewash. In this section, where the slopewash is quite thick, stability analyses were performed, and factors of safety were determined (Figure 9). Thus, in the part where the thickness of the slopewash increased, the factors of safety against sliding were examined under the loading conditions of LC-1, LC-2, and LC-3.
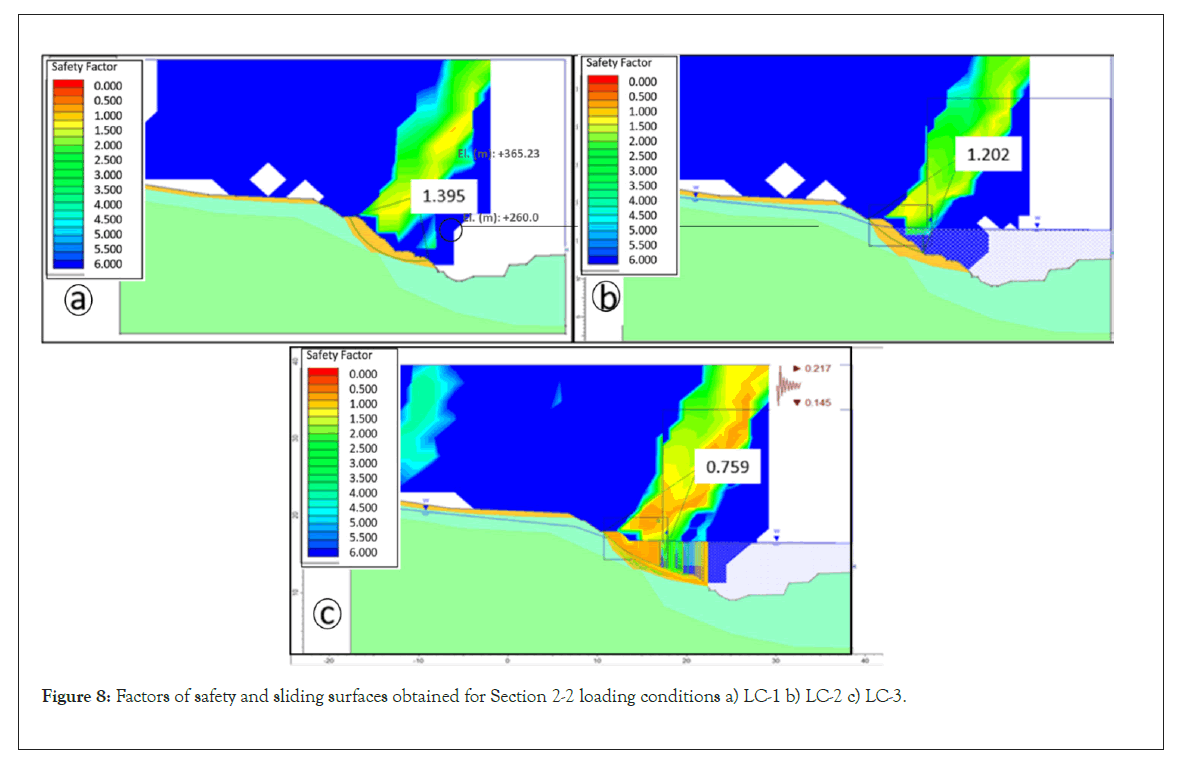
Figure 8: Factors of safety and sliding surfaces obtained for Section 2-2 loading conditions a) LC-1 b) LC-2 c) LC-3.
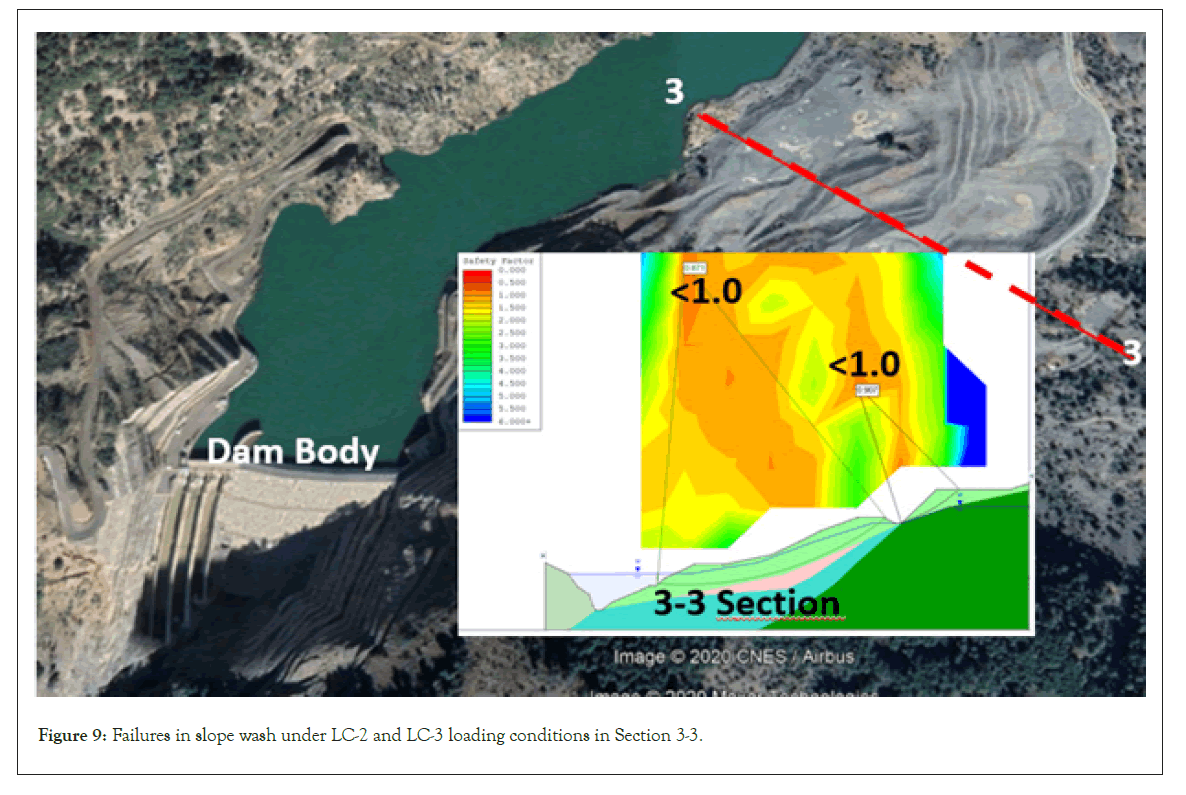
Figure 9: Failures in slope wash under LC-2 and LC-3 loading conditions in Section 3-3.
In this section, the factors of safety against sliding in LC-2 and LC-3 loading conditions were found to be below 1.0. [29] noted that this slide, which is considered a deep landslide movement, does not significantly affect the dam body.
The results obtained from the numerical analyses conducted at the design stage are presented in Table 2 and compared with the analysis results that were obtained in the context of this article. The results of the analyses were considered for shallow failures (in slopewash) and deep failure surfaces. In deep failures, sliding failure surfaces were determined considering the Andırap landslide for conditions where the factor of safety was above 2 in the vicinity of the sliding failure surfaces. The displacement value of 67.6 mm calculated from the stress-strain analysis for the Andırap landslide is consistent with the inclinometer measurements. After stressstrain analyses were performed by Diana FX10.1 for Sections 1-1 and 2-2, limit equilibrium analyses were performed with Slide 6.0 for the same sections. This, in turn, shows that the results are quite consistent with each other for the empty reservoir loading condition. In general, no major displacement was obtained in the analyses for the Andırap fossil landslide. The reason for this is that although the strength parameters of the formation defined as a transition zone (sliding zone) are lower than other bedrock properties, it shows no signs of sliding in terms of the factor of safety and displacement in low slope sections (Section 1-1 and Section 2-2). In Figure 10, a summary is given for surface deformations and the factor of safety under different loading conditions (LC-1, LC-2, and LC-3). These figures indicate that especially under the LC-3 loading condition, surface deformations will increase due to the effect of the earthquake but there will be no global failure.
| Section | Factor of Safety (F) | Displacement (m) | ||||
|---|---|---|---|---|---|---|
| Section 1-1 (Shallow) | LC-1 | LC-2 | LC-3 | LC-1 | LC-2 | LC-3 |
| Diana FX10.1 | 1.15 | <1.000 | <1.000 | 0.068 | 0.3 | 1.09 |
| Slide6.0 | 1.102 | 0.993 | 0.486 | - | - | - |
| (Jung and Verdianz, 2013) | 1.375 | 1.23 | 0.94 | - | - | - |
| Section 2-2 (Shallow) | LC-1 | LC-2 | LC-3 | - | - | - |
| Diana FX10.1 | 1.213 | 1.13 | <1.00 | 0.16 | 0.2 | 1.03 |
| Slide6.0 | 1.395 | 1.2 | 0.759 | - | - | - |
| (Jung and Verdianz, 2013) | 1.996 | 1.61 | 0.939 | - | - | - |
| Section 1-1 (Deep) | LC-1 | LC-2 | LC-3 | - | - | - |
| Diana FX10.1 | >2.500 | >3.000 | >3.500 | 0.025 | 0.080-0.110 | 0.13 |
| Slide6.0 | >3.000 | >4.000 | 2.5 | - | - | - |
| (Jung and Verdianz, 2013) | 1.83 | 1.84 | 1.97 | - | - | - |
| Section 2-2 (Deep) | LC-1 | LC-2 | LC-3 | - | ||
| Diana FX10.1 | >2.000 | >3.000 | 3.000 | 0.02 | 0.050-0.100 | - |
| Slide6.0 | >3.000 | 5 | 2 | - | - | - |
| (Jung and Verdianz, 2013) | 3.23 | 3.86 | 1.97 | - | - | - |
| Section 3-3 (Deep) | LC-1 | LC-2 | LC-3 | - | - | - |
| Slide6.0 | >1.500 | >1.300 | <1.000 | - | - | - |
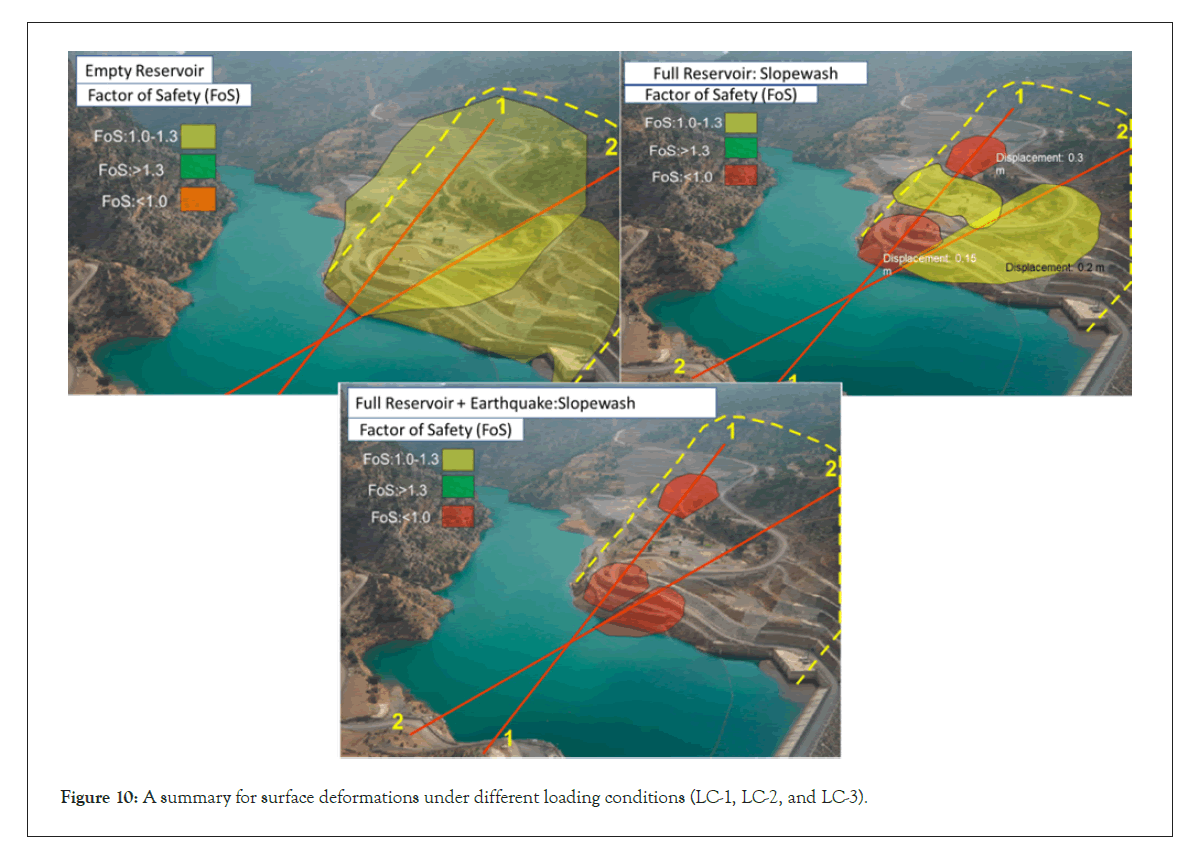
Figure 10: A summary for surface deformations under different loading conditions (LC-1, LC-2, and LC-3).
The landslide which was studied by this article has been experienced by LC-1 and LC-2 loading conditions during the operation period of the dam. The results show that the analysis results are compatible with the site measurements. Therefore, during the service life of the dam, if the Andırap landslide took place as expected in LC-3 load conditions, theoretically there will be no global failure.
The Andırap landslide mechanism was first described in 1960, but its exact location was determined during the field surveys carried out in 2009 for the dam construction. As stated in by Jiao, et al. movements have occurred due to the construction and operation activities of the Kavsakbendi dam. In the study, numerical analyses were carried out in two sections representing the site based on extensive site and laboratory research conducted to study the sliding mechanism of the Andırap landslide. After validating the numerical model using site measurements, the behavior of the landslide was studied, taking into account the different loading conditions that the dam may encounter during its service life. The results obtained from the numerical analyses are found to be quite consistent with the factors of safety and the location of the sliding surface that was calculated in the studies by Jung [29] and Hammah [35] which was previously conducted in the region. Additionally, the displacements from deep (inclinometer) and surface (geodetic) monitoring measurements and numerical analysis are quite close to one another. The importance of comparing numerical analysis results with monitoring measurements was also underlined by Zhou,et al. [21]; Sun, et al. [20]; Bednarczyk [23]; and Kaya [22]. The most important factors affecting the analysis results are choosing the most appropriate material model and determining the analysis method to model the behavior of the soil by taking into account the loading and drainage conditions in the study area. Coltorti, et al [25] stated that the geological and morphological structure of the region also affected landslides. On the left slope where the Andırap landslide is located, the soil layers are parallel to the landslide direction, and on the right slope towards the mountain. Moreover, shale basement rock is considered a durable rock mass underneath the Andırap landslide, but, it is crushed and weathered at the interface-transition zone with limestone and it has lower shear strength parameters due to the movement of the Andırap fossil landslide. In some studiesstated that the shallow failure surfaces are developed in the slopewash due to the decrease of cohesion and the clay due to increased pore water pressure [4,6,7,19,20]. The pore water pressure increased with the water within the slopewash. It was determined that the material had surface failures due to weakening strength parameters such as the internal friction angle and cohesion. The displacements in the slopewash and clay are shallow surface deformations and the global failure (Andırap deep landslide) did not occur. Field and laboratory studies and numerical analyses have been conducted to investigate predict, monitor, and measure the stability of the deep landslides by reducing the hazards at the Kavsakbendi dam site. According to numerical analysis, landslides have occurred as a result of an increase in shear stress in the slope mass and a decrease in the shear strength of the soil. In stated the increase in the shear stresses is caused by the excavation of a soil and rock mass, and the decrease in the shear strength is caused by the increase of pore water pressures in clay soil [2, 4, 6, 7]. During the design and service life of the dam, it is not sufficient to determine the strength parameters by taking detailed site and laboratory research and empirical calculations into account to obtain the safety factors for the structure. At the same time, the numerical analysis should be carried out by taking into account the determined strength parameters, selected failure criteria, the cohesion, and analysis method, and the loading conditions that it may encounter during the service period. Since it is not possible to reflect the soil section at the site completely accurately for numerical analyses, it is necessary to monitor the soil movements with depth (inclinometer) and surface (geodetic) measurements to validate the numerical model. After the numerical model is validated by site measurements, it gives a general perspective on the safety of structures and different possible scenarios that cause destructive damage.
Although the Andırap landslide was identified in the 1960s, the first major displacements have been recognized during the dam construction period in the year 2009. To understand the mechanism of the landslide, extensive research and measurements were carried out on the site, and in light of the obtained site data, soil sections in the study area were generated to represent the site. Material parameters of geological units were determined by using the site and laboratory tests. Surface movements were measured by geodetic monitoring instruments and deeper displacements have been monitored by inclinometers from the beginning of the construction period of the dam. A numerical model was created in the study by considering site tests and real-time measurement results. Stress-strain and stability analyses were performed for two critical sections of the landslide area located on the left bank of the Kavsakbendi dam for different loading conditions. In numerical analyses, the behavior of the slopes was evaluated by taking into account the empty reservoir (LC-1), the full reservoir (LC-2), and the full reservoir with earthquake effects (LC-3). In the section of slopewash as the upper layer of the landslide, it was determined that the displacement calculated in the cases of LC-1 and LC-2 was 97% consistent with the site measurements. On the other hand, deep displacements from numerical calculations were compared with the site measurements and determined to have 90% consistencies with each other. According to the stability analysis, in the case of LC-1, the factor of safety against sliding in Section 1-1 and Section 2-2 was above 1.0 for the slopewash, while in the case of LC-2, the factor of safety was calculated to be below 1.0 only for Section 1-1. However, the factor of safety in all loading conditions for the deep sliding global failure surface is greater than 1.0. According to stress-strain analyses, global failure was not obtained for the sliding surface of the Andırap landslide under any of the loading conditions. In sections 1-1 and 2-2, the massive limestone mass located at the bottom of the landslide at a depth of 54-57m from the soil surface has prevented the deep landslide by increasing the stability. Thus, the sliding movement that started on the Andırap deep slip surface in 2010 due to the dam excavations came to a halt until 2020, with the stabilizing effect of the limestone in the bottom of the landslide after the dam construction. Therefore it has been found that the no global stability problem will not be encountered during the operation period of the dam for the worse conditions such as earthquake conditions. It has been found that the massive limestone located at the bottom of the landslide is the main resistance factor to reducing the landslide movement. It is thought that the results obtained from this study will guide similar studies in the future.
In the Andırap landslide area located on the left bank of the Kavsakbendi dam, it was determined that the monitoring measurements are consistent with the values calculated according to the numerical analyses taking into account the loading conditions that the dam may encounter during its service life. Thus, it can be said that the numerical model, analysis method, and material parameters selected for analyses adequately represent the conditions of the site. The LC-1 and LC-2 loading conditions correspond to the construction period of the dam and the impounding period.
The LC-3 loading condition has been a case yet to be experienced by the dam. According to the numerical analysis, no global failure is expected to endanger the operation of the dam or any human lives in the area of the Andırap landslide in the service life of the dam. However, considering that the numerical model may be limited in defining the soil profile of a heterogeneous structure, the landslide should continue to be monitored periodically with deep and surface monitoring instruments.
[Crossref] [Google scholar].
[Crossref] [Google scholar].
[Crossref].
[Crossref] [Google scholar].
[Crossref] [Google scholar].
[Crossref] [Google scholar].
[Crossref] [Google scholar].
[Crossref] [Google scholar].
[Crossref] [Google scholar].
[Crossref] [Google scholar].
[Crossref] [Google scholar].
[Crossref] [Google scholar].
[Crossref] [Google scholar].
[Crossref] [Google scholar].
[Crossref] [Google scholar].
[Crossref] [Google scholar].
[Crossref] [Google scholar].
[Crossref] [Google scholar].
[Crossref] [Google scholar].
[Crossref].
[Crossref].
[Crossref].
[Crossref].
[Crossref] [Google scholar].
[Crossref] [Google scholar].
[Crossref].
[Crossref].
[Crossref] [Google scholar].
[Crossref] [Google scholar].
[Crossref] [Google scholar].
[Crossref] [Google scholar].
[Crossref] [Google scholar].
Citation: Eroz M, Pamuk R, Tuncer K, Kilic H (2022) Natural and Numerical Landslide Model Based on Measurement and Predicted Values Comparison: A Case Study of Kavaskbendi Dam Left Bank Andirap Landslide. J Geogr Nat Disasters. 12: 248.
Received: 05-Aug-2022, Manuscript No. JGND-22-18709; Editor assigned: 09-Aug-2022, Pre QC No. JGND-22-18709 (PQ); Reviewed: 23-Aug-2022, QC No. JGND-22-18709; Revised: 30-Aug-2022, Manuscript No. JGND-22-18709 (R); Published: 06-Sep-2022 , DOI: 10.35841/2167-0587.22.12.248
Copyright: © 2022 Eroz M, et al. This is an open-access article distributed under the terms of the Creative Commons Attribution License, which permits unrestricted use, distribution, and reproduction in any medium, provided the original author and source are credited.