Clinical & Experimental Cardiology
Open Access
ISSN: 2155-9880
ISSN: 2155-9880
Research Article - (2016) Volume 7, Issue 12
Objective: Hypertension is a major risk indicator for coronary heart diseases, renal failure, stroke and other various illnesses, and it is the primary global risk for mortality. Blood pressure measurements are essential for managing the risks resulting from hypertension. In this paper we will present a new device, the TensorTip MTX, which computes hemodynamic blood pressure noninvasively.
Methods: This paper presents a technique that uses the color imaging resulting from a set of monochrome light source that traverse the tissue under consideration and is projected onto the color image sensor. A new extended solution of the Windkessel model is being displayed and provides additional insight on various functional resistances rather than a constant resistance.
Results: The TensorTip MTX was clinically evaluated in two medical centers and was found to perform well at standard blood pressure measurements also monitoring patients who suffered from alterations of blood pressure due to cardiac surgery. The device passed successfully our clinical trials and fulfilled the ISO 81060-2 recognized accuracy requirements for various notified bodies.
Conclusions: In this work it was found that the variation in the pressure flow can be determined from the changes in the height of the temporal color histograms and additional temporal volume information.
Significance: Today, the most common technique is the oscillometric technique based on the sphygmomanometer arm cuff pressure. This paper presents a new device, the TensorTip MTX, which computes hemodynamic blood pressure noninvasively, cuff less and free of air pumping.
Keywords: Blood pressure; Hypertension; Image sensor; Noninvasive; TensorTip MTX
Hypertension is a worldwide spreading disease and its prevalence rises over the years. Today it is the primary global risk factor for mortality, and causes about 13% of death worldwide [1,2]. High blood pressure levels are related to peripheral artery diseases, renal deficiency, retinal hemorrhage and visual impairment [3]. Observational epidemiological studies have shown interdependence between blood pressure and vascular mortality, consequently the "prehypertension" range is also being investigated during the recent years. This "prehypertension" range, i.e. 120 to 139 mmHg for the systolic blood pressure and 80 to 89 mmHg for the diastolic blood pressure, was found to be quite frequent in the world population and may also lead to coronary heart disease and cardiovascular disease [4-7]. As a result, blood pressure measurements may act as a risk indicator for various diseases and monitoring it may postpone or even prevent those illnesses [6,8]. Today, the common technique for measurement is the oscillometric technique due to its convenience and availability [6,7]. Frequent home blood pressure measurements can foresee morbid events better than the occasional clinical monitoring, and can also overlook the 'white coat effect', a known phenomenon of an increase in the blood pressure in the presence of a physician [6].
A new method for monitoring blood pressure will be presented in this paper, based on real time color photography of the blood tint diffusion. In the past, physicians diagnosed physiological conditions by observing color, texture and appearance of the skin tissue such as the face tissue. Using observation for diagnostic purposes still retains an important role and is given as the first guideline to every medical student. MedlinePlus Medical Encyclopedia advises physicians to look for the presence of a pale complexion when diagnosing sickle cell anemia [9]. Similarly, liver diseases are known to manifest on the skin ranging from finger clubbing to a yellow skin [10]. Moreover, skin tint has an important role in the examination of newborns [11].
This paper presents a new hemodynamic optical method for measuring blood pressure noninvasively, using the temporal color distribution image of the skin tissue. Cnoga’s first prototype was a camera that photographed the face color distribution by using color video stream. The reflected light from the patients’ tissue provided rich information about the human physiological and emotional condition. The aim of this paper is to display an innovative device that can measure the internal blood pressure from the capillary hemodynamics. The device is sealed to external light. It radiates light at different wavelengths traversing the finger capillary tissue and then being projected onto the color image sensor. The image is then analyzed by dedicated Digital Signal Processor (DSP) algorithms for computing various bio-parameters that are then displayed on the screen.
The TensorTip MTX device
The main focus of this paper will be the TensorTip MTX device (shown in Figure 1a), developed by Cnoga Medical Ltd. This device measures the blood pressure noninvasively and is air pumping free. The device is small, light-weight and portable. The apparatus is intended for use in the home environment and as well as an additional support in clinics. The TensorTip MTX device consists of a DSP medical and control subsystems. The medical subsystem contains a color image sensor, LEDs and a DSP which is responsible for the image acquisition, the image processing, the lighting control system and the extraction of the clinical parameters values. The control subsystem contains four touch-buttons, a display, an audio-speaker and a Microcontroller Unit (MCU) which is in charge of the user interface, the process management, the internal storage and the device’s power management.
Hemodynamics is used in numerous medical fields, mostly during surgical procedures or afterwards in the recovery room where the blood pressure is being measured by an in line arterial tube [12-15]. This device measures blood pressure noninvasively using hemodynamics, and therefore is entirely different compared to other instruments in this field [8]. As presented in Figure 1b the device consists of a finger compartment, four monochromatic light sources in the visual to IR spectrum (~600 nm to ~1000 nm) and a color image sensor. The device produces a lossless stream of color video signal and uses the image buffer memory and the dedicated DSP processor for internal computations. The device and the algorithms used for the biomarkers computation are a part of the patent issued by the company [16-18].
The technology developed by Cnoga is based on a color image sensor which was executed in two physical scenarios. A TouchFree scenario, Cnoga’s first prototype, which is based on an ambient light reflected from a tissue onto the image sensor, for example: the skin tissue or internal tissue during endoscopic photography (Figure 2a). However, the current suggested technology, the TensorTip MTX, which is the aim of this paper, uses monochrome light traversing the tissue under consideration, such as a fingertip or an earlobe (Figure 2b). This device uses a real time color image sensor which provides the ability to analyze tissue pigmentation over spatial-temporal-color domain. This technology uses a color array sensor which allows to provide richer information compared to other known devices, such as a standard pulse oximetry which usually uses two discreet diode sensors and two monochromatic light sources [19-21].
Image sensor
As mentioned above, our technique is based on color image sensor. The sensor is sensitive to a continuous spectrum in the range of ~380 nm- ~1000 nm. The sensor may be utilized for various applications, such as medical monitoring, cosmetic diagnosis, lifestyle, automobile, security, etc. The current paper discusses the applications of medical monitoring with focus on blood pressure, whereas other parameters e.g. blood count, blood gases, chemistry and additional hemodynamic parameters such as cardiac output will be reviewed in the following papers.
Color stream video
Real time stream video provides spatial-temporal-color information and consists of a six dimensional space: three dimensions of color (red, green and blue), two dimensions of position (x and y) and one dimension of time (t). In order to detect small changes in the blood flow and in color pigmentation, a high accuracy dynamic range (i.e. number of bits per pixel), wavelength range and frames per second (FPS) are needed. A short description of the way the color image sensor collects the pixel information is described in Appendix A.
Preliminary
The color image sensor provides triple spatial-temporal functions in the form of
 (1)
(1)
for each set of Light Source (L) we denote by
 (2)
(2)
The value of each color represents the dynamic range of the image sensor; in our case, 12 bits per color, giving a total of 36 bits. The spatial information, i.e. pixel position, is being represented by x and y while t represents the time dimension. The image sensor is used as a 3D Spectrometer and Color Distributor.
Based on our investigation of the skin or blood tissues we have found that under Normal Light Condition, i.e. day light, the tissues will have the color intensity order of red > green ≥ blue and in some cases red > blue ≥ green. This phenomenon is demonstrated in Figure 3 where histograms of actual blood tissue pigments observed at the red to IR wavelengths emitted from 4 LED lights. As can be seen there, the red histogram is the dominant one in terms of light intensity, followed by the green and then by the blue. This phenomenon is attributed to the iron in the hemoglobin that causes the blood to be red. The tissue tint depends on oxygen, carbon dioxide and other blood components [20].
Color coordinate system
In some cases it is useful to use a different color coordinate system such as a normalized coordinated color system. Here are two examples (we use i,j,t for discrete location instead of x,y,t):
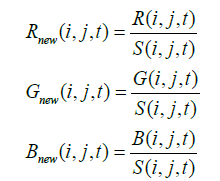 (3)
(3)
Where
 (4)
(4)
as for the first example.
A normalization over the 2D sphere embedded in 3D dimension (regarded as S2) is considered as the second example, i.e.
 (5)
(5)
Having color coordinate transformation over a unit sphere, normalizing the magnitude of all pixels.
Temporarily Color Histogram (TCH)
The TCH is an important tool for describing changes in the spacetime- color domain. Let
 (6)
(6)
be three color domains representing red, green and blue spatialtemporal- color functions associated with a set of light emissions L. We define triple continuous weighted histograms for each color as the Lebesgue – Dirac integral function [22].
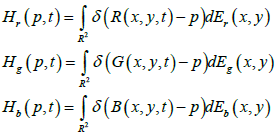 (7)
(7)
where H represents the temporary histogram volume of the red, green and blue images (color plane), respectively. E represents a measurable weighted function and p is the pixel value. The delta function becomes zero whenever a color pixel value does not match the p pixel value.
A discrete form of (7) is:
 (8)
(8)
In terms of the discrete signal while  represents the number of red pixels having p pixel value at time t. Respectively,
  and
and  representing the green and blue temporary histograms. Figure 3 shows three temporary color histograms.
The color histograms have a few elements that can point on biological parameters: (i) height change represents the variation in volume of the optical pressure flow projected onto the image sensor; (ii) the horizontal axis represents the pixel value, the shift of the histogram sideways is representing the pulse; (iii) the location of the histogram over the horizontal axis signifies the 3D absorption level; (iv) the spatial-temporal-color absorption may indicate on certain hemodynamics, blood count and chemistry.
Peripheral pulse temporal waveform
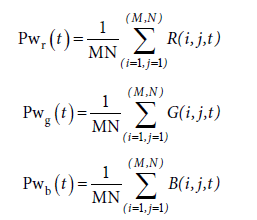 (9)
(9)
Where  represents the average of the spatial color plane under consideration, M stands for the total rows and N for total columns. M·N is the pixel resolution of the image. Three heart rate pulse signals may be used by averaging each spatial color plane.
Basic principle of the blood pressure calculation
Two element Windkessel model [23,24] is given by the following ordinary differential equation (ODE)
 (10)
(10)
Equation (10) has a direct solution of the form (see Appendix B)
 (11)
(11)
While  and L is constant and for the particular case of (10),
  .
.
Note that the free integral is a function of t. When flow F(t)=0, the added exponential function represents the aorta diastole pressure i.e.
 (12)
(12)
There are several feasible scenarios on the diastolic pressure, i.e. (12). The average diastolic pressure is a positive constant achieved at t=td, where td represents the collapsing of F(t) to idle systolic flow, which may be considered F(t) = 0 for a normalized F. In other words, the local minimum value of F is normalized to zero. Thus, in this case Pd (t) is a positive constant representing the diastolic pressure at rest (i.e. idle flow) which leads to:
 (13)
(13)
For t>td, the part depending on the diastolic contributes:
 (14)
(14)
while the initial pressure P(td) represents the aortic diastolic pressure at td.
Windkessel model assumes constant resistance R, i.e. (10) [23]. This assumption may not be suitable in case of mammalian blood pressure, where resistance may change over various body location and time. The resistance strongly depends on the local vessel elasticity or stiffness, even though in the most severe scenarios of blood vessels stiffness, certain local flexibility still exists and therefore may generate functional resistance.
We suggest a spatial-temporal functional resistance to (10) in the following form:
 (15)
(15)
where X= (x1, x2, x3) = (x,y,z) and Fxj stands for the change in the spatial component xj and
 (16)
(16)
where G (X,t) represents a spatial-temporal resistance function. A convenience resistance function would be a separable function, i.e.
G (X,t)=G1(X)∙G2(t)
The change of the blood flow from one spatial location, i.e. (x0,y0,z0), into another spatial location (x1,y1,z1) will be further study in order to better understand the change in the pressure flow in various points of measurement.
The model above takes under consideration the change in time as well as in the spatial location. For the purpose of this paper we simplify the model into temporal function at a fixed (constant) location, i.e. X=X0. Therefore the spatial change leads to zero and the multiplication of the constants c and a is defined as the new constant c. P(X,t). becomes a function of t.
 (17)
(17)
where G(t) reflects 1D temporal resistance function (16,17), i.e.
 (18)
(18)
Equation (17) is a linear ODE which has a direct solution in the form of:
 (19)
(19)
where  (For detailed solution see Appendix B).
The Laplace domain of (17) takes the following form:
 (20)
(20)
where the sign '*' means a convolution over the Laplace domain. The main reason for using Laplace transform is attributable to the initial conditions at P (0). Although using the Laplace domain may provide an additional way for extracting blood pressure, it will not be discussed here.
Functional resistance i.e. (17) may provide wider consideration to (10). Considering various polynomial orders of G(t) by associating:
 (21)
(21)
where td>0 is a constant and n=0, 1, 2, 3, 4…
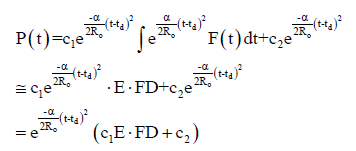
The case of n=0 is considered in (10) and the solution thereof is given in (11). The case of n=1 provides a Gaussian shape resistance function. R0 is considered the temporal initial resistance or base resistance constant. This solution leads to the following model:
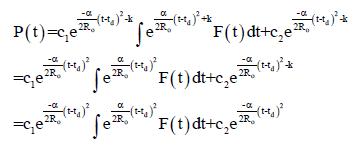 (22)
(22)
The free coefficient depending on k is integrated within the coefficient c2, i.e. c2 = c1e-k. Equation (22) can be estimated as follows:
 (23)
(23)
Where the constant  T= Max (te – td, td – ts) and
  is a simple rectangle integral approximation. FD represents an approximation of the beat2beat volume change of F(t) in the time interval T=(te - ts). Equation (23) may provide rough estimation of the beat2beat blood pressure flow. Figure 7a, which is presented later in this paper, elaborates the idea.
Equation (19) is a theoretical and practical consideration for a Gaussian shape resistance function. Other potential polynomial degree or other resistance functions can be used. In addition, the above rough integral approximation could easily be improved. In practice, in order to compute the blood pressure (systolic and diastolic), additional information is required and a certain state machine is needed to take care of the emitted light, the absorption level, a-priori data information, etc.
Other machines may use the combination of oscillometric blood pressure and hemodynamic flow, whereas the oscillometric blood pressure may provide initial blood pressure and certain indications for the continuous hemodynamic blood pressure estimation.
Initial blood pressure
The first hemodynamic blood pressure measurement is tricky and complicated. The following bio conditions have been considered in the calculation of the initial blood pressure and in particular for the coefficients α and R0: (a) local tissue perfusion, (b) local tissue temperature, (c) peripheral pulse waveform flow, (d) absorption levels, (e) light energy emitted at various wavelength, (f) device temperature, (g) pulse, (h) Vf- fingertip volume, etc. Fingertip volume and additional information regarding the blood flow such as velocity may be estimated by using additional electronic component such as an ultrasonic component.
A state machine considering the above points, various situations of the temporal blood pigmentation and pre-study have been used to determine various resistance parameters in order to compute the initial blood pressure.
Feedback
The Feedback mechanism allows better control for the pressure flow during beat2beat flow. A feedback machine may have the following structure as presented in Figure 4.
This paper presented the TensorTip MTX device and its mathematical model for computing hemodynamic blood pressure. The TensorTip MTX device incorporating the above described method was evaluated clinically and during the marketing process. The first clinical trial was performed in Carmel & Lin daycare Medical centers (Haifa, Israel) using ambulatory patients from the liver and diabetes daycare clinics and on healthy participants as well. Results were compared with manual and automatic arm cuff blood pressure measurements. An additional trial was carried out in the Morristown Memorial Medical Center (MMMC) located in New Jersey, USA. The trial was conducted in the recovery room on patients recovering after heart surgery, compared to an in line blood pressure tube.
A total of 118 members participated in these two studies, giving a total of 603 measurements. In the Carmel & Lin Medical centers study 273 measurements were taken from 54 participants, while in the MMMC study 330 measurements were taken from 64 patients.
In the Carmel & Lin Medical centers the measurements were performed using indoor conditions, at normal room temperature and while the participant was seated. Three arm cuff references readings were taken from each participant during this study. Reference devices included two automatic oscillometric blood pressure monitors and one manual oscillometric blood pressure monitor. The most agreeable result was considered between the references and the TensorTip MTX.
In the MMMC study patients were monitored in the recovery room with their equipment and by experienced critical care nurses. Noninvasive TensorTip MTX measurements were performed and compared to the simultaneous arterial in line routine hemodynamic measurements. It should be mentioned that a small number of tests (~7.5%) were not able to be assessed by the TensorTip MTX device in the MMMC trial. This was presumed to be related to a local hypothermia resulting in cold finger state following a cardiac surgery that led to low blood pressure due to low blood perfusion in the fingertip.
Figure 5 displays the systolic and diastolic blood pressure measurements comparison. For the Lin & Carmel Medical centers trial the average of the reference was 131.2 and 76.5 mmHg for the systolic and diastolic blood pressure, correspondingly. Whereas for the TensorTip MTX the average was 131.8 and 76.2 mmHg for the systolic and diastolic blood pressure, respectively. Standard deviation was calculated twice: (a) Sn- standard deviation of the number of measurements, and (b) Sm- standard deviation of the number of subjects. In Lin & Carmel Medical centers Sn was 5.52 mmHg and Sm was 3.72 mmHg for the systolic blood pressure. For the diastolic blood pressure Sn was 4.72 mmHg and Sm was 3.97 mmHg.
For the MMMC trial the average of the reference hemodynamic measurements was 109.3 and 56.0 mmHg for the systolic and diastolic blood pressure, correspondingly. The average of the TensorTip MTX was 108.7 and 55.7 mmHg for the systolic and diastolic blood pressure, respectively. For the systolic blood pressure Sn was 7.98 mmHg and Sm was 4.67 mmHg, while for the diastolic blood pressure Sn was 7.50 mmHg and Sm was 4.78 mmHg. Both trials were analyzed according to the ISO 81060-2 and fulfilled its accuracy requirements.
As was described above, the TensorTip MTX device can measure several hemodynamic parameters, among them are blood pressure, Mean Arterial Pressure (MAP), cardiac output, etc. The obtained values are displayed on the device’s screen as illustrated in Figure 6. The number shown on the left represents the measured pulse; the numbers on the middle signify the blood pressure; and the number on the right stands for SpO2. Additional bio-parameters are shown in the next screens of the device such as hemoglobin, hematocrit, cardiac output, stroke volume, etc. and will be presented in our next papers.
Figure 7 displays various measurements of the systolic and diastolic amplitudes. Figure 7a displays the computed P(t) pressure waveform normalized to zero, and also elaborates (23). Ts represents the normalized starting point of the systolic blood pressure, Td represents the max local systolic and Te is the final normalized end point of the systolic. The diastolic is combined with the systolic in the slope between Td to Te during pressure release towards a steady state before next pumping. Figure 7b shows a relatively high systolic and diastolic blood pressure waveform, while Figure 7c indicates on a relatively low systolic pressure, diastolic pressure and cardiac output. Figure 7d, when compared to Figure 7c, demonstrates a relatively normal systolic pressure, diastolic pressure and improved cardiac output. Due to hypothermia or low blood perfusion there may be noisy input signals. Three different types of noisy pressure waveform P(t) can be found in Appendix C.
Geyser
During our investigation we discovered a phenomenon that we named “geyser”. A relatively high cyclic temporal peak of at least one of the temporal color histograms is called a “geyser”. In Figure 8 below we can identify a burst in the blue color histogram. The burst may be shifted to the other colors during the measurement. We consider this burst a “geyser” if the burst is cyclic (repeats itself, no matter which color) and is relatively high compared with a normal burst that may be caused by the cardiovascular. We have found that not every subject has this “geyser” phenomenon, for some people we have identified the “geyser” and for others we saw just a normal burst. Further studies still need to be done.
In conclusion, this paper presented a new method for computing hemodynamic blood pressure noninvasively incorporated in the new models known today use a constant resistance in Windkessel model [23]. However, in our work an extended model was provided, emphasizing the fact that functional resistance should be taken into consideration.
This technology uses a color image array sensor which provides rich information. In our device there is a use of four discrete light sources at different wavelengths where each one represents different color diffusion. The flow pressure is observed as an optical pressure diffused over the image sensor surface. The color image sensor provides continuous spectrum, e.g. ~380 nm- ~1000 nm. For comparison, a regular oximeter has only two light sources and two narrow band sensors that are being used for each wavelength [19-21].
In the clinical trials the TensorTip MTX performed quite well both for standard blood pressure measurements and also for individuals who were subject to alterations in blood pressure following cardiac surgery.
The author would like to thank Prof. Eli Zuckerman, head of the liver department in Carmel and Lin medical centers, Dr. Frank Smart from MMMC of the Atlantic health system, and both their institutes for their help and support during the clinical trials. BIRD Foundation (Israel-U.S. Binational Industrial Research and Development Foundation) and Texas Instruments are highly appreciated for their valuable support in the development of the TensorTip MTX device. In addition, the author greatly acknowledges the help of Dr. Ella Sheiman, Dana Segev, Michal Shasha, Mor Ram-On, Shahar Miller and Gillian Links-Makmal for their valuable contribution to this paper.