Journal of Geography & Natural Disasters
Open Access
ISSN: 2167-0587
ISSN: 2167-0587
Research Article - (2022)Volume 12, Issue 4
The paper proposes a new mobility model. For a mobile and geographic cross-layer architecture. This crosslayer architecture allows service differentiation between real-time and best-effort traffic. For a mobile internet of things (IoT) network. We present a mathematical model, which works on the parameters of the MAC layer and the network layer. The mathematical model makes it possible to calculate the throughput, between a source object and a destination object (gateway). Under conditions of stable queues. We use the positional (geographic) information in the mathematical model of the proposed cross-layer architecture. To study the impact of mobility on the performance of the proposed mathematical model. The proposed mobility model defines two time intervals. The first interval for communication (transmission and reception of data without mobility at the same time). And the second time interval for the mobility of objects of the IoT network (without communication at the same time). The results show that the calculated throughput depends on the position of the objects, as well as the probability of transmission. Finally, we study the effect of distance and speed on the performance of the proposed cross-layer architecture.
Mobility model; Quality of service; MAC layer; Network layer; Geographic cross-layer architecture; Service differentiation
The internet of things connects billions of things and billions of people. It can now be considered one of the most powerful tools for creating, modifying, and sharing a great deal of information. Indeed, the objective of the IoT is to dialogue between objects and individuals. It promises to be the engine of major transformations in the lives of individuals and of new uses and services in the mobility sector. That is why IoT experts believe that a small percentage of its potential is being tapped today. Therefore, it is compared to the internet of the future.
At the heart of the internet of things is the object’s ability to intercon-nect and interact with its physical environment. It therefore includes: objects directly connected to the internet, machine to machine (M2M), which refers to communication between machines and access to the information system without human intervention, including bluetooth, RFID (Radio Frequency Identification), Wifi (Wireless Fidelity), 4G (Fourth Generation), and 5G (Fifth Generation), smart connected devices such as tablets or smart-phones. In themselves, it is all the objects con-nected to each other and to the network that capture, store, and transmit data.
The internet of things works mainly with sensors and connected objects placed in physical infrastructures. These sensors will then emit data that will be fed back using a wireless network on IoT platforms. They can thus be analyzed and enriched to derive the best information. These data management and data visualization platforms are the new IoT solutions that allow territories, companies, or even users to analyze data and draw conclusions to be able to adapt good solutions. The IoT is closely linked to connected objects because they have the capacity to capture data and send it via the internet network or other technologies. Connected objects interact with their environment through sensors: temperature, speed, humidity, and vibration. In the internet of things, an object can be a vehicle, an industrial machine or even a parking space.
The authors of the article [1] discuss Narrowband internet of things (NB-IoT). NB-IoT considers mobility only with cell selection in the inactive state. They provide the characteristics of NB-IoT cell selection and a methodology for the optimization of cell selection parameters. In the research study [2], the authors present a new mobility paradigm for IoT. Based on Open Flow Software Defined Network technology. To solve existing mobility issues, satisfy collaborative IoT interactions, and extend mobility coverage for service providers. In [3] the broadcast approach is proposed as a solution to the problem of the mobile producer in the network. Then the result can solve the legacy problems of triangular routing in network mobility. And to support IoT integration. In article [4], authors address an important remark regarding the communication of IoT devices. And that IoT objects have characterized by different mobility compared to traditional mobile devices like cell phones. They offer IoT communication, and a mobility architecture based on routing. This routing architecture uses a data structure to store routing information. In paper [5], the authors propose a mobility management technique for smart factories. Which uses the IoT technique, in a sensor-based network. The performance analysis that was carried out. Which takes mobility into account, shows that the proposed technique is effective compared to the PMIPv6 technique (Proxy Mobile Internet Protocol Version 6). In the research study [6] the authors propose an IoT-based mobility information network. Mobile nodes with different sensors organize a large-scale information infrastructure. With a very economical mobility network environment. In [7], the authors propose the CoAP protocol (Constrained Application Protocol) and the CoMP protocol (CoAP-based Mobility Management Protocol). The latter protocol allows mobility management for IoT objects. CoMP keeps track of the current Internet Protocol (IP) addresses of mobile sensors and allows data to be transmitted reliably to web clients using CoAP. In article [8], the authors present the mobilityaware maximization of network lifespan for battery-powered IoT applications. Which perform approximate real-time computation under the constraint of quality of service. Optimal job scheduling considering mobility that maximizes network lifespan using linear programming technique. The authors of the article [9] discuss mobility management. Which is an important process for tracking and locating user equipment. Including IoT objects. While moving across the network. The authors propose a new solution called mobility tracking. This solution has four features to achieve the goals of 5G (Fifth Generation). Article [10] discusses the use of ICN (Information Centric Networking) as a communication model in IoT environments. To solve the problem of mobility. We pass on the works that study the fusion between ICN and IoT. Then we describe the approach of evolution and advanced mobility. They also present a discussion of the main challenges when using ICN as a communication catalyst for mobile IoT.
In this article, we propose a new mobility model for IoT network. This mobility model defines two time intervals. One for communication without mobility. And the second for mobility without communication. This mobility model is intended for a cross-layer architecture. Which offers a service differentiation mechanism between real-time and best-effort traffic, at the network layer level. And the notion of priority at the access level, in the MAC layer. The network layer is modeled by three queues, a queue for sent real-time packets, a second queue for sent best-effort packets, and a third queue for own packets. The objective of the article is to study the impact of mobility, distance and speed on the performance (throughput) of the proposed cross-layer architecture. The results obtained show that the throughput depends on the positions of the objects (distance between the source and the destination) and the transmission probability.
The remaining of this paper is organized as follow: Section II gives more details about mobility in IoT networks. Section III presents the model formulation. Mobility model and stability queues is introduced in section IV. Section V discusses numerical analysis and simulation re-sults. And finally, Section VI summarizes this article and presents some perspectives.
Mobility in IoT networks
In a mobile IoT network, each object is attached to a mobile device or a movement system that allows objects to be moved to accomplish these tasks. Depending on the degree of mobility, the topology of the mobile IoT network changes frequently. Indeed, for an object to know its neighbors, the network requires a large number of control messages, and therefore a significant expenditure of energy. In some scenarios, the mobile IoT network considers both object and destination (gateway) mobility as well. In this case, mobility becomes the main problem.
A simple object is made up of three basic functions: The reception func-tion, the acquisition function and the transmission function. For a mo-bile object, the location function is added in the object to allow the mo-bile object to locate itself in the IoT network and discover its neighbors. This function adds the geographic routing mechanism to forward mes-sages to the destination (gateway). Each location function receives the coordinates of neighboring objects. Then a decision will be made to choose the neighboring object that will be the next jump. This localiza-tion function also makes it possible to synchronize all the objects of the IoT network.
IoT networks are made up of a set of fixed objects but also objects placed on mobile elements. These mobile objects can be used in differ-ent applications. This mobility can produce difficulties in the transmis-sion of data at the level of the MAC layer, since a mobile object can participate in the communication. Communication protocols for IoT networks propose to distribute the slots to allow mobile objects to par-ticipate in communication. But this solution generates a lot of control messages which can reduce the energy of the object and reduce the lifespan of the IoT network. At the network layer level, the communica-tion protocols proposed to solve the mobility problem are generally ge-ographic protocols. This type of protocol makes it possible to avoid in-formation overload to know the topology of the network. It is based on the assumption that all objects know their positions using a Global Posi-tioning System (GPS). Nowadays, new communication protocols, for IoT network based on the mobile ferry solution. Which is a mobile relay collecting information from a static or quasi-static objects to the destination (gateway). And distributing the messages from the destination (gateway) to the corresponding objects. These proposed protocols exploit the reliability aspect of objects. Which takes into account energy resources and the possibility of having faulty objects in the IoT network at the level of their designs. Other protocols proposed for IoT network offer the collection of data through the mobile destination, to conserve energy of network objects. The movement of the destination is predestined according to the type of monitoring application.
Model formulation
In this section, we give the assumptions of this study and we give the notations of the modeling. We also prove how the IoT network works and amounts that determine the all performance of the IoT network.
Assumptions and definitions: We model the IoT network by a set of objects N, and several destinations (gateways) D. these objects are randomly distributed in a 2D area.
We model the network layer of each object i by three queues. The queue dedicated to the own packets of each object i, the queue Ri reserved for real-time packets sent from the object i, the queue Bi reserved for best-effort packets sent from the object i, the object i decides to send a real-time packet from the queue Ri with a probability


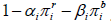
Three queues are associated with each node i. The first queue i Q carries own packets of node i itself. The second queue carries the real-time traffic crossing node i, it is denoted by Ri and the third one which carries best-effort traffic, it is denoted by Bi . We assume that the three queues have infinite storage. Selection of these queues is performed using a weighted fair queuing scheme. In the beginning of each transmission cycle, the node i choose to send from Ri with probability


Network layer: We model the network layer by three queues. We present the parameters and notations used in this article.
αi: The probability of selecting a real-time packet from the queue Ri.
βi: The probability of selecting a best-effort packet from the queue Bi.
Rs,d : All the objects intermediate between the source s and the destination d (the source s and the destination d are not included in the path).
Ri,s,d : All objects , Rs, i ∪i in the path between source s and destination d.
Ji,s,d : The neighbor object of i which comes after the node i in the path Rs,d.


MAC layer: When an object i has a packet to forward to the destination. It uses a Pi probability to access the channel. This probability is given by the Bianchi model of the 802.11 standard [11].
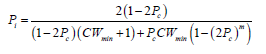
Pc : The probability of collision, knowing that a transmission attempt is made.
CWmin : The minimum window of Backoff contention.
CWmax : The maximum window of Backoff contention. And we have [12]

Cross-layer architecture: Figure 1 shows the cross-layer architecture of the object i. We start by selecting the queue that will send the packet from the network layer. Then the packet is moved to the MAC layer. Where it will be forwarded and retransmitted if necessary. Until the packet is successful or dropped.

Figure 1: Network layer and MAC layer of object i.
We present the main parameters for a general network layer.
Pi : The probability of transmission on the channel of the object i.
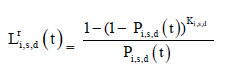
Pi,s,d : The probability of successfully transmitting of the object i, on the path from source i to destination d.
Ki,s,d : The maximum number of transmissions allowed for a packet sent from the object i, on the path from source i to destination d. After i,s,d K failures, the packet is rejected.
Li,s,d : The expected number of attempts until a packet of object i, on the path from source i to destination d was successful or rejected.
Mobility model and stability queues
We consider an IoT network distributed randomly in a 2D geographic area. Objects can change their position in time after tx second. For a period which can go up to ty second. With any speed which may vary between ( vmin, vmax ) m/s. Each object of the mobile IoT network can move in any direction. With the angle varying between [0, 2π ]. All objects cannot send or receive packets when they change their positions.
We map the area to a row for analysis. The destination (gateway) of the mobile IoT network can be anywhere in the 2D area. In this article, we assume that the destination (gateway) can be mobile. Each object having packets to send to the destination (gateway), chooses its neighbor j which allows it a minimum distance between itself (the source object) and the destination (gateway). This transmission strategy means that we must list all the possible paths between the source and the destination.
Then we choose the path with the smallest distance. Each node can transmit messages to its neighbors j at a distance d associated with a decreasing function k(d).
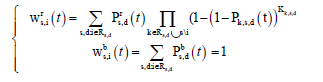
Each object i has 4 main parameters, which are , , , , , Pi Ki s d αi βi to manage the stability of the queues, and to calculate the end-to-end throughput between the source s and the destination d (gateway). Let i be an intermediate object between source s and destination d. Let Ji,s,d be the neighbor object of object i in the path Rs,d. And N(i) the set of neighbors of object i. The probability of successful transmission from object i in the path between the source s and the destination d is;

Let t be the time parameter, which represents the instant t in which we have calculated the probability of successful transmission.
In this article, the rate function resulting from losses in the wireless medium considers some attenuation in the direct path. Let β = 2α the path loss factor, then;

The path loss factor, β = 2α , is a measure that helps explain how a radio signal loses power over the distance the atmosphere travels. It is inversely proportional to the wavelength of the signal and proportional to the distance traveled.
The expected number of attempts till success or dropping of realtime packet from object i on route Rs,d is:
And the number of attempts till success or dropping of best-effort packet from object i on route Rs,d is:

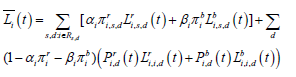
By running application, if


Then the average number of attempts per packet possible paths for real-time and best-effort traffics is:

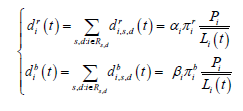
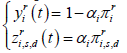
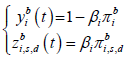
The departure rate
Proposition 1: The departure rate of real-time and best-effort packets from object i related to connection Rs,d are;
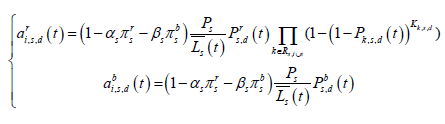
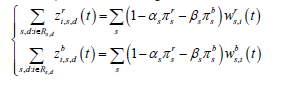
The arrival rate
Proposition 2: The arrival rate of real-time and best-effort packets from object i related to connection Rs,d are:
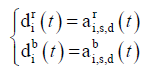
The rate balance equations
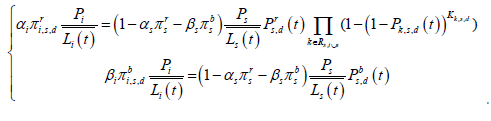
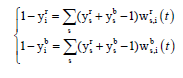
The queue Ri and Bi are stable, if the departure rate is greater than or equal to the arrival rate. We consider the case of equality between the departure rate and the arrival rate. We have;
Then,
We pose for real-time traffic;
And for best-effort traffic, we pose:
So we get:
Then, the new expression for the rate balance equation becomes;

Where,
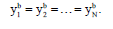
The system of equation (14) becomes linear when


.
This is exactly the case where we have


In this case, the system of equation (14) can be written in the following form;
With;
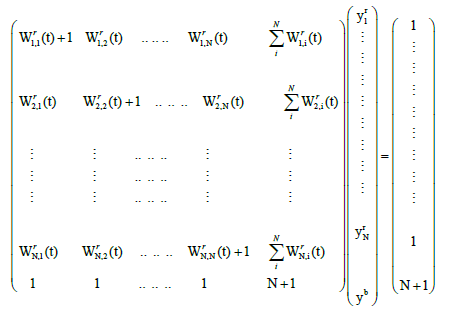
We present the system of equation (16) by;
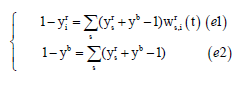
Equation (e1) of the system (18) represents a matrix of N * N. Equation (e2) is a one-dimensional row vector, because we have
Therefore the system (18) can be written in matrix form which we can easily solve;
Numerical analysis and simulation results
In this part, we consider a set of objects of a mobile IoT network. Each object having information to send to a destination. Uses our cross-layer architecture as a communication protocol. As well as our mobility model. To transmit the information to a destination gateway, that is connected to the Internet. As a result, this information is usually stored in the cloud. It is analyzed using Big Data models. To finally extract useful information. To send it to an end user, for control and decision making.
We are deploying a mobile symmetric mobile IoT network. Consisting of 14 objects covered by a single fixed destination (gateway). In an area of 1000 m 1000 m. We choose the parameters ki,s,d ≡ k , αi≡ α, βi ≡ β and Pi ≡ P . So as to have the stability of the system. The objects in these experiments are modelled using á = 0,5 = 0,3 ; k=4. With a transmission probability i P varying between 0 and 1.
In this part, the objects can change their positions after each 2 second. For a period which may be up to 5 second. With speed varies between [0, 10] m/s. (ach object of the network can move in every way. With angle varies between (0, 2π ). All objects network can’t send or receive packet when they change their positions. In the first scenario, we change object positions over time. Which produces a change of network topology. To study the impact of mobility on throughput performance. We also vary transmission probability from 0 to 1. To study his impact on throughput performance. In the second scenario, we change distance between one object and destination (gateway), and speed mobility in order to study the impact of distance and velocity on throughput performance.
Impact of mobility
Figures 2 and 3 show the impact of mobility in real-time and besteffort throughput. We notice that when we change the positions of the objects over time. Which produces a change in the topology of the IoT network. The real-time and best-effort throughput changes. With an increase or decrease depending on the scenario of the mobility of the network. And when we increase the probability of transmission in the network. The real-time and best-effort throughput increases. After that the throughput begins to decrease until it becomes zero. This decrease is justified by the collisions which become important in the network. When the probability of transmission for the objects is increased.

Figure 2: Impact of mobility on real-time traffic. Note: (


Figure 3: Impact of mobility on best-effort traffic. Note: (


Impact of distance and velocity
We vary the distance between the objects and the destination (gateway). We are changing the speed of mobility of objects. To study the impact of distance and speed on the performance (throughput), of the proposed cross-layer architecture.
The first scenario: The first scenario presents the case where the mobility of objects produces less distance, between the source objects and the destination (gateway).
Figures 4 and 5 show that as the distance between the source object and the destination (gateway) decreases. Our cross-layer architecture produces more real-time and best-effort throughput. This result is justified by the probability of successful transmission. Which becomes important when we decrease the distance between the source and the destination. And that depends on the distance in its mathematical expression.

Figure 4: Impact of distance on real-time traffic in the first scenario. Note: (


Figure 5: Impact of distance on best-effort traffic in the first scenario. Note: (


In this scenario, in which the distance between the source and the destination (gateway) decreased. Figures 6 and 7 show that as the speed of mobility of the source object, destination, and the intermediate objects between source and destination is increased. The real-time and best-effort throughput increases. This result is justified by the distance which becomes decreased. And consequently the probability of successful transmission which increases. In this case, more speed produces less distance between the source and the destination.

Figure 6: Impact of speed on real-time traffic in the first scenario. Note: (


Figure 7: Impact of speed on best-effort traffic in the first scenario. Note: (


The second scenario: The second scenario presents the case where mobility produces more distance, between the source object and the destination (gateway).
Figures 8 and 9 show that more the distance between the source object and the destination (gateway) increases. Our cross-layer architecture produces less real-time and best-effort throughput.
This result is justi-fied by the quantity of the lost packets which becomes important. By the fact that the probability of successful transmission becomes dimin-ished. As the distance between the source and the destination is in-creased. And the fact that the probability of successful transmission depends on the distance in its mathematical expression.

Figure 8: Impact of distance on real-time traffic in the second scenario. Note: (


Figure 9: Impact of distance on best-effort traffic in the second scenario. Note: (


In this scenario, in which the distance between the source and the desti-nation (gateway) increases. Figures 10 and 11 show that as the speed of mobility of the source object, destination, and the intermediate objects between source and destination is increased. The real-time and best-effort throughput decreases. This result is justified by the increasing distance. Therefore the quantity of lost packets which becomes im-portant. And the probability of successful transmission which decreases. In this case, more speed produces more distance between the source and the destination.

Figure 10: Impact of speed on real-time traffic in the second scenario. Note: (


Figure 11: Impact of speed on best-effort traffic in the second scenario. Note: (


The third scenario: A third scenario can be distinguished. In the case the distance between the source and the destination (gateway) remains fixed (does not change). Including the distances between the intermediate objects, between the source and the destination, which remain fixed also. In this case, the real-time and best-effort throughput remains stable. We notice a superposition between the throughput of different scenarios (different streams), between the source and the destination (Figures 12 and 13). And when the speed of mobility is increased or decreased. The real-time and besteffort throughput remains stable. All these results are justified by the probability of successful transmission. Which depends on the distance. And which remains fixed when the distance between the source and the destination is fixed. In this case, even if the objects change their positions (source object, intermediate objects, destination). The distance between the source and the destination, thus between the intermediate objects remains fixed.

Figure 12: Impact of distance and speed on real-time throughput in the third scenario. Note: (


Figure 13: Impact of distance and speed on best-effort throughput in the third scenario. Note: (


In this article, we propose a new mobility model. For a cross-layer architecture. For mobile internet of things network. This mobility model defines two time intervals. The first time interval for communication between objects (transmission and reception of data), without mobility of these objects. The second time interval for the mobility of objects without communication between these objects. This cross-layer architecture uses the service differentiation mechanism between real-time and best-effort traffic, at the network layer level. And it adds the notion of priority of real-time traffic over best-effort traffic, in MAC layer access. The main objective of the proposed cross-layer architecture is to calculate the throughput, between a source object and a destination (gateway). Under conditions of stable queues. In this paper, we have shown the impact of mobility (object positions), distance and speed on the performance (throughput), of the proposed cross-layer architecture. The results show that the calculated throughput depends on the positions of the objects, and the probability of transmission.
As future work, we propose to study the impact of mobility, distance, and speed on the performance (throughput) of the proposed crosslayer architecture. In the case of a mobile IoT network, which introduces the notion of clustering in the network.
Citation: El-Mezouary R, Souissi A (2022) New Mobility Model for Mobile and Geographic Cross-layer Architecture for Mobile IoT Networks. J Geogr Nat Disasters. 11: 257.
Received: 25-Oct-2022, Manuscript No. JGND-22-19816; Editor assigned: 28-Oct-2022, Pre QC No. JGND-22-19816 (PQ); Reviewed: 14-Nov-2022, QC No. JGND-22-19816; Revised: 21-Nov-2022, Manuscript No. JGND-22-19816 (R); Published: 28-Nov-2022 , DOI: 10.35841/2167-0587.22.12.257
Copyright: © 2022 Mezouary ER, et al. This is an open-access article distributed under the terms of the Creative Commons Attribution License, which permits unrestricted use, distribution, and reproduction in any medium, provided the original author and source are credited.