Journal of Nutrition & Food Sciences
Open Access
ISSN: 2155-9600
ISSN: 2155-9600
Research Article - (2022)Volume 12, Issue 2
Background: Determine the nutritional value of the food provided to the average patient in the nursing home and compare to the guidelines for the age matched community dwelling individual.
Methods: We obtained weekly meal plans. Nutritional value of each meal was calculated from the USDA food composition database with reference to the supply company. The 3 nursing homes ranged in ownership and in star rating and averaged 120 beds per facility. Food companies were comparable.
Results: Patients received 1.58 cups of vegetables with a standard deviation (SD) of 0.31 daily. 1.26 cups of fruit (SD of 0.08) and 0.79 cups of dairy (SD 0.26) daily. Average of 5,308 mg of sodium (SD 770.4) daily. 474.08 mg of added sugar (SD 137.88) daily. Saturated fats were 10.86% (SD 0.01) of the calories.
Conclusion: Intake of fruits, dairy and vegetables was below recommended levels. Calories and sodium were above recommended values. Added sugar and saturated fats were within recommendations. Several changes can be made to improve nutrition in the nursing home to bring the nutrition closer to expectations in the average community dwelling adult values. We recommend further study concerning interventions.
Proanthocyanidins; Gel; Characterize; HPLC
(USDA) United States Department of Agriculture; (DHHS) Departments of Health and Human Services; (SD) Standard Deviation; (CMS) Centers for Medicare and Medicaid Services
CMPG Nutrition plays a vital role in the health and wellness of older adults. Dietary changes are often recommended to treat chronic medical diseases and can affect multiple organ systems [1,2]. Weight loss is used to monitor for health status changes and is associated with increased morbidity and mortality. Proper protein and dairy consumption can slow changes such as osteoporosis and decrease the risk of fracture with falls [3,4]. Given these factors, the optimization of diet for nutritional value and medical care needs to be reflective of their home diets and national dietary guidelines. Individualization of meals is very limited therefore it is essential to offer a well balanced diet options [5,6]. In this regard the national guidelines for the older adult can offer guidance to direct the meal options [7,8].
There are national guidelines from the US Departments of Health and Human Services (DHHS) and Agriculture (USDA) with dietary recommendations for community dwelling healthy older adults [9]. The recommendations are age and gender specific but do not incorporate weight or individualization for comorbid health conditions with dietary restrictions. No such national recommendations or guidelines have been established for the nursing home or assisted living individual. Our investigation set out to determine the nutritional value of the food provided to the average patient in the extended care facilities and compare this to the guidelines for the age matched community dwelling individual.
We obtained the weekly meal plan from three nursing homes from different star levels and different types of ownership. Each meal plan consisted of one week of meals with 3 meals a day for the standard patient and was not age, gender, texture or disease modified. The studied nursing homes ranged from 3 to 5 star ratings. The facilities were chosen based on several factors including facility interest in participation in study, facility availability for study, variation in ownership. We attempted to represent differing ownership styles while maintaining similar geographical location and facility size. The facilities ranged in size from 100 to 150 beds. The ownership included privately owned for profit, not for profit publicly owned and family owned. While obtaining each of the weekly meal plans we had a discussion with the food service manager and the in facility dietitian. In this study, no questions were addressed to or about the patients.
We confirmed how the meal plan was created including what involvement the dietitian and nutrition specialists at the respective facilities had in the creation of the meal plan. At each facility, it was also confirmed that the meal plans we obtained were representative of a typical meal. It was confirmed at all 3 facilities that the meal plans came from the same outside vendor. The nutritional value of the meals were calculated based on the USDA food composition database; with reference to each supply company and were compared to national recommendations [10].
Units of measure were based on each USDA food type recommendation and included total calories, cups of fruit, cups of vegetables, cups of dairy, milligrams of sodium, milligrams of sugar and percentage of saturated fats. As the recommendations are made based on these units of measure, this is how our data was collected and will be represented. The data was entered into a Microsoft Excel 360 database for analysis for each facility studied and referenced to national recommendations. The daily and weekly averages for each unit of measure were calculated for each facility. Using the data, we determined the standard deviation in reference to each facility individually. Daily average intake with standard deviations was compared to the age match national recommendations.
The USDA makes recommendations concerning several food types.
These recommendations are age and gender specific. The average male over 50 years old should be eating 2,000 calories including 2.5-3.5 cups of vegetables, 2-2.5 cups of fruits and 3 cups of dairy daily. The average female over 50 years old should eat 1,600 calories including 2-3 cups of vegetables, 1.5-2 cups of fruits and 3 cups of dairy daily. The recommendations were the same between the age matched genders with 2,300 mg of sodium daily, 11% of the daily calories coming from saturated fats and 1,200-1,800 calories of added sugar daily.
The average daily nutrition servings for vegetables, fruit, grains, dairy, protein, added sugar, saturated fats, sodium, and the overall daily calories are compared to the recommended daily serving size for males and females. The statistical significance of the differences is calculated using a one sample t-test and computed using SPSS.
When comparing to the recommended daily servings for men over the age of 50, all nutritional benchmarks were significantly different from the recommended daily servings, except for grains. Vegetables, fruit, and protein were significantly less than recommended and percentage of saturated fats and daily calories were significantly more.
When comparing to the recommended daily servings for women over the age of 50, all nutritional benchmarks were significantly different from the recommended except for fruit. Vegetables and protein were significantly less, while grains, percent of saturated fats, and daily calories were significantly more than the recommended daily servings. For combined recommendations, dairy and added sugar are significantly less and sodium is significantly more. All values are denoted in the Table 1 below.
Table1: Nutritional goal daily serving, statistical significance and mean difference.
| Nutrition goal | Average daily serving | Recommended daily serving | Statistical significance (p-value) | Mean difference | |||
|---|---|---|---|---|---|---|---|
| Male | Female | Male | Female | Male | Female | ||
| Vegetables (cups) | 1.58 | 2.5-3.5 | 2-3 | <0.001 | 0.006 | -0.92 | -0.42 |
| Fruit (cups) | 1.26 | 2-2.5 | 1.5-2 | <0.001 | 0.096 | -0.74 | -0.24 |
| Grains (grams) | 317.47 | 170-283 | 141-198 | 0.384 | 0.006 | 34.47 | 119.47 |
| Protein (grams) | 101.58 | 155-198 | 141-170 | <0.001 | <0.001 | -53.42 | -39.42 |
| Saturated Fats (%) | 30.33 | 10.8-11.2 | 11 | <0.001 | <0.001 | 19.13 | 19.53 |
| Daily Calories | 2527.92 | 2000 | 1600 | <0.001 | <0.001 | 527.92 | 927.92 |
| Dairy (cups) | 0.79 | 2.9-3.1 | <0.001 | -2.11 | |||
| Added Sugar (kcal) | 118.52 | 1200-1800 | <0.001 | -1081.48 | |||
| Sodium (mg) | 5308.2 | 2300 | <0.001 | 3008.2 | |||
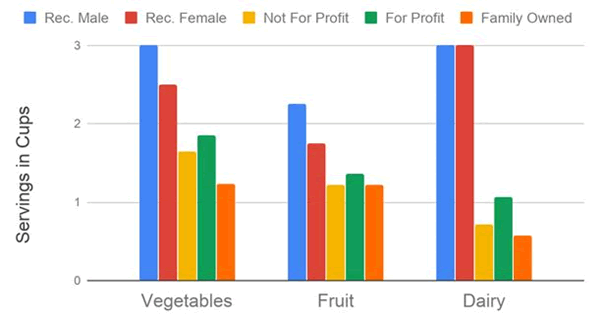
The following charts demonstrate the USDA recommendations and nutritional data from the 3 different nursing homes that we investigated. As demonstrated in Figure 1, on average the patients received 1.58 cups of vegetables with a standard deviation (SD) of 0.31 per day and had a statistical significance with a p<0.001 for males. Each day patients got 1.26 cups of fruit (SD of 0.08) which was statistically significant for men. With only 0.79 cups of dairy (SD of 0.26) this was statistically significantly low for both men and women.

Figure 1: Nutritional Value National vs Facility.
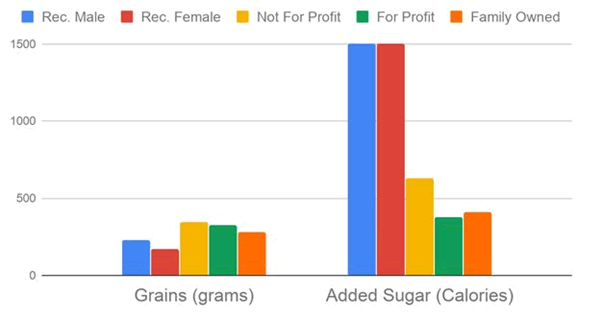
There was only 474.08 mg of added sugar (SD of 137.88) in a day which is demonstrated in Figure 2 and was significantly different than recommendations with a p<0.001. Saturated fats made up 10.86% (SD of 0.01) of the daily calories. There were statistically significant differences between the average daily serving of saturated fats and the recommended (p<0.001) when compared to both the male and female recommendations. The percentage of saturated fats served was about 19.5% higher for females and 19.1% higher for males.

Figure 2: Nutritional Value National vs Facility.
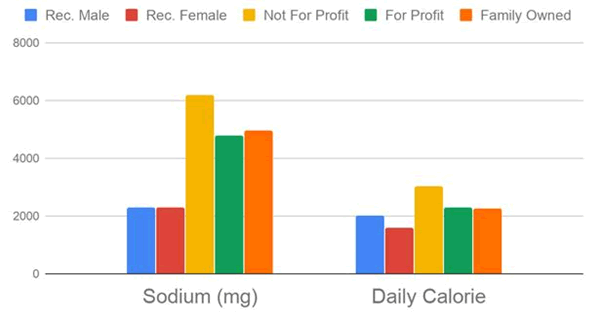
Figure 3 shows there was 5,308 mg of sodium (SD of 770.4) in a typical day which was about 3008 mg higher than the recommended serving and significantly significant with p<0.001. This chart also demonstrates the average daily caloric serving of 2528 calories (SD of 437.32) which was significantly higher than recommendations (p<0.001) for both males and females.

Figure 3: Nutritional Value National vs Facility.
Based upon our research and observation, we have recommended implementing the following changes. The first recommendation is the inclusion of a dietitian in the creation of a meal plan and sourcing of the ingredients. During our investigation it was found that many of the regular non-disease or modified meal plans were not tailored based on the facility dietician recommendations.
Average salt consumed in a day was significantly over the nutritional recommendations. Due to this, we also suggest salt alternatives for food seasoning. We would promote use of local foods from farmers markets over prepackaged or pre prepared foods and limit the use of naturally salt rich foods such as ham and pastrami.
Osteoporosis and fractures from falls become more common with increasing age for both men and women [11]. Given the consumption of dairy was significantly lower than national guidelines this was an area for growth. The addition of diverse dairy products into the menu would enhance the opportunity for increased calcium consumption. Our suggested changes included the addition of yogurt, cheese sticks, cheese and nut snacks, cottage cheese, and soy milk.
This study has some limitations. While the nursing facilities had significant differences, we only included 3 nursing homes in this study. Given the small sample size, future research should include more facilities in order to confirm findings that may be facility specific and not specific to the ownership. The nursing homes were located in similar geographic locations and none were in a rural area which restricted the ability to compare to outside the geographical area of the study. The study was concluded in one season therefore seasonal variation in meals was not evaluated. We did not receive any funding for this research.
To date, there are no national guidelines or regulations regarding nutrition in the extended living facility. CMS does have detailed recommendations outlining the preparation and distribution of the food, but not specific to the nutritional requirement of the food.
To summarize, the intake of nutrient rich food such as fruits, dairy and vegetables was below recommended levels and the intake of calories and sodium was well above the recommended intake. Sodium in particular was consistently double the recommendations. These are areas of possible intervention that can greatly improve patient health.
Several changes are suggested to improve the nutrition in the nursing home and bring it closer to what would be expected in community dwelling adults including gender specific variation per USDA recommendations. We hope to create a multi-center program looking at meals provided to the nursing home residents which would allow us to study age, gender and disease specific issues. Our future research would expand the data set in number and time, to best monitor the effect of these changes.
University of Toledo Bioethical IRB-Determination was IRB is not required as there is no patient interaction or data collection
Not Applicable.
The raw datasets used and/or analysed during the current study are available from the corresponding author on reasonable request.
Citation: Garg A, Szymanski KL, Merugu GP (2022) Nutrition in the Nursing Home: Expectation vs Reality. J Nutr Food Sci. 12:844.
Received: 04-Jan-2022, Manuscript No. jnfs-22-16268; Editor assigned: 06-Jan-2022, Pre QC No. jnfs-22-16268 (PQ); Reviewed: 20-Jan-2022, QC No. jnfs-22-16268; Revised: 24-Jan-2022, Manuscript No. jnfs-22-16268 (R); Accepted: 29-Jan-2022 Published: 31-Jan-2022 , DOI: 10.35248/2155-9600.22.12.1000844
Copyright: © 2022 Garg A, et al. This is an open-access article distributed under the terms of the Creative Commons Attribution License, which permits unrestricted use, distribution, and reproduction in any medium, provided the original author and source are credited.