Journal of Nutrition & Food Sciences
Open Access
ISSN: 2155-9600
+32 25889658
ISSN: 2155-9600
+32 25889658
Research - (2022)Volume 12, Issue 6
Objective: To define the effect of the role of parental care on child nutritional status and factors responsible for malnutrition in children attending Khyber teaching Hospital Peshawar Pakistan.
Method: This was a cross sectional descriptive study carried out in Khyber Teaching Hospital, Peshawar to assess the nutritional status of children under five years of age (n=200). Questionnaires were used to collect data from patients in PAEDS wards and Out-Patient departments. Data analysis was done with SPSS.
Results: In our study, 85.5% were weaned while 14.5% children had not started weaning. For infants, the type of milk/feed ingested is also important. In such study, 40.5% infants were breastfed, 15.5% were given only formula milk and 5% were given both. Out of the subjects studied, 88.5% had a proper diet plan while 11% did not. 1%, 26%, 21.5%, 49.5% and 2% of subjects had a very poor, poor, and average, good and very good appetite respectively. 78.5% subjects were vaccinated and only 25% had satisfactory house hold income. In the present study 83% individuals were not dewormed and 18% of our subjects were fed with diluted milk.
Conclusion: We found that feeding a child with formula milk rather than exclusively breastfed, feeding a child with diluted milk than standard scale provided on the bottle, delaying weaning of a child, non-satisfactory diet, improper vaccination, not deworming the child and non-satisfactory father or guardian income directly affect child nutritional Health. Concluded from our all results we can confidently say that parental care that includes most of our variables we investigated can greatly affect the child’s nutritional health.
Nutritional assessment; Children’s; Tertiary care hospital
Nutrition is the process of living creatures absorbing dietary elements in order to grow, reproduce, and sustain themselves [1]. Every human being deserves access to nutritious, cheap food and high-quality nutritional care [2]. If access to food is restricted, a range of nutritional problems can arise, the most serious of which is malnutrition [3]. Malnutrition is nevertheless more frequent in industrialized nations which can be induced by sickness and environmental/behavioral variables linked to reduced nutrient intake and/or delivery [4,5]. Both under nutrition and over nutrition are referred to as malnutrition. Stunting (low height for age), wasting (low weight-for-height), or being underweight for their age are examples of under nutrition, whereas obesity, metabolic disorders, and cardiovascular illnesses are examples of over nutrition which is responsible for around 3.5 million fatalities and 35% of morbidities among children under the age of five years worldwide, acute nutrition [6,7]. Malnutrition that is either primary or secondary. In low- and middle-income countries, children with primary acute malnutrition are widespread as a result of insufficient food supplies caused by socioeconomic, political, and environmental factors [8-10].The number of underweight children (weight-for-age Z score -2) worldwide is projected to be 101 million, or 16%. The incidence of acute and severe malnutrition among children under the age of five is higher than the World Health Assembly's goal of lowering and keeping prevalence below 5% by 2025. The prevalence of acute malnutrition among hospitalized children in affluent nations ranged from 6% to 51%, according to studies utilizing various techniques of measuring malnutrition [11-13].
Around 33% of all children are underweight, 44% are stunted, 15% are wasted, and 50% are anaemic according to the National Nutrition Survey [14]. Low birth weight, insufficient breastfeeding, inappropriate complementary feeding, maternal education and nutrition knowledge, low micronutrient intake, lack of birth spacing, household socioeconomic status, food insecurity, poor sanitation, lack of vaccination, and infectious diseases are all factors that contribute to childhood malnutrition [15]. A nutritionist or qualified health care practitioner conducts a nutritional evaluation to determine an individual's overall nutritional status [16]. Its three main purposes in clinical medicine are to identify the presence and type of malnutrition, to define health-threatening obesity, and to establish adequate diets as a preventative measure against illness later in life [17]. Other methods for determining a person's nutritional status include biochemical, clinical, and dietary data analysis, but anthropometry is the most generally employed which is concerned with the set of quantitative measurements and the primary components of anthropometry include height, weight, BMI, body circumferences (waist, hip, and limbs), and skin fold thickness [18-20]. Height-for-age, weight-for-height, and weightfor- age are all computed using the 2006 WHO child growth and represented as Z-scores [21]. In the community, children with severe acute malnutrition can be treated with ready-to-use therapeutic food (peanut paste, milk powder, vegetable oil, and a mineral and vitamin mix as per WHO recommendations [22]. Pakistan is suffering in silence from a malnutrition crisis that is among the worst in the world. Implementing a good health-care system that includes immunization, oral rehydration, periodic deworming, awareness about breast feeding, early diagnosis, and effective treatment of common diseases will help to reduce malnutrition in society [23]. Every paediatric patient's reaction to disease is influenced by their nutritional state. As a result, nutritional evaluation should be a component of every paediatric patient's care [24].
A descriptive cross sectional study was conducted in Khyber Teaching Hospital, a tertiary care hospital, Peshawar, Khyber Pakhtunkhwa covering a total area of 1,257 km with a total population of 1,970,072. This study was performed over a period of 18 months from Nov 2020 to August 2021 in Peshawar city, Khyber Pakhtunkhwa. The variables such as Weight, Height, BMI, MUAC, Weaning, Child Diet, Dilution of milk, Child Appetite, Type of milk feed, Vaccination course, Deworming, Father or Guardian Income. Male and female patients under the age of five years from the Pediatrics ward of KTH who were willing to cooperate were included in the research study while those who were already diagnosed as malnourished were excluded from our study.
Samples were collected by convenience sampling. According to the WHO sample size calculator, the sample size calculated was 284 cases. But due to limited time frame and financial resources, sample size has been cut down to 200 cases.

n=sample size
P=presumed prevalence in %age i.e. 50%=0.5
Z=level of confidence i.e. 95%=1.96
d=Acceptable margin of error usually 5% or 0.05
Data has been collected using a questionnaire, formulated by the researchers. Subjects' mothers were asked about their child's eating history, such as breastfeeding, weaning diet, and kind of milk, as well as sanitation and hygiene issues, such as drinking water source and hand cleanliness, other associated risk factors and their response will be recorded in questionnaire. Data analysis was done with the help of 22nd version of SPSS (Figure 1).
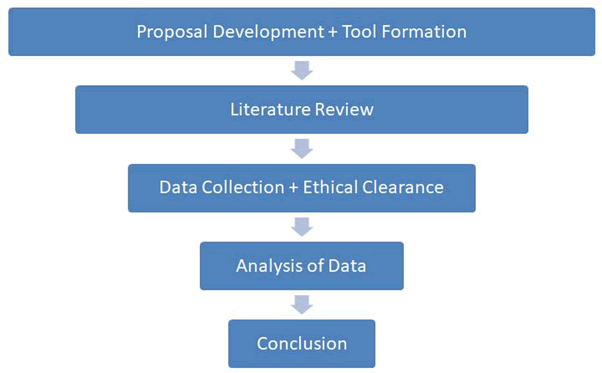
Figure 1: Flow Chart.
Malnutrition is a serious public health issue in underdeveloped countries, with a high death rate (60%) in children under the age of five, which has been related to a significant increase in the risk of mortality and morbidity [25,26]. In South Asia, Pakistan has the second highest new born and child mortality rate [27]. An emphasis is placed on anthropometric measurement, body composition, and energy expenditure of children at risk of malnutrition in this overview of methodological concerns in nutritional assessment [28]. The role of morbidity in explaining children's weights and heights is assessed. It also assessed how much household income explains for disparities in observed nutritional status, as well as how many other characteristics like education and public health influence the nutritional outcome [29].
The study includes two hundred children’s less than five year. The variable gender stated that 62% of our subjects were male and 38% female subjects. The Height range 40 cm to 110 cm while Age range from 1 month to 5 year. The age below than 6 month, 6 month to 1 year,1 to 2 years, 2 to 3 years, 3 to 4 years, 4 to 5 years are 22%, 24%, 18%, 15%, 13%, 8% respectively. The weight and height of each subject was used to calculate BMI and then BMI of that subject was compared to Z percentile score to Classify study subject as normal malnourished and obese. We found out that 65% of study subjects were normal, 28.5% undernourished and 6.5% obese. Upon comparing Mid Upper Arm Circumference (MUAC) of each subject we were able to classify our study subjects normal, undernourished and obese. We found 65% of subject’s normal, 28.5% undernourished and 6.5 obese (Figures 2-7).
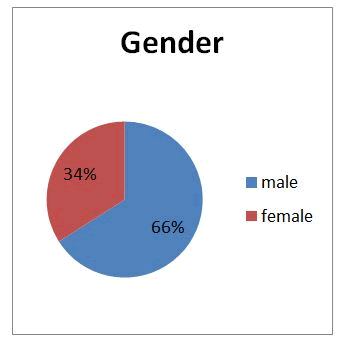
Figure 2: Distribution of Gender.
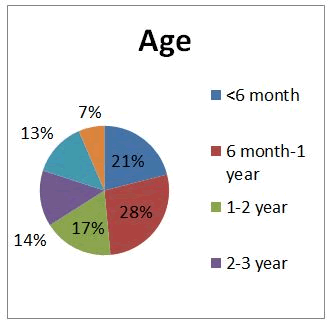
Figure 3: Distribution of Age.
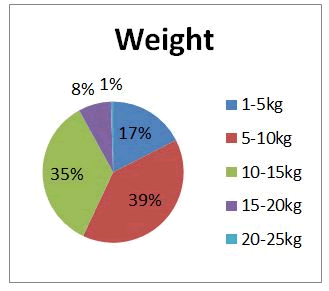
Figure 4: Distribution of Weight.
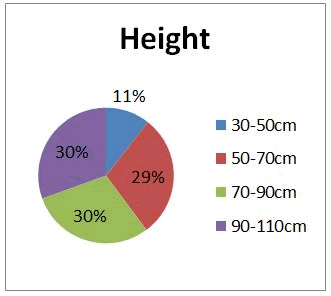
Figure 5: Distribution of Height.
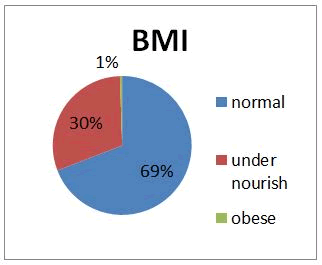
Figure 6: Distribution of BMI.
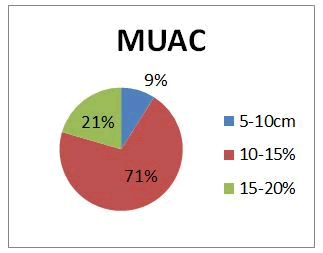
Figure 7: Distribution of MUAC.
The results shows that 18.5% of our subjects started weaning after 1 year, 51% of subjects started weaning after 6 months while 30.5% of subjects started weaning before 6 months. As Child diet is concerned, 11.5% of our subject’s diets were not satisfactory while 88.5% subjects had a satisfactory diet. There are 40.5% of our subjects were breastfed, 15.5% of our subjects were fed with formula milk, while 5% subjects were both breastfed and fed with formula milk while 39% of our subjects were above 2 years of age. We compared the diet of our subjects and got the following results respectively: 1%; very poor, 26% poor, average 21.5%, good; 49.5% and only 2% of our subjects had very good appetite. The study shows that 78.5% of our subjects were vaccinated by their parents. On the contrary 21.5% of subjects weren’t vaccinated by their parents. The study shows that only 16.5% of our subjects were dewormed as compared to 83% of our subjects who weren’t dewormed. In our study 65% subjects were nutritional normal, 28.5% undernourished while 6.5% were obese to classify them normal. Father or Guardian income is also an important factor in the assessment of nutrition Our study shows that 75% of subjects' father or guardian income was not satisfactory compared to 25% of subjects who had satisfactory income to fulfil their children's basic needs and diet (Table 1).
Table 1: Questionnares along with the possible answers.
| Questionnares | Options | N | Percentage |
|---|---|---|---|
| Weaning | Started Weaning after 1 year | 37 | 18.50% |
| Started Weaning after 6 month | 102 | 51% | |
| Started Weaning before 6 month | 61 | 30.50% | |
| Child Diet | Satisfactory | 177 | 88.50% |
| Not Satisfactory | 23 | 11.50% | |
| Type of Milk Feed | Breast Feed | 81 | 40.50% |
| Formula Milk | 31 | 15.50% | |
| Breast Feed and Formula Milk | 10 | 5.00% | |
| Above two years of age | 78 | 39.00% | |
| Child appetite | Very Poor | 2 | 1% |
| Poor | 52 | 26% | |
| Average | 43 | 21.50% | |
| Good | 99 | 49.50% | |
| Very good | 4 | 2% | |
| Vaccination Course | Vaccinated | 157 | 78. 5% |
| Not Vaccinated | 43 | 21.50% | |
| Deworming | Dewormed | 33 | 83.50% |
| Not dewormed | 167 | 16.50% | |
| Nutritional Status | Normal | 130 | 65.00% |
| Under-nourishment | 57 | 28.50% | |
| Obese | 13 | 6.50% | |
| Father/Guardian Income | Satisfactory | 50 | 25.00% |
| Not satisfactory | 150 | 75.00% |
When compared to other South Asian countries, Pakistan has one of the worst rates of child malnutrition in the world, and it is making exceedingly slow progress in child nutrition and health [30]. In Pakistan, the proportion of children under the age of five who are malnourished is high [31]. Pakistan should adopt the WHO growth criteria for measuring under nutrition, which is well-constructed and up-to-date. Although Subjective Global Assessment (SGA), a clinical judgment-based approach of nutritional assessment, has been widely used to assess the nutritional status of adults for both clinical and research reasons, there is no such confirmatory test to quantify under nutrition [32-34]. The difficulty in calculating nutritional demands of individual children is a key contributor to the cause of insufficient nutrient supply [35].
In our study, we calculated the BMI and MUAC of the subjects and compared the BMI with Z percentile score and MUAC with the standard chart of MUAC. According to the scores, 9% of the subjects had MUAC ranging from 5-10 cm, 70.5% from 10-15 cm and 20.5% from 15-20 cm. Thus 65% of the subjects were classified as normal, 28.5% as undernourished and 6.5% as obese. Stunting, underweight, and wasting were found in 15.1%, 27.3%, and 21.9% of children aged 6 to 59 months in a comparable survey conducted in Sri Lanka in 2012 [36]. Obesity in children aged 5-6 years, as indicated by a BMI Z-score>2SD in the WHO Growth Chart reference, grew dramatically from 8.8% in 2006 to 10.1% in 2010 in Tianjin, China [37]. The WHZ index helps us to determine the weight's appropriateness in respect to body height. Individuals with a low WHZ are said to be wasting, a condition that indicates severe malnutrition [38]. Stunting was shown to be more common than underweight in the current investigation. Other academics that looked into the prevalence of under nutrition came to the same conclusion [39,40]. However, in comparison to the current study, other investigations from other nations found a lower rate of under nutrition. Rather than disparities in their genetic ability to attain maximal height, these discrepancies in the incidence of under nutrition may be related to variances in dietary intake, socioeconomic, and cultural factor [41,42]. The statistics of Questionnares were showed in Table 2.
Table 2: Statistics of Questionnare.
| - | Frequency | Percent | Valid percent | Cumulative % | |
|---|---|---|---|---|---|
| Weaning of child | |||||
| Valid | before six months | 53 | 26.5 | 26.5 | 26.5 |
| after six months | 90 | 45 | 45 | 71.5 | |
| after 1 year | 28 | 14 | 14 | 85.5 | |
| not yet | 29 | 14.5 | 14.5 | 100 | |
| Total | 200 | 100 | 100 | - | |
| Child diet | |||||
| Valid | 0 | 1 | 0.5 | 0.5 | 0.5 |
| satisfactory | 177 | 88.5 | 88.5 | 89 | |
| not satisfactory | 22 | 11 | 11 | 100 | |
| Total | 200 | 100 | 100 | - | |
| Type of milk | |||||
| Valid | breastfed | 81 | 40.5 | 40.5 | 40.5 |
| formula milk | 31 | 15.5 | 15.5 | 56 | |
| both | 10 | 5 | 5 | 61 | |
| none | 78 | 9 | 39 | 100 | |
| Total | 200 | 100 | 100 | - | |
| Dilution of milk | |||||
| Valid | yes | 36 | 18 | 18 | 18 |
| no | 9 | 4.5 | 4.5 | 22.5 | |
| Not sure | 5 | 2.5 | 2.5 | 25 | |
| none | 150 | 75 | 75 | 100 | |
| Total | 200 | 100 | 100 | - | |
| Child appetite | |||||
| Valid | very poor | 2 | 1 | 1 | 1 |
| poor | 52 | 26 | 26 | 27 | |
| average | 43 | 21.5 | 21.5 | 48.5 | |
| good very | 99 | 49.5 | 49.5 | 98 | |
| good | 4 | 2 | 2 | 100 | |
| Total | 200 | 100 | 100 | - | |
| Vaccination course | |||||
| Valid | yes | 157 | 78.5 | 78.5 | 78.5 |
| no | 43 | 21.5 | 21.5 | 100 | |
| Total | 200 | 100 | 100 | - | |
| Deworming of child | |||||
| Valid | Yes | 33 | 16.5 | 16.5 | 16.5 |
| No | 166 | 83 | 83 | 99.5 | |
| Not sure | 1 | 0.5 | 0.5 | 100 | |
| Total | 200 | 100 | 100 | - | |
| Nutritional status | |||||
| Valid | normal | 130 | 65 | 65 | 65 |
| undernourished | 57 | 28.5 | 28.5 | 93.5 | |
| obese | 13 | 6.5 | 6.5 | 100 | |
| Total | 200 | 100 | 100 | - | |
| Father/Guardian income | |||||
| Valid | satisfactory | 50 | 25 | 25 | 25 |
| Not satisfactory | 150 | 75 | 75 | 100 | |
| Total | 200 | 100 | 100 | - | |
Weaning is yet another factor that plays an important role in the child’s nutritional status. In our study, 30.5% children were weaned before 6 months of age, 51% were weaned after 6 months, and 18.5% were weaned after 1 year of birth. Children who were being weaned in proper time showed satisfactory nutritional status when compared to others. Another research in Karachi, Pakistan, demonstrated that children who were weaned at the recommended age of 4-6 months were considerably less malnourished on anthropometric measurements than those who were weaned at an earlier or later age [43]. For infants, the type of milk/feed ingested is also important. In our study, 40.5% infants were breastfed, 15.5% were given only formula milk and 5% were given both. Exclusive breastfeeding was common up to 4 months of age in a Chilean research (86.5% at 0-0.9 months and 59.4% at 3-3.9 months), then dropped to 1.6% at 7 months. Breast milk was still given to 83%, 59%, and 31% of children aged 3, 6, and 12 months, respectively. 12.1% of the children were underweight for their age, 30.7% were underweight for their age, and 35.7% were overweight [44].
Our study also suggests that under nutrition can be reduced by improving the dietary diversity of complementary foods. Dietary variety is an excellent predictor of dietary quality and micronutrient density in children, which supports this theory [45,46]. A good food plan was followed by 88.5% of the patients tested, whereas 11% did not. Other poor nations, such as Burkina Faso, Bangladesh, Ethiopia, and others have observed similar findings [47,48]. We concluded that 1%, 26%, 21.5%, 49.5% and 2% of subjects had a very poor, poor, and average, good and very good appetite respectively. The current study noted that the wealth quintile was highly associated with underweight, stunting, and wasting of children. Only 25% of the subjects had a satisfactory household income while the rest 75% belonged to poor households. When compared to children from high-income homes, children from low-income households were roughly three times more likely to be underweight and stunted, according to a separate study conducted in India. In line with this, a research from Mysore, India, found that poor socioeconomic level was strongly linked to being underweight [49,50]. In our study it was observed that 78.5% cases were vaccinated and 21.5% were not. Non-vaccinated patients were labeled as malnourished, whereas those who had been vaccinated were labeled as healthy. In seven nations, another study found a considerably greater frequency of underweight among children with inadequate immunization regimens [50].
In Angola, Chad, and Guatemala, logistic regression adjusted for background factors demonstrated a link between inadequate immunisation and underweight (95% CI lower bound >1). When data from all countries was combined, underweight (aOR 1.21, 95% confidence interval 1.111.31), wasting (aOR 1.18, 95% confidence interval 1.051.33), and stunting (aOR 1.07, 95% confidence interval 1.001.14) were all linked to low immunisation status [51,52]. The histograms of questionnaires were showed in Supplementary Figures.
Another important component in a child's nutritional status is deworming. Deworming might prevent malnutrition, anaemia, and malabsorption by controlling worms and thereby improving nutritional status. In the current study, 83% of the participants were not dewormed, indicating that they were malnourished, whereas just 16.5% were dewormed. Deworming with albendazole 400 mg for three days was shown to be successful in decreasing Soil Transmitted Helminth (STH) prevalence in Perobatang Village, Southwest Sumba, Indonesia, showing that deworming with albendazole 400 mg for three days was effective in controlling STH [53]. Deworming can have a significant long-term influence on fundamental academic abilities such as numeracy and reading for children who live in villages throughout their preschool years, according to a previous working paper based on Uwezo data from 2010 and 2011 [54].
Child growth is widely considered as an essential measure of a population's nutritional condition and health. The incidence of stunting and thinness has been seen to increase with age [55]. As children's fitness continues to deteriorate, regular and systematic fitness monitoring is essential [56]. We couldn't find other study in other part of the world to compare our last variable that is the usage of diluted milk to feed infants, we found that 18% of our study subjects were fed with diluted milk that affected child nutritional status, if they were fed according to the standard scale mention on the milk bottle, it could have saved them for under nutrition. To sum up all our results we could say that parental care has a great role in child nutritional health status.
We found that feeding a child with formula milk rather than exclusively breastfed, feeding a child with diluted milk than standard scale provided on the bottle, delaying weaning of a child, nonsatisfactory diet, improper vaccination, not deworming the child and non-satisfactory father or guardian income directly affect child nutritional Health. Concluded from our all results we can confidently say that parental care that includes most of the factors we investigated can greatly affect child nutrition health.
The authors have no relevant financial or non-financial interests to disclose.
[PubMed]
[PubMed] [Google Scholar]
[PubMed]
[PubMed]
Citation: Hadi I, Hasnain M, Idrees A, Imtiyaz M, Zafar MS, Begum S (2022) Nutritional Assessment by Anthropometric Methods under Five Years of Children's in Tertiary Care Hospital in Peshawar, Khyber Pukhtunkhwa, Pakistan. J Nutr Food Sci. 12:866.
Received: 15-Jun-2022, Manuscript No. jnfs-22-17964; Editor assigned: 17-Jun-2022, Pre QC No. jnfs-22-17964 (PQ); Reviewed: 01-Jul-2022, QC No. jnfs-22-17964; Revised: 06-Jul-2022, Manuscript No. jnfs-22-17964 (R); Published: 13-Jul-2022 , DOI: 10.35248/2155-9600.22.12.1000866
Copyright: © 2022 Hadi I, et al. This is an open-access article distributed under the terms of the Creative Commons Attribution License, which permits unrestricted use, distribution, and reproduction in any medium, provided the original author and source are credited.