Journal of Antivirals & Antiretrovirals
Open Access
ISSN: 1948-5964
ISSN: 1948-5964
Research Article - (2017) Volume 9, Issue 3
In this paper, we discuss the asymptotic behavior of the optimal condition to control Ebola virus by considering the SEIRS model. First, we show stability and dynamical behavior of the model. Then, we find the conditions on parameters used in model which would minimize number of infected individuals. Finally, we give the graphical representations for different data.
<Keywords: Ebola virus model; Dynamical behavior; Optimal conditions; Graphical representation
In March 2014, Ebola attacked in West Africa and from that time awareness of Ebola virus started because of dangerous nature of this disease. At December 2015, 28600 cases conformed and suspected in West Africa had been reported through WHO. Due to this viral disease 40 percent died among 28000 of its affected persons. As for as WHO and all the world noted that Ebola virus is dangerous, so keep in mind this reality WHO was trying to use different controls in term of vaccination, awareness campaign etc to reduce the death rate occurred due to this viral disease [1-6]. Beside the WHO and other departments mathematicians also played their role to discuss this viral disease [2-6].
In order to understand the spread of Ebola virus epidemic follow Chowell et al. [2,3] for understanding the nature of this disease. They also studied the effects of Ebola virus on public health by considering the cases of Congo and Uganda. Legrand et al. [4] studied the dynamics of Ebola epidemics. Althaus et al. [7] collected the data of effecters and proposed an SEIR mathematical model on this virus and measured the basic reproductive number in Guinea, Sierra Leone and Liberia. Rachah and Torres [8] have considered an SIR mathematical model on the population infected by Ebola virus and studied its optimal control. Li et al. [9] have given the SEIT model of Ebola. Koya and Mamo [10] studied the Ebola epidemic and have given a mathematical model to study stability analysis, and fit the data for Guinea, Liberia, Sierra Leone. Shittu et al. [11] evaluated the awareness, knowledge and misinterpretations about Ebola virus disease in Nigeria. Funk et al. [12] also encountered the effect of awareness in epidemic outbreak. Al- Sheikh [13] studied the SEIR model and encounters the treatment rate.
In this work, we discuss an SEIRS Ebola model with temporary immunity consisting of four classes: susceptible, exposed, infectious, and recovered with effects of vaccination, treatment and awareness campaign and investigate conditions on the parameters of the model which would be managed to optimize the number of effecters from this disease. To do this, first we obtain the unique non-negative strong solution of model and discuss the stability. Next, we discuss the dynamical and asymptotic behavior of the model by using data with graphical justification and finally, we identify optimal conditions on the parameters of the model which would be managed to minimize the risk of this virus. This work also provides information about the control techniques.
This paper is organized as follow: Section 2 gives formulation of the model of Ebola and give its unique strong solution. In Section 3, we obtain the basic reproductive number and discuss stability of the model. In Section 4, we investigate condition on the parameters of our model and show through realistic data that by managing this condition, the number of infectious class decreases exponentially. Finally we give conclusion and references.
In this section, we introduce a deterministic SEIRS Ebola model with temporary immunity, where S = S (t ) denotes the number of susceptible individuals, E = E(t) -the number of exposed, I = I (t ) -the number of infectious, while R = R(t ) -the number of recovered ones due to awareness campaign, vaccination and treatment from Ebola virus at time t.
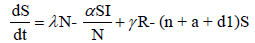
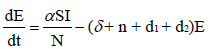
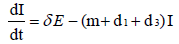
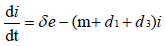
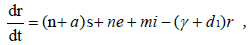
To develop this model, we assume that the total population S + E + I + R , denoted by N, is constant at any time t. All the new borns with recruitment rate λ are assumed to be susceptible. The system of differential equations that describes the spread of Ebola virus disease, is
 (2.1)
(2.1)
and 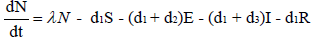 (2.2)
(2.2)
with non-negative initial values S(0), E(0), I(0), R(0), N (0). The validation of these equations depends on N>0, when N=0 then naturally  is zero. In the model, λ is the recruitment rate, d1-the natural death rate of all the classes, d2 and d3 are Ebola virus dis- ease cause death rates of exposed and infectious classes respectively. α is the transmission rate of disease from susceptible to exposed, recovered individuals lose their immunity at rate γ, susceptible and exposed move at the rate n to recovered class due to vaccination, treatment and awareness campaign while susceptible move to recovered at the rate a due to vaccination and awareness campaign, exposed individuals become infectious at rate δ, and infectious become recovered at the rate m due to treatment. If there is no treatment, awareness campaign and vaccination then a, m and n are zero. The value of transmission rate α can become smaller by taking protective steps in time of interaction with Ebola effected individuals. Moreover, if vaccination of the Ebola disease is such that the person once effected, with this virus, will never catch this disease again (for example, disease like measels), then γ=0. We also assume that all the coefficients in the model are locally Lipschitz continuous.
To analyze the model in terms of the proportion of susceptible, exposed, infectious and recovered, we make transformation 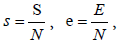
 and
and  [14], then our system of differential equations becomes
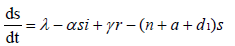
 (2.3)
(2.3)
Where s + e + i + r = 1.
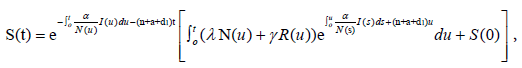
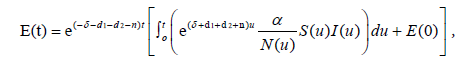
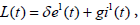
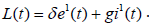
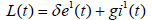
The unique strong solution of the system (2.1) is given as
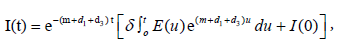
 (2.4)
(2.4)
while

In coming section, we come to the stability analysis of the model (2.3).
In this section, we investigate the equilibrium points of the model through theory of stability analysis.
When there is no Ebola infected individual in the community, that is i=0 [11], we obtain the free Ebola point as
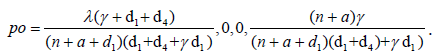
The basic reproduction number is given as where 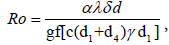 where c = n + a + d1, d = γ + d1 + d4, g = n + δ + d1 + d2 and f = m + d1 + d3. If there is no vaccination and awareness campaign, that is, n = a = m = 0, then the reproductive number of this virus is given as
 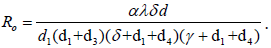 By putting d2 = d4 = γ = n = a =0, we obtain the basic reproductive number studied in Al-Sheikh [13,15,16].
To study the stability of the model at point p0, we construct the Jacobian matrix J as
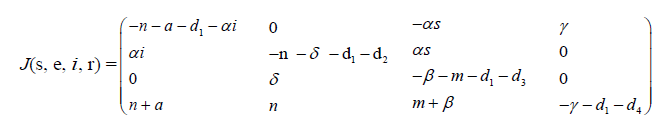 (3.1)
(3.1)
Using the free Ebola equilibrium point p0, the matrix (3.1) becomes
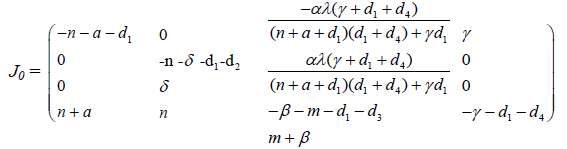
To find the eigen values of J0, we obtain the corresponding characteristic equations as
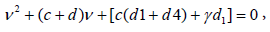
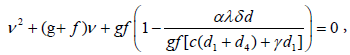
Where ν denotes the eigen value of the matrix.
We see that all the eigen values become real and negative if 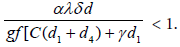 Hence, we come to the following results:
Theorem 3.1. The model (2.3) is locally asymptotically stable at point p0 if and only if Ro<1.
Theorem 3.2. The model (2.3) is globally asymptotically stable at point p0 if and only if Ro<1.
Proof. To prove the global stability, we construct the Lyapunov function as
with derivative
Substituting the value of  and
and  from the system (2.3) and simplifying, we get
Hence, we conclude that L1(t)<0 whenever Ro<1. This completes the proof.
In this section, we graph the function I(t) (representing the number of infectious class at time t) from the unique strong solution of our model. The graphs give the dynamical and asymptotic behaviour of the corresponding class. We identify condition on the parameters of the model which would be managed to minimize the number of effectors from Ebola virus. Condition shows that the number of effectors can be minimized through treatment, vaccination and awareness campaign in the society.
We have chosen data for plotting and identifying the condition on the parameters at two different timings, that is, the year 2014 the time of virus attack and the year 2016 when the treatment and awareness campaign was taking place. During this time interval Ebola virus effected the three regions Guinea, Sierra-Leone and Liberia.
We want to mention that the recruitment rate can be given by birth rate [7,9], which is the total number of births per 1, 000 of a population in a year. The 2014 data is taken from [7,9,17,18] in the following table:
The graph of infectious class, where Ig, Is and Il denote the infectious class of Guinea, Sierra Leone and Liberia respectively, is given in Figure 1.

Figure 1: The graph of infectious class of Guinea, Sierra Leone and Liberia, using the data of 2014.
From the Table 1, we observe that the parameters of our model satisfy the condition
| Parameter | Guinea | Sierra-Leone | Liberia |
|---|---|---|---|
| N (0) | 11745000 | 5743725 | 4299944 |
| S(0) | 11744951 | 5743709 | 4289269 |
| E(0) | 37 | 34 | 0 |
| I(0) | 49 | 16 | 10 |
| R(0) | 20 | 11 | 5866 |
| λ | 0.00009868 | 0.0001024 | 0.00009276 |
| d1 | 0.00002657 | 0.00030219 | 0.00002597 |
| d2 | 0.0002 | 0.0002 | 0.0019 |
| d3 | 0.60 | 0.35 | 0.46 |
| d4 | 0.00002657 | 0.00030219 | 0.00002597 |
| α | 0.37 | 0.64 | 0.40 |
| δ | 0.1783 | 0.2476 | 0.2476 |
| γ | 1 | 1 | 1 |
| m | 0.01805 | 0.1744 | 0.038 |
| n | 0.03 | 0.04 | 0.04 |
| a | 0.5 | 0.5 | 0.28 |
Table 1: Parameters of our model.
α > n + δ + d1 + d2, with arbitrary non-negative remaining parameters.
The 2016 data of Guinea, Liberia and Sierra Leone from [7,9,17-20] is given in Table 2. This table shows that the parameters of the model satisfy the condition α
| Parameter | Guinea | Sierra-Leone | Liberia |
|---|---|---|---|
| N (0) | 12093349 | 6018888 | 4299944 |
| S(0) | 12088 | 6004766 | 4289269 |
| E(0) | 0 | 0 | 0 |
| I(0) | 3804 | 14 | 10675 |
| R(0) | 1268 | 10167 | 5866 |
| λ | 0.00009709 | 0.0001004 | 0.00009276 |
| d1 | 0.0000253 | 0.000029 | 0.00002597 |
| d2 | 0.0002 | 0.0002 | 0.00019 |
| d3 | 0.67 | 0.3 | 0.46 |
| d4 | 0.0000253 | 0.000029 | 0.00002597 |
| α | 0.27 | 0.32 | 0.28 |
| δ | 0.168 | 0.2476 | 0.2454 |
| γ | 1 | 1 | 1 |
| m | 0.193 | 0.193 | 0.193 |
| n | 0.2 | 0.19 | 0.17 |
| a | 0.3 | 0.3 | 0.23 |
Table 2: The 2016 data of Guinea, Liberia and Sierra Leone.
The graph of infectious class, where Ig, Is and Il denote the infectious class of Guinea, Sierra Leone and Liberia respectively, is given as: (Figure 2).

Figure 2: The graph of infectious class of Guinea, Sierra Leone and Liberia, using the 2016 data.
These conditions show that if the interaction rate α can be managed such that α
There are two major clinical implications of this disease. First one is related to the pregnancy which has not been yet studied in details and is still a challenge to the authorities dealing with the responding teams of the outbreak. For further details we refer the reader to [21]. The other implication is early transmission of Ebola virus. Many vaccination compaigns are undertaking for the prevention of this disease. Initially the health care workers are at high risk of transmission and infection for this virus.
In this work, we studied a deterministic model on the evolution of the number of Ebola effected individuals and identified conditions on the parameters of the model, which would be managed through awareness campaign, vaccination and treatment. To control this disease, the policy makers should manage the parameters of the model such that the interaction parameter α satisfy α<n + δ + d1+d2 where the remaining parameters are arbitrary non-negative.