Journal of Nutrition & Food Sciences
Open Access
ISSN: 2155-9600
+32 25889658
ISSN: 2155-9600
+32 25889658
Research Article - (2014) Volume 4, Issue 6
Starting from gas-chromatograms of extra virgin olive oil samples, choosing the most significant peaks, authors try to define a standard ortho-normal base to be deposited for quality valuation.
Keywords: Standard determination; Extra virgin olive oil
Exploring the components of flavor, one realizes the complexity of the physics of perception in which they are involved all five human senses. In the case of extra virgin olive oils are available chemical analyses that allow to mathematically defining reference standards. One of these is the gas chromatography which presents characteristic peaks that correspond to search components.
Flavor
The International Organization for Standardization (ISO) defines flavor as “Complex combination of the olfactory, gustatory and trigeminal sensations perceived during tasting. The flavor may be influenced by tactile, thermal, painful and/or kinesthetic effects” [1]. The feelings typical of the eating involve, in a first time, a specific area of the brain, but, after few times they are sent to the frontal cortex, seat of conscious thought, where they are merged in a unique mental elaboration. This final elaboration of the food taste is often identified with the flavor
The union of five senses
Our five senses operate together to give us a full picture. The brain is learnt to choose foods that will give our body the greatest nutrients. In human experience, about food colours, dairy is generally pale and white, vegetables and fruits a mixture of bright yellows, greens and red, meats often a rich brown. Our subconscious knows this, for this reason we pause over the fruit bowl to pick an item we find visually appealing: if no correspondence is perceived, the food is refused. So is also refused rotten fruits and vegetables, mouldy bread, burnt or undercooked meat that is related to the smell sense. Our eyesight triggers our taste buds along with our other senses of touch, taste, smell and hearing [2].
Taste
The sense of taste is generated from the interaction of molecules present in food and in beverages introduced in the oropharynx where are present taste sensorial cells, mainly on the surface of the tongue but also on the surface of palate, pharynx and larynx [3]. The mucosa of the oral cavity is full of nerve endings able to detect tactile sensations, related to consistency, granularity, viscosity etc. The tongue has different types of taste buds. When the receptors are combined with the molecules present in the food, an electrical impulse is generated and sent towards the brain for the final elaboration. The substances having smell spreads in the air. The air circulation between mouth and nose allows to the smell molecules to reach the nose cavity rising behind the soft palate. So, being mouth and nose in communication, taste and smell work together to interpret the characteristic of foods and beverages.
The Meaning of taste: The thousands of flavors perceivable are caused from chemical stimulus that are grouped according to six principal flavors [3]: sweet, salad, acid, bitter, umami (taste of glutamate) and taste of fat [4].The number of receptors for the flavors is joined to each taste: for acid there is only a receptor, sweet and umami are received by three receptors while for the bitter there are 30 different receptors. A so high number of receptors for the bitter are explainable through the consideration that there are several toxic substances for the human body characterized by a bitter taste. The preference for sweet foods highlights the wish to research high-calorie foods. The preference for the umami highlights the research of high proteins foods while the preference for salad the points out the needs to ingest mineral salts. Normally every person hates strong acid or strong bitter foods. High acidity can signal the presence of rotten food or in undesired fermentation. These behaviors, mainly innate, are influenced by the local alimentary culture of a specific population. The salad taste, but also the acid one, became noticeable because it is developed the practice to consume foods conserved under salt or pickle.
Smell
We are able to feel smell or aromas thanks the olfactory epithelium which can interact with odorous molecules which enter in the nose coming from the mouth. The olfactory epithelium is composed by neurons having a certain type of olfactory receptor able to combine with an odorous molecule and able to generate an electric impulse. The neurons bring a signal to the olfactory bulb and after both to the cerebral cortex and to the limbic system which is the archive of memories and emotions
Tact
There are two senses involved in touch: pressure and temperature [5].
Pressure: While you are chewing the hardness and consistency of the food is sensed in your mouth. Some foods just seem pleasurable to chew and manipulate in your mouth. Material with the same taste and smell may not bring about a good flavour if it doesn’t feel right in your mouth. A rubbery steak may have a good taste, but its consistency will ruin its flavour.
Temperature: The temperature of the food is another factor in flavour. Some food simply has a better flavour when warm or hot. But also, the heat helps to give off aromas that can add to the flavour. Of course, food too hot that burns mouth is not pleasant to eat. When we eat we feel also tactile sensations, as the crunchy, the friable, the gummy, the smooth, the rough, the grainy, viscous, etc, joined to the nerve endings placed on the filiform papillae, which give us information on the consistency and on the texture of food.
Hearing
During the mastication it is possible to feel also auditory sensations, e.g. thinking to fresh food as some fruits or to others like crackers or cereals or some snacks.
Sight
The great importance that we give to the sight brings us to heavily influence the other sensorial characteristics. Related with taste, a great number of persons, when they have to identify a food react more to its color than its aroma.
A great number of persons are not able to distinguish the aroma of food which should be immediately recognized as meat, fishes or vegetables, when they are obliged to use only the aroma for the identification (e.g. food reduced in puree assayed by blindfold persons). So to eat in addition to taste and smell we also use all the sight and the tact [3].
Brain melting
One of the models about the perception of flavour depends on inputs from multiple sensory modalities, and it is experienced as a unitary percept. The psychophysical characteristics and neural substrates of flavour perception can be modelled in a modality in which the diverse sensory inputs from the mouth and nose become integrated. More specifically, it is argued that a binding mechanism in the somatomotor mouth area of the cortex brings taste, touch, and smell together into a common spatial register and facilitates their perception as a coherent “flavour object.” The neural representation of the flavour object is a distributed pattern of activity across the insula, overlying operculum (including the somatomotor mouth region), orbitofrontal, piriform, and anterior cingulate cortex. In each case sit is clear that the aroma perception is a complex neuronal synthesis process [6,7].
Considering the flavor “a highly complex perception problem”, whose subject (measurement instrument) is an assessment provided by human being and its objectification poses considerable problems.
Recall that according the current and widely accepted definition of “measure” given by Russell [8], for which it is an empirical, objective assignment of numbers to quality of objects and events in the real world,” the first problem is the definition of “quality.” Its definition can be agreed with Finkelstein, for whom “The concept of quality is formed as objective rule for the classification of empirically observable aspects of a set of objects by means of a family of objective relationships identified in this together [9].” While it is clear the objective rule of classification of the “flavor” seems sufficiently clear. In fact the flavor is an empirically observable appearance of the food, on which human beings agree. The situation is different for the identification of the family of objective relations of quality. It has already been mentioned that, for different environments and cultures, human beings called to judge the “flavor” of the same food can give even contradictory empirical evaluations: good or bad. In case of highly integrated quality evaluation (e.g. the perception of color, which has been historically decomposed into superposition of electromagnetic waves), you must check for the components that construct it without give up the primary perception of which human beings are repositories. In the field of extra virgin olive oils, the European Union, considering the human being the ultimate judge of taste, provides an evaluation method based on Panel Test [10-13]. This method uses descriptors which, according to Regulation n° 2568/91 [14], have legal value.
The descriptors have to do essentially with the taste and smell of the oil and the used evaluation procedure try to avoid the influences of visual using special containers, while the tactile and the auditory components, due to oil physical nature, are irrelevant. Going on a road now well traced historically metrology, considering the empirical descriptors set defined by European legislation for the EVO Panel Test, is far from a scientific objectivity, nevertheless they try to find the basic components that can define the flavor. Following the typical metrology approach, these components could be easily projectable on a numerical field so helping to the definition of a depositable standard. For this aim the research group of Roma Tre has been taken into account two methodologies: gas-chromatography and spectro-photometry. In this work, also following the roadmap traced by [15-23], we work with gaschromatography.
Samples
This work was made using eight monocultivar EVOs. The used olive plants family is shown in the legend of the relative chromatogram (Figure 1). The reported chromatogram has been obtained by an Agilent 7820A, using the volatile fraction transferred onto a non-polar capillary column (5% Phenyl, 95% dimethylpolysiloxane, 30 m, 0.32 mm i.d., 0.25 μm film thickness). The oven temperature is held at 75°C for 30 s and programmed to rise at 20°C/min to a final temperature of 200°C, at which it is held for 120 s. 37 peaks were taken into account. Each peak is correlated to a molecule, to the detected compounds and to their relative sensory attributes [24,25]. For the aim of the present work, it is necessary to select a smaller number of GC peaks for each monocultivar. To guarantee a defined result the number of these peaks must be the same of the number of the samples used for the analysis. It is necessary to find a rule to select the eight most significant peaks.
Due to the variability of the gas chromatograms obtained by using the technique HS, it was necessary to normalize them so that the area subtended the 37 peaks is unitary for all samples. In this way the analysis are valuable under the same conditions and so they are comparable. Following, it will be described the selection procedure of the eight peaks:
1. The position of the largest peak of each sample is identified, and among these, the greater is chosen;
2. If point 1 has been executed the first time, skip to step 4, otherwise continue;
3. If the peak chosen has already been previously selected returns to Step 1, otherwise continue
4. The value of all the peaks of the samples in the selected position are considered for subsequent operations;
5. The peak selected in the step1 is cancelled;
6. If you have not identified the eight peaks returns to Step 1, otherwise continue;
7. The positions of the eight peaks were identified.
In Figure 2 is shown the result of the application of the presented algorithm.
The Table 1 shows the peaks chosen with the ordinal number, the chemical species and the aroma correlated:
From the metrological point of view, it is interesting to note the presence of peaks that give negative connotations as 27 and 32. This indicates that also these components have metrological value.
The choice of a limited number of peaks of the chromatogram is made in analytical way, but it implies that not all samples will give the same contribution to the definition of metrology we are looking for.
The “weight” of each peak chosen can be evaluated through the sum of the percentages of the values of the peaks selected (Table 2).
| c7 | Nocellara del Belice | 88.9 % |
| c6 | Tonda Iblea | 76.1 % |
| c2 | Ascolana Tenera | 72.2 % |
| c8 | Frantoio | 68.6 % |
| c4 | Olivastra Saggianese | 65.0 % |
| c5 | Ottobratica | 60.1 % |
| c3 | Casaliva | 59.4 % |
| c1 | Carolea | 58.6 % |
Table 2: In the first column the symbols represent the gas chromatograms of the single cultivar, the second column shows their "label", the third column is the percentage of the gas chromatogram that is implied by the first eight peaks
The sample “Nocellara del Belice,” in our setting, can have an impact on the definition of a physical standard of extra virgin olive oil to one and a half of the sample of Carolea.
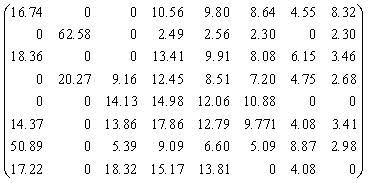
To reach the target, a matrix in which are reported on eight lines the normalized values of the eight peaks chosen according to the algorithm previously discussed has been built. The possibility of obtaining an ortho-normalization is manifold with the trend that the first of the standard, corresponds with the gas chromatogram of monocultivar reported in the first row. To get a most significantly normalization, it was decided to build the matrix (1) to orthogonalize, according to the sequence identified by Table 2.
 (1)
(1)
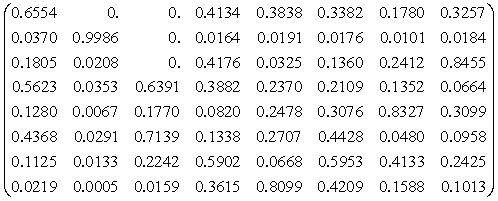
If the above relationship is ortho normalized, a series of orthonormal rows is obtained: their scalar products are zero unless the rows are multiplied by themselves, in this case the result is 1. Below are reported the orthogonal rows obtained.
 (2)
(2)
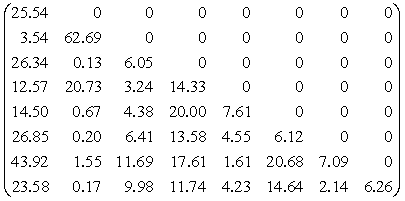
The availability of orthogonal vectors provides the possibility to construct the rows of the matrix (1) by the “weighted” sum of orthonormal vectors whose weights are shown in the matrix (3). The eights shown have to be allocated, per rows, to monocultivar, as ranked in the matrix (1), while the columns refer to the orthogonal vectors with the same indices of the rows of the matrix (2).
 (3)
(3)
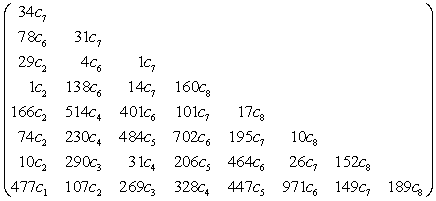
The matrix (3) represents the combination of orthonormal eigenvectors. These represent the monocultivar taken into account for each row. It is possible to verify whether these can be obtained with the empirical combination of them. To do this, we must solve the linear system of which the rows of (3) are the equations that equal the values c1, c2, c3, c4, c5, c6, c7 and c8, respectively. The solution of the problem provides the linear combination of samples that can build individual orthonormal vectors.
 (4)
(4)
In the relational-empirical world of the EVOs, although it is conceivable as a homomorphism with the numerical system, the latter does not admit the possibility of a real operation corresponding to the difference.
This implies that only the natural sample in the system that we have experimentally taken into consideration is c7.
In the second row the sample would be c6-0.0397*c7: there is no possibility of depositing this sample, because in the real world it is inconceivable the removal of oil from another.
It’s possible to think to apply the complementary method of measurement, in which the formation of the quantity to be measured competes the same value of a known quantity, adjusted so that the sum with the value to be measured give the comparison value previously determined.
Applying this concept in an extensive manner, after having analyzed the matrix (4), it is evident that, with the choice indicated in Table 3, you might have a metrology of 11 elements which can be deposited, two of which coincide with two elements of the base that has been built metrologically.
| c6 |
| c7 |
| 477 c2 + c7; |
| c2 + 160 c8; |
| 166 c2 +401 c6 |
| 72 c2 +702 c6 |
| 514 c4 +101 c7 +17 c8; |
| 107 c2 +269 c3 + 971 c6 |
| 230 c4 + 484 c5 + 195 c7 + 10 c8; |
| 10 c2 + 290 c3 +206 c5 +152 c8; |
| 477 c1 + 328 c4 + 447 c5 +149 c7 +169 c8; |
Table 3: list of standard to be deposited, constructed from the samples indicated as cx with x = 1, ..., 8, for application of the method of complementary measurement.
Only the remaining samples to be deposited must be built, 4 on binary base, 2 of ternary base, 2 on quaternary base and one on base 5.
The application of complementary methodology has to be still defined in operational terms.
In the specific case of extra virgin olive oils, the most significant aspect seems to be using the base obtained for the calibration of gas chromatographs
The methodological identification of the coefficients has to be applied to the orthonormal basis for the characterization of samples subjected to measurement and this is possible through software applications. The result will be a list of numbers representing the objective numerical projection of sample