Cell & Developmental Biology
Open Access
ISSN: 2168-9296
ISSN: 2168-9296
Research Article - (2014) Volume 3, Issue 3
The purpose of this study was to determine whether the Low-Density Lipoprotein (LDL) receptor could be directly regulated by high glucose (HG) in human hepatocyte-like C3A cells. C3A cells were cultured in a medium supplemented with BD™ MITO+ serum extender (MITO+ medium), a serum-free, cholesterol deficient medium. We found that HG reduced receptor mRNA levels without significantly affecting overall or plasma membrane receptor protein expression. Interestingly, these effects were also seen in the presence of low glucose + high mannitol (LG +HM). LDL receptor protein synthesis, protein degradation, and receptor function (LDL internalization) were increased by HG and LG+HM. However, no changes in protein expression of proprotein convertase subtilisin kexin type 9 (PCSK9) or the inducible degrader of LDL receptors (IDOL), the known degraders of the LDL receptor, were seen under the same conditions. These results implied that the effects of HG and LG+HM on the expression/ function of the LDL receptor were mostly due to an osmotic stress induced by the high levels of these monosaccharides. Further studies are required to determine how other factors found in diabetic patients, such as high cholesterol and/or high fatty acid levels, may influence the osmotic- dependent regulation of the LDL receptor expression/function due to hyperglycemia.
<Keywords: LDL; LDL receptor; Hyperglycemia; PCSK9; IDOL; Hepatic cells
It is well-known that insulin is the hormone that stimulates cellular absorption and utilization of glucose [1]. Whenever insulin is missing or does not act as it should, as in the case of diabetes mellitus, glucose accumulates in the bloodstream of patients causing several complications [1]. One of these complications from diabetes is atherosclerosis, the major cause of death and disability in the United States [2,3]. Problems associated with diabetes that lead to the formation of the atherosclerotic plaque include 1) endothelial dysfunction, 2) platelet hyperactivation, and 3) dyslipidemia [decreased High Density Lipoprotein (HDL)-cholesterol levels, increased Very Low Density Lipoprotein (VLDL) overproduction, and increased levels and oxidation of small dense LDL particles] [4,5]. High levels of LDL-cholesterol in the serum of diabetic patients are considered a great concern due to the atherogenicity of this lipoprotein particle [6,7]. Indeed, measuring LDL particle number has been proposed as a marker for assessing the risk of developing type 2 diabetes mellitus or cardiovascular disease in patients with metabolic syndrome [7]. It has been suggested that hyperinsulinemia alone is what causes the dyslipidemia seen in diabetic patients, especially in type 1 diabetes [8,9]. Insulin inhibits VLDL production in the liver and activates lipoprotein lipase in adipose tissue resulting in increased degradation of chylomicrons and VLDL particles [8,9]. Furthermore, this hormone plays an important role in HDL metabolism since it activates Lecithin-Cholesterol Acyl Transferase (LCAT) [8]. Insulin also appears to enhance LDL degradation through activation of the hepatic LDL receptor [8,10]. Thus, the absence of insulin contributes to an increase in LDL levels by causing an enhancement in LDL synthesis and a decrease in LDL degradation [8,9]. Similar effects on LDL synthesis and degradation have been reported as a result of insulin-resistance, which is characteristic of type-2 diabetes [11]. Insulin is also critical in maintaining the integrity of the endothelium, and consequently, it prevents the entering of LDL particles into the intima counteracting the formation of atherosclerotic plaques [5,12].
Independently of this apparent association between insulin levels and the activity of the hepatic LDL receptor, there is still a question of whether this receptor could be directly regulated by glucose levels. The purpose of this study was to answer this question by examining theeffects of high levels of glucose on the expression and function of the LDL receptor in the human hepatocyte-like C3A cell line. Interestingly, most of the effects seen appeared to be dueto osmotic stress, since mannitol was as effective as glucose in regulating the expression/function of the LDL receptor.
C3A cell culture
Human hepatocyte-like C3A cells (American Type Culture Collection, Manassas, VA) were maintained at a density of 7 × 10⁸ cells per 75-cm3 flask in low glucose (5.55 mM) Dulbecco’s modified Eagle’s medium (LG-DMEM; Invitrogen; Carlsbad, CA) supplemented with 10% Fetal Bovine Serum (FBS) and antibiotics at 37°C under humidified atmosphere and 5% carbon dioxide. For experiments, cells were set in maintaining medium and incubated for 24 hours. Then, the medium was changed to LG-DMEM medium (also 5.55 mM glucose) where FBS has been replaced with 1 ml/L of BDTM MITO + serum extender (MITO+ medium). Supplementing the medium with BDTM MITO + serum extender, which is composed of low levels of growth factors, hormones and other nutrients that allow cells to grow under a serum-free condition, did not cause detectable morphological and/or growth changes in our cells [13]. Cholesterol levelsin FBS and BDTM MITO + serum extender (BD Biosciences; Sparks, MD) were determined using the Pointe Scientific Cholesterol Oxidase Assay (Fisher Scientific; Pittsburgh, PA). The MITO+ medium was used in these studies as a serum-free, lipid/cholesterol deficient medium (cholesterol concentration of the serum: MITO+ = 0.2625 mg/dL versus FBS = 18.99 mg/dL). Incubation in MITO+ medium was carried out for an additional 24 hours. Treatments with low glucose (5.55 mM; LG), high glucose (27.75 mM; HG), and low glucose + high mannitol (5.55 mM and 22 mM, respectively; LG+HM) were carried out for 24 hours or 6 days. The confluency of the cells at the time of harvesting was maintained between 70-85%. For cycloheximide experiments, in addition to treating with glucose and mannitol, cells were incubated with cycloheximide using the doses and incubation periods indicated in the result section. In some experiments, medium samples were collected prior to harvesting cells to determine secreted proprotein convertase subtilisin kexin type 9 (PCSK9) levels using ELISA (R&D Systems; Minneapolis, MN).
RNA preparation and quantitative real-time PCR
Total RNA was prepared using TRI Reagent (Molecular Research Center; Cincinnati, OH) and further purified using the RNeasy Min Elute Cleanup kit (Qiagen; Valencia, CA). Concentration and purity of RNA samples were determined using a Nanodrop 2000. Integrity of RNA samples was confirmed using electrophoresis. RNA samples were DNase I treated and reverse transcribed using standard methods. Real-time PCR reactions were performed using 100 ng of ssDNA, the Applied Biosystems SYBR green PCR Master Mix, and the AB real-time PCR system (Applied Biosystems; Foster City, CA). Human LDL receptor and 18s rRNA specific primers were obtained from SA Biosciences (Frederick, MD). The sizes of PCR fragments that were amplified were 87 and 100 bp, respectively. The parameters for PCR were: denaturation at95°C for 10 minutes, followed by 45 cycles of denaturation at 95°C for 30 seconds, annealing at 60°C for 15 seconds, and extension at 72°C for 30 seconds. Quantitation was performed using the Comparative CT method [14].
Preparation of cell lysates and Western blotting analysis
Lysates were prepared using ice-cold RIPA buffer (25 Mm Tris-HCl, pH 7.6, 150 mMNaCl,1% NP-40, 1% sodium deoxycholate, 0.1% SDS, and protease and phosphate inhibitors) according to the manufacturer’s recommendations (Pierce; Rockford, IL). Protein concentrations were determined using the BCA protein assay (Pierce). Equivalent amounts of proteins were denatured in reducing sample buffer (Pierce) at 70°C for 5 minutes and subjected toelectrophoresis on precast 4-20% SDS-PAGEs (Pierce). Electro blotting onto nitrocellulose membranes, staining with 0.1% Ponceau S (in 5% acetic acid) to verify protein loading, and Western blotting analysis were performed at that point. Primary antibodies used herein were rabbit anti-LDL receptor (diluted 1:2000; see acknowledgements), mouse anti-PCSK9 (diluted1:1000; Cayman Chemicals; Ann Arbor, MI), rabbit anti-inducible degrader of LDL receptors (IDOL) (diluted 1:1000; Pierce), and goat anti-actin (diluted 1:250; internal control; Santa Cruz Biotechnology; Santa Cruz, CA). Primary antibodies bound to membranes were detected using HRP-labeled secondary antibodies (Santa Cruz Biotechnology) and the Super Signal West Pico chemiluminescence substrate (Pierce). Multiple exposures ranging from 0.5 s to 20 minutes and quantitation of the exposures were made using a Kodak Image Station 4000R Pro Imaging System and the Kodak Molecular Imaging software (New Haven, CT).
Immunofluorescence microscopy
Cells plated in collagen-coated 12-well plates (Fisher Scientific) were treated with LG and HG in MITO+ medium for 24 hours. Fixation (3.5% paraformaldehyde/PBS), permeabilization (0.1% Triton X-100/PBS), and blocking (Rockland blocking buffer; Gilbertsville, PA) were carried out using standard methods. Incubation with the mouse clone C7 anti-LDL receptor antibody (American Type Culture Collection) diluted at 4 ng/μl in blocking buffer/0.1% Tween20 was carried out overnight at 4°C. After washing with PBS/0.1% Tween 20, anti-mouse alexafluor 488 antibody diluted 1:400 in PBS/0.5% Tween-20 was added followed by incubation for 1 hour at room temperature. After washing again, images were collected with an Olympus IX51 confocal microscope (Olympus; Center Valley, PA) equipped with an Olympus LUCPlanFLN, 4X/0.6 Ph2, ∞/0-2/FN22, UIS2 objective. The frame size was 800 x 560, mono12bit, 1.10µm/px calibration. Quantitation of fluorescence was carried out using the NIS-Elements Br Microscope Imaging Software (Nikon; Melville, NY) and/or by reading in a BMG Labtech PHERA star TM 5 fluorescent plate reader with excitation 465-495 nm and emission 515-555 nm for alexafluor 488. Nuclei staining (internal control) were done with Hoeschst 33342 using standard methods. Hoeschst staining was quantitated as described for alexafluor 488 but using excitation 340-380 nm and emission 435-485 nm.
Tetrazolium-based colorimetric assay (MTT)
Cell viability was determined using the MTT cell proliferation assay. For this, 1 × 10⁴ C3A cells/well were seeded onto 96-well plates in 100 μl of maintaining medium. After 16 hours of adherence, cells were changed to MITO+ medium and incubated for another 24 hours. At that point, cells received the following MITO+ media: NG (no glucose or mannitol), LG (5.55 mM), LM (no glucose; 5.5 mM mannitol), HG (27.75 mM glucose), HM (no glucose; 27.5 mM mannitol), and LG+HM (5.5 mM glucose; 22 mM mannitol). Some cells were incubated in maintaining medium (MMe; 5.55 mM glucose). Cells were incubated in these treatments for exactly 24 hours. Cells were exposed to the MTT dye (5 mg/mL) for 2 hours at 37°C. The resulting formazan crystals were solubilized with dimethyl sulfoxide, and the absorbance wasmeasured at 540 nm with a BMG Labtech PHERA star TM plate reader.
Calculation of Osmotic Pressure
The osmotic pressure (Π) at 37°C for each medium based on glucose/mannitol concentration was calculated using the Morse equation [15]: Π= I M R T I - van't Hoff factor (1 was used for glucose and mannitol) M - concentration of glucose and/or mannitol (mol.L-1) R - Gas constant (0.08205746 L.atm.K-1.mol-1) T - Temperature (310 K - corresponding to 37°C)
Nascent protein synthesis studies
LDL receptor protein synthesis was measured using a modification of the Click-IT method from Invitrogen [16,17]. Briefly, cells treated with LG, HG, and LG+HM for 24 hours or 6 days were incubated with methionine-free MITO+ medium (Invitrogen) with treatments for 1 hour at 37°C. At that point, 50 µM of Click-IT L-homopropargyl glycine (HPG; alkyne) was added, andcells were incubated for an additional 4 hours to allow nascent protein synthesis. Cell lysates were prepared using immunoprecipitation buffer (0.25 M sucrose, 0.05% SDS, 1% triton X-100, 0.5% sodium deoxycholate, 0.32 M NaCl, 2mM CaCl2, and protease inhibitors). Protein concentrations were measured using the BCA assay. Eight hundred µg of total proteins were incubated overnight at 4°C with 10 µg of the mouse C7 anti-LDL receptor antibody in dilution buffer (1 mg/mL BSA, 0.1% triton X-100, 1 mM Tris-HCl, pH 8.0, 140 mM NaCl, and protease inhibitors). At that point, 50 µl of protein A/G magnetic beads was added, and the samples were incubated for an additional 2 hours at room temperature. Beads were pulled to the side of the tube using a magnetic stand. After discarding the solution, the beads were washed two times with dilution buffer and resuspended in 100 µl of 0.1 M Glycine pH 2.0. Elution of the proteins/antibody complex was completed by incubating at room temperature for 10 minutes. After applying magnetic field to pull beads to the side of the tube, the solution was transferred to a fresh tube containing 15 µl of 1 M Tris-HCl pH 8.5. The modified (newly synthesized) LDL receptor protein was detected with alexafluor 647 (azide) and the Click-IT protein reaction buffer kit from Invitrogen. Alexafluor 647 labeled proteins were then detected using the Li- COR infrared scanner with microplate settings, sensitivity of 5 and resolution of 169 μm in the700 nm wavelength channel. Quantitation of the images was performed using the Li-COR software. Western blotting analysis of total LDL receptor protein was performed using a rabbit anti-LDL receptor antibody as described above.
Bodipy-LDL internalization studies
After treatment for 24 hours, cells were incubated on ice for 20 minutes to stop cycling of the LDL receptor. At that point, 5 µg/ml of bodipy-LDL (Invitrogen) was added to some of the wells. LDL binding was allowed by incubating for 1 hour at 4°C. Plates were then transferred to 37°C and incubated for exactly 45 minutes to allow internalization of LDL. Cells were washedtwice with ice-cold PBS and suspended by gently scraping into PBS/2 mM EDTA. Bodipy-LDL binding and internalization data was collected using the BD FACSAria Cell Sorter system (BD Biosciences). This flow cytometer is equipped with a 488 nm laser (exciting probe) and a FITC emission channel, FL1 (505 LP, 530/10 BP), which were used to detect bodipy. Percentage fluorescent cells were defined as the percentage of cells within each subpopulation with fluorescence intensity exceeding that of the maximum level of autofluorescence of unlabeled cells in the same subpopulation. Mean fluorescence intensities were recorded for 10,000 events for each experiment. In some experiments, mouse clone C7 anti-LDL receptor antibody (50µg/ml) was added to some well prior to adding bodipy-LDL. This antibody is used to prevent internalization of LDL via the receptor [18].
Cell Surface Biotinylation studies
After treating for 6 days, cells were cooled on ice for 30 minutes to stop cycling of the receptor and washed three times with ice-cold PBS. Biotinylation of plasma membrane proteins was carried by incubating cells for 2 hours at 4°C with 0.5 mg/mL of the membrane impermeable sulfo-NHS-SS-biotin (Sulfosuccinimidyl-2-(biotinamido)-ethyl-1,3'-dithiopropionate) dissolved in PBS. At that point, cells were washed once with 100 mM Tris-HCl, pH 7.7, followed by incubation in a fresh aliquot of 100 mMTris-HCl, pH 7.7, for 30 minutes at 4°C, to quench any residual biotin reagent. After washing twice in ice-cold PBS, cell extracts were prepared in immunoprecipitation buffer as described for the nascent protein synthesis studies. Two different methods were employed to identify biotinylated (plasma membrane) LDL receptors. For method#1, 400 μg of cell lysates were mixed with 100 μl of 50% streptavidin-magnetic beads in dilution buffer. Samples were incubated overnight at 4oC with rotation. On the next day, the reactions were removed from the rotator and placed on a magnetic stand to pellet beads to the side of the tube. The supernatant (containing non-biotinylated proteins; intracellular proteins; IC) was analyzed by Western blotting using the rabbit anti-LDL receptor antibody. Magnetic beads (containing biotinylated proteins; plasma membrane; PM) were washed twice in dilution buffer and once in washing buffer (10 mMTris-HCl, pH 8.0, 140 mM NaCl, and protease inhibitors). After the last wash, the beads were resuspended in 50 μL of 50 mM DTT (cleave the biotin group releasing the protein) and heated at 50°C for 30 minutes to elute proteins. After briefly spinning, samples were placed on the magnetic stand to pellet beads and remove supernatant (eluted proteins – no longer biotinylated; plasma membrane protein; PM). Western blotting analysis was once again carried out using the rabbit anti-LDL receptor antibody. Staining with Ponceau solution was used to correct for equal loading of PM proteins into each well. Probing with goat anti-actin demonstrated that this intracellular protein was only detected in the IC group (data not shown). For method #2, 400 µg of cell lysates were incubated overnight at 4°C with 5µg of the mouse C7 anti-LDL receptor antibody in dilution buffer. Next, 50 µl of protein G/A magnetic beads were added, and the samples were incubated for an additional 2 hours at room temperature. Beads were pulled to the side of the tube using a magnetic stand. After discarding the solution, the beads were washed two times with dilution buffer and resuspended in 100 µl of 0.1 M Glycine pH 2.0. Elution of the protein/antibody complex was completed by incubating at room temperature for 10 minutes. After applying magnetic field to pull beads, the solution was transferred to a fresh tube containing 15 µl of 1 M Tris-HCl pH 8.5. Western blotting analysis was carried out using avidin-HRP to determine biotinylated (PM) LDL receptor levels. Western blotting analysis using the rabbit anti-LDL receptor antibody was carried to correct for total LDL receptor proteins loaded into each well.
Statistical analysis
Data from the individual parameters were compared by analysis of variance (ANOVA) followed by Student–Newman–Keuls multiple comparison test or t-test, when applicable, using the Graph Pad Prism 5 software (Graph Pad Software, Inc., La Jolla, CA). A p<0.05 was considered significant for all tests.
We started by determining whether high glucose levels directly affected the expression and function of the LDL receptor in the HepG2 derived cell line, C3A. These cells were selected for our studies because, unlike HepG2, C3A retains many of the properties of the normal human hepatocytes, which include 1) strong contact inhibition of growth at confluency, 2) high expression of albumin, and 3) an ability to grow in glucose deficient medium [19]. Other advantages of using C3A cells over HepG2 are that they are composed of a homogenous population of cells and that their phenotype can be maintained indefinitely [19].
For experiments, cells were cultured in low-glucose (LG; 5.55 mM) MITO+ (serum- free/cholesterol deficient) medium for 24 hours before adding treatments. At this point, some flasks received additional glucose up to 27.75 mM (high glucose; HG) or 22 mM mannitol (osmotic control; LG+HM). It is important to mention that this high concentration of glucose is similar to the concentration used in previous studies to induce hyperglycemia in vitro [20,21] but lower than the amount of glucose (35 mM or higher) known to cause apoptosis in HepG2 cells [22]. Media supplemented with LG, HG, or LG+HM were replaced every two days. Cells were harvested on the 6th day of treatment and used for determinations of LDL receptor mRNA levels. As illustrated in Figure 1A, HG medium resulted in a 71.6% (p<0.0001) reduction in receptor mRNA expression. A reduction (36%; p<0.001) in receptor mRNA levels in response to HG was seen as soon as 24 hours (data not shown). Interestingly, a significant reduction inreceptor mRNA levels was also observed in the presence of LG+HM medium (73.7%; p=0.0004; Figure 1A).
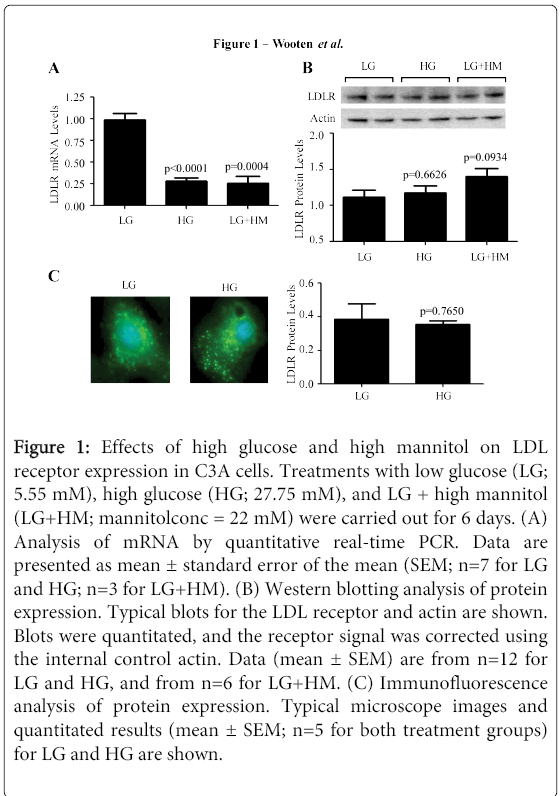
Figure 1: Effects of high glucose and high mannitol on LDL receptor expression in C3A cells. Treatments with low glucose (LG; 5.55 mM), high glucose (HG; 27.75 mM), and LG + high mannitol (LG+HM; mannitolconc = 22 mM) were carried out for 6 days. (A) Analysis of mRNA by quantitative real-time PCR. Data are presented as mean ± standard error of the mean (SEM; n=7 for LG and HG; n=3 for LG+HM). (B) Western blotting analysis of protein expression. Typical blots for the LDL receptor and actin are shown. Blots were quantitated, and the receptor signal was corrected using the internal control actin. Data (mean ± SEM) are from n=12 for LG and HG, and from n=6 for LG+HM. (C) Immunofluorescence analysis of protein expression. Typical microscope images and quantitated results (mean ± SEM; n=5 for both treatment groups) for LG and HG are shown.
The next step was to investigate whether the decrease in receptor mRNA levels in response to HG and LG+HM would correlate with a corresponding reduction in LDL receptor proteinexpression. For this, C3A cells were treated as indicated above and analyzed for receptor protein levels using Western blotting (Figure 1B) and immunofluorescence microscopy (Figure 1C). Surprisingly, no significant differences in LDL receptor protein expression were observed in Western blotting (p=0.6626 for HG and p=0.0934 for LG+HM; Figure 1B) or immunofluorescence microscopy (p=0.765 for HG; Figure 1C). Similar results were obtained in cells incubated with the treatments for 24 hours.
One surprising finding was that adding extra mannitol had the same effect on the regulation of the LDL receptor mRNA and protein expression than adding extra glucose. This brought forward the possibility that the effects seen were mostly due to an osmotic stress upon the cells rather than a glucose-specific effect. As shown in Figure 2, the osmotic pressure of MITO+ medium supplemented with either HG or LG+HM was five times higher than the osmotic pressure of MITO+ medium containing LG. Thus, the experiments were repeated including other controls like no glucose or mannitol (NG), low mannitol without glucose (LM), and High Mannitol without glucose (HM). Interestingly, it was noticed that most cells grown in absence of glucose, even if mannitol was present, died during the first 24 hours of treatment. MTT assays were then carried out to measure the viability of cells grown in different media. As depicted, growing cells in NG, LM, and HM media significantly (p<0.0001) reduced the viability of the cells by 86.6, 90.6, and 80.4%, respectively (Figure 2), possibly to starvation of the cells due to the lack of glucose and lipids. Reductions in cell viability were also observed in presence of HG (3.5%) and LG+HM (9.3%) media, but these reductions were statistically insignificant (p=0.805 and p=0.613, respectively) when compared to cells grown in LG medium (Figure 2). These results suggest that the effects of HG and LG+HM on LDL receptor expression may be induced by osmotic stress. Since the data suggested a dissociation between LDL receptor mRNA and protein responses to HG and LG+HM, we speculated that to compensate for the low mRNA levels while maintaining receptor protein expression constant, the treatments must either increase the translational efficiency of the receptor mRNA, decrease the degradation rate of the receptor protein, or both. To start examining the first possibility, nascent protein synthesis studies were done. Figure 3A illustrates the infrared readings of alexafluor 647 labeled (newly synthesized) LDL receptors at 24 hours with the three treatments.
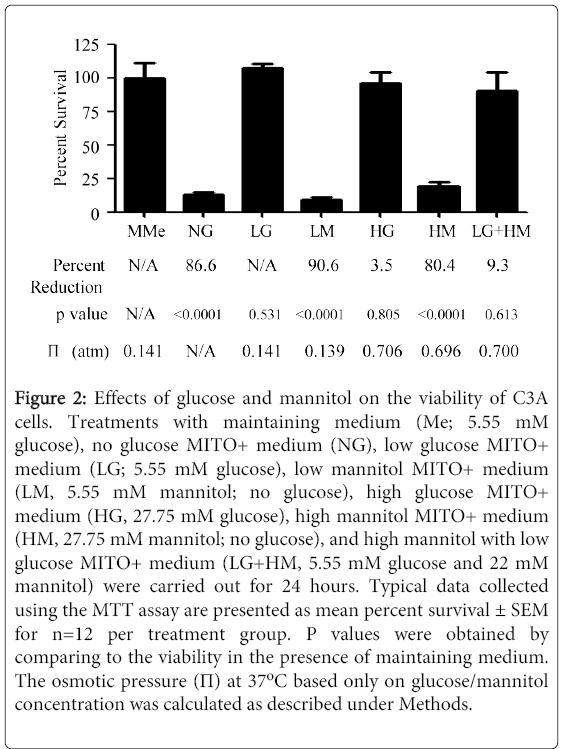
Figure 2: Effects of glucose and mannitol on the viability of C3A cells. Treatments with maintaining medium (Me; 5.55 mM glucose), no glucose MITO+ medium (NG), low glucose MITO+ medium (LG; 5.55 mM glucose), low mannitol MITO+ medium (LM, 5.55 mM mannitol; no glucose), high glucose MITO+ medium (HG, 27.75 mM glucose), high mannitol MITO+ medium (HM, 27.75 mM mannitol; no glucose), and high mannitol with low glucose MITO+ medium (LG+HM, 5.55 mM glucose and 22 mM mannitol) were carried out for 24 hours. Typical data collected using the MTT assay are presented as mean percent survival ± SEM for n=12 per treatment group. P values were obtained by comparing to the viability in the presence of maintaining medium. The osmotic pressure (Π) at 377°C based only on glucose/mannitol concentration was calculated as described under Methods.
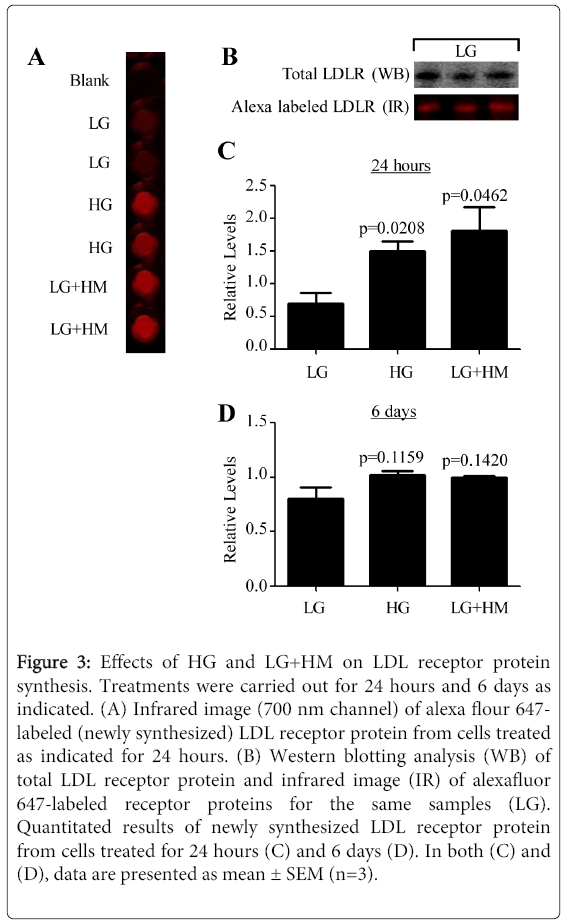
Figure 3: Effects of HG and LG+HM on LDL receptor protein synthesis. Treatments were carried out for 24 hours and 6 days as indicated. (A) Infrared image (700 nm channel) of alexa flour 647- labeled (newly synthesized) LDL receptor protein from cells treated as indicated for 24 hours. (B) Western blotting analysis (WB) of total LDL receptor protein and infrared image (IR) of alexafluor 647-labeled receptor proteins for the same samples (LG). Quantitated results of newly synthesized LDL receptor protein from cells treated for 24 hours (C) and 6 days (D). In both (C) and (D), data are presented as mean ± SEM (n=3).
Confirmation that the alexafluor 647signal corresponded to LDL receptor protein was done using Western blotting analysis (Figure 3B). As shown in Figure 3C, at 24 hours, the LDL receptor protein synthesis was significantly increased 2.14- (p=0.0208) and 2.56-fold (p=0.0462) by HG and LG+HM, respectively. After 6 days of treatment, the levels of LDL receptor protein synthesis were comparable to that of the LG sample (p=0.1159 for HG; p=0.1420 for LG+HM). These data indicated that in the presence of HG and LG+HM, the receptor mRNA was translated 4.5 and 4.74 times, respectively, more efficiently than in the presence of LG.
The second possibility was tested by performing cycloheximide studies. For this, determinations of the appropriate dose of cycloheximide and incubation time with this inhibitor of protein synthesis to be used in these studies were carried out first. Figure 4A illustrates the results for the dose-response experiment in LG. As shown, all three concentrations of cycloheximide between 100 µM and 1 mM caused reductions in LDL receptor proteinexpression between 75 and 83%, respectively. Of these concentrations, 100 µM was selected for the time course experiment because it was the only dose that did not cause a significant decrease in cell viability (p=0.4286) (data not shown). 500 µM and 1 mM of cycloheximide significantly (p<0.01) reduced cell viability by 64.3 and 39.7%, respectively (data not shown).
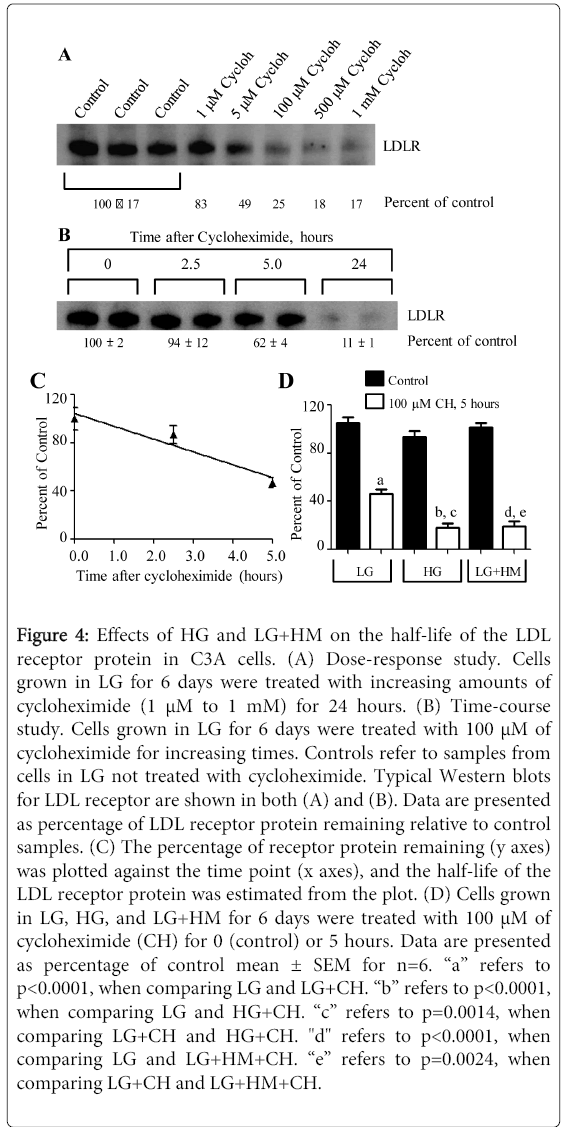
Figure 4: Effects of HG and LG+HM on the half-life of the LDL receptor protein in C3A cells. (A) Dose-response study. Cells grown in LG for 6 days were treated with increasing amounts of cycloheximide (1 μM to 1 mM) for 24 hours. (B) Time-course study. Cells grown in LG for 6 days were treated with 100 μM of cycloheximide for increasing times. Controls refer to samples from cells in LG not treated with cycloheximide. Typical Western blots for LDL receptor are shown in both (A) and (B). Data are presented as percentage of LDL receptor protein remaining relative to control samples. (C) The percentage of receptor protein remaining (y axes) was plotted against the time point (x axes), and the half-life of the LDL receptor protein was estimated from the plot. (D) Cells grown in LG, HG, and LG+HM for 6 days were treated with 100 μM of cycloheximide (CH) for 0 (control) or 5 hours. Data are presented as percentage of control mean ± SEM for n=6. “a” refers to p<0.0001, when comparing LG and LG+CH. “b” refers to p<0.0001, when comparing LG and HG+CH. “c” refers to p=0.0014, when comparing LG+CH and HG+CH. "d" refers to p<0.0001, when comparing LG and LG+HM+CH. “e” refers to p=0.0024, when comparing LG+CH and LG+HM+CH.
The results of the time-course study in LG are shown in Figure 4B. As depicted, the reduction in LDL receptor protein expression as a result of cycloheximide treatment was time dependent. This was confirmed in the graph shown in Figure 4C. From the plot, it was estimated that the half- life of the LDL receptor protein in C3A cells grown in LG, for 6 days, was 5 hours. Studieswere also performed in HG and LG+HM (Figure 4D). For this experiment, cells were treated with LG, HG, and LG+HM for 6 days and then, with and without 100 µM of cycloheximide for 5 hours. Surprisingly, HG and LG+HM decreased the amount of LDL receptor protein remaining at 5 hours by 60.3% (p=0.0014) and 57.6% (p=0.0024), respectively, as compared to LG. These results suggest that the HG- and LG+HM-dependent increases in LDL receptor protein synthesis were sufficient to compensate for the low LDL receptor mRNA levels and the increases in receptor protein degradation.
Thus far, two proteins have been implicated in the degradation of the LDL receptor protein, proprotein convertase subtilisin kexin type 9 (PCSK9) and the inducible degrader of LDL receptors (IDOL) [23-26]. PCSK9 is a convertase that interacts with the EGF-A repeat of the LDL receptor at the surface of hepatic cells, and as a result, the receptor is directed to the lysosome to be degraded [23,24]. IDOL (or as also called, Mylip), on the other hand, works by enhancing the ubiquitination of the LDL receptor at the sequence 830KTTE, which also leads todegradation of the receptor also in the lysosomes [25,26].
Based on this information, the next step was to examine whether the expression of PCSK9 and/or IDOL could be altered by HG and LG+HM. As shown in Figure 5A, HG had no significant effects on the expression of PCSK9 protein, intracellularly (p=0.8260 for precursor; p=0.7324for mature) or in the medium (p=0.1504), when compared to LG. Likewise, no significant changes in the protein levels of IDOL were observed in response to HG (p=0.8797) (Figure 5B). Similar results were obtained in the presence of LG+HM (Figure 5C for PCSK9; Figure 5D for IDOL). Since the degradation of the LDL receptor protein is increased in the presence of HG and LG+HM, it could be possible that the osmotic stress induced by glucose or mannitol might enhance the activity of PCSK9 and/or IDOL without affecting their overall protein expression levels. Another possibility could be that an additional, still unknown, regulator of LDL receptor protein degradation, working downstream of PCSK9 and/or IDOL, is enhanced in response tothe treatments. It is important to point out that the mRNA expression of these degraders was also unaffected by the treatments (p=0.1956 for PCSK9; p=0.2521 for IDOL; data not shown) supporting the possibility that could be another degrader for the LDL receptor. Further studiesare required to investigate this.
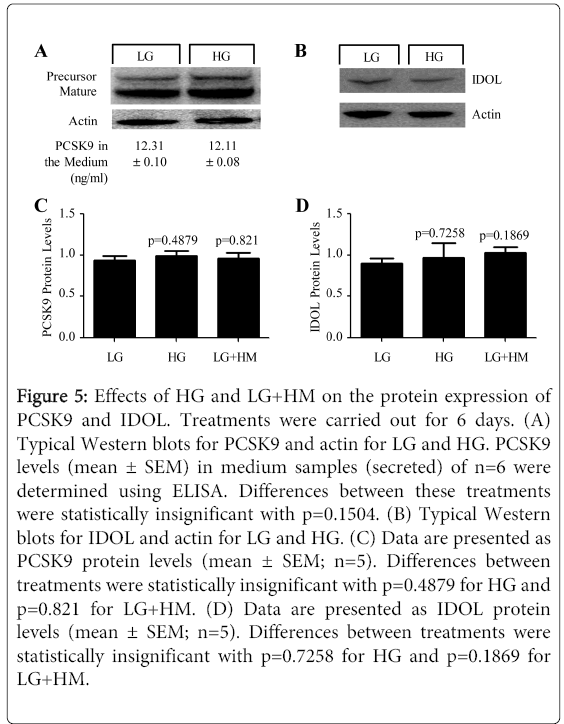
Figure 5: Effects of HG and LG+HM on the protein expression of PCSK9 and IDOL. Treatments were carried out for 6 days. (A) Typical Western blots for PCSK9 and actin for LG and HG. PCSK9 levels (mean ± SEM) in medium samples (secreted) of n=6 were determined using ELISA. Differences between these treatments were statistically insignificant with p=0.1504. (B) Typical Western blots for IDOL and actin for LG and HG. (C) Data are presented as PCSK9 protein levels (mean ± SEM; n=5). Differences between treatments were statistically insignificant with p=0.4879 for HG and p=0.821 for LG+HM. (D) Data are presented as IDOL protein levels (mean ± SEM; n=5). Differences between treatments were statistically insignificant with p=0.7258 for HG and p=0.1869 for LG+HM.
The LDL receptor removes LDL from the circulation through the pathway known as cycling of the LDL receptor. This is the same cycle that leads to degradation of receptors and replacement of degraded LDL receptor molecules with newly synthesized receptors. Thus, an induction in receptor protein synthesis (Figure 3) and degradation (Figure 4) could be a consequence of increased cycling (function) of the LDL receptor. To determine whether HG and LG+HM were able to increase the function of the LDL receptor, bodipy-LDL internalization studies were carried. As expected, treating with both HG and LG+HM for 24 hours caused a significant induction (1.66- and 1.91-fold, respectively) in the internalization of bodipy-LDL (Figure 6A; p=0.0023 for HG; p=0.0035 for LG+HM). Interestingly, adding C7 anti-LDL receptor antibody before exposing cells to bodipy-LDL prevented (p=0.0019) the HG-dependent increase in LDL internalization (Figure 6B). These results clearly indicate that the internalization of bodipy-LDL in response to HG was mediated by the LDL receptor.
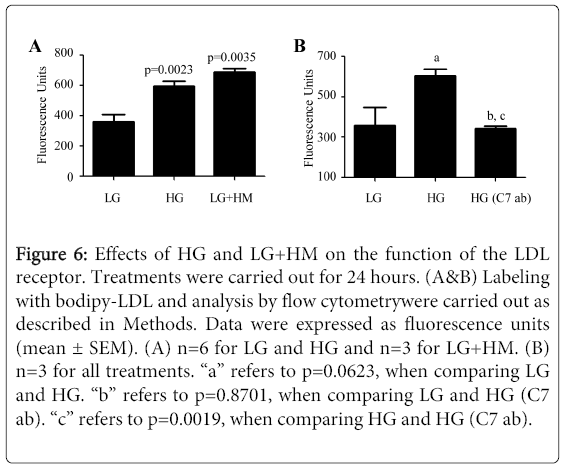
Figure 6: Effects of HG and LG+HM on the function of the LDL receptor. Treatments were carried out for 24 hours. (A&B) Labeling with bodipy-LDL and analysis by flow cytometrywere carried out as described in Methods. Data were expressed as fluorescence units (mean ± SEM). (A) n=6 for LG and HG and n=3 for LG+HM. (B) n=3 for all treatments. “a” refers to p=0.0623, when comparing LG and HG. “b” refers to p=0.8701, when comparing LG and HG (C7 ab). “c” refers to p=0.0019, when comparing HG and HG (C7 ab).
To determine whether this increase in LDL internalization in response to HG and LG+HM was not due to an increase in the number of LDL receptors that were present at the plasma membrane, biotinylation studies were carried out. As shown in Figure 7A and Figure 7B, there was no significant difference in the amount of LDL receptor protein present at the plasma membrane (PM; p=0.3506) or intracellularly (IC; p=0.3948) under LG and HG. Similar results were obtained when non-permeabilized LG and HG treated cells were probed with the C7 anti-LDL receptor antibody followed by anti-mouse alexafluor 488 (data not shown; p=0.9756 for n=4). Once again, these findings were confirmed in the presence of LG+HM. These data suggested that the increase in LDL internalization as a result of HG and LG+HM was due to an increase in cycling (function) of the LDL receptor. It is important to point out that the effects on LDL receptor cycling reported herein differ from a previous study demonstrating that incubating cells in hypertonic medium (induced by supplementing with 0.45M sucrose) prevents LDL internalization via the receptor [27]. One possible explanation for this discrepancy could be that highest osmotic pressure of our treatments (0.706 atm for HG) was significantly lower than the osmotic pressure induced by 0.45M sucrose (Π = 11.447 atm) [27].
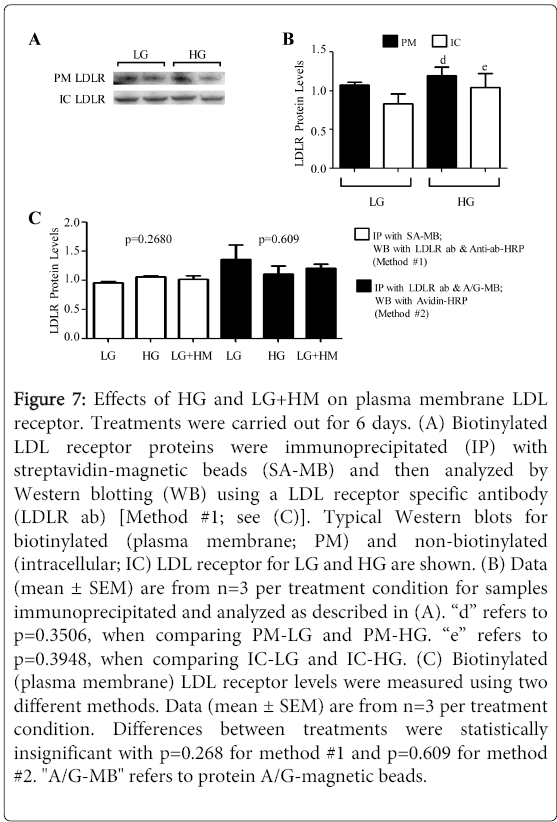
Figure 7: Effects of HG and LG+HM on plasma membrane LDL receptor. Treatments were carried out for 6 days. (A) Biotinylated LDL receptor proteins were immunoprecipitated (IP) with streptavidin-magnetic beads (SA-MB) and then analyzed by Western blotting (WB) using a LDL receptor specific antibody (LDLR ab) [Method #1; see (C)]. Typical Western blots for biotinylated (plasma membrane; PM) and non-biotinylated (intracellular; IC) LDL receptor for LG and HG are shown. (B) Data (mean ± SEM) are from n=3 per treatment condition for samples immunoprecipitated and analyzed as described in (A). “d” refers to p=0.3506, when comparing PM-LG and PM-HG. “e” refers to p=0.3948, when comparing IC-LG and IC-HG. (C) Biotinylated (plasma membrane) LDL receptor levels were measured using two different methods. Data (mean ± SEM) are from n=3 per treatment condition. Differences between treatments were statistically insignificant with p=0.268 for method #1 and p=0.609 for method #2. "A/G-MB" refers to protein A/G-magnetic beads.
In summary, growing human hepatocyte-like C3A cells in MITO+ medium supplemented with an osmotic stressor (extra glucose, mannitol, or L-glucose; data not shown for L-glucose) resulted in a reduction in LDL receptor mRNA expression without significantly affecting steady- state or plasma membrane levels of receptor protein. Unexpectedly, LDL receptor protein degradation was increased in response to the treatments without a significant change on PCSK9 or IDOL protein levels, the two proteins know to be involved in the degradation of the LDL receptor. The low levels in receptor mRNA expression and the increased LDL receptor protein degradation were compensated by a striking increase in receptor protein synthesis. HG and LG+HM also raised the rate of LDL internalization in a receptor dependent manner suggesting that the increases in receptor protein synthesis and degradation rates were the result of increased cycling (function) of the LDL receptor. In diabetes, any osmotic stress induced by hyperglycemia may be able to directly modulate the expression and function of the LDL receptor via transcriptional and post-transcriptional mechanisms. However, further studies are required to determine how other factors found in diabetic patients, such as high cholesterol and/or high fatty acid levels, influence the hyperglycemic-dependent effects on the LDL receptor expression/function.
The project described was supported by funds from the State of North Carolina. The authors would like to acknowledge the support of the Golden LEAF Foundation, BRITE, and Dr. Li-An Yeh. We thank Dr. Gene C. Ness (Department of Molecular Medicine, University of South Florida, Tampa, FL) for kindly providing the rabbit anti-LDL receptor antibody. We also thank the Summer Venture students, Emily Pounds and Ashton Copeland, for help with some of the internalization experiments, and Sam Witherspoon for his assistance with the flow cytometer.