Journal of Applied Pharmacy
Open Access
ISSN: 1920-4159
ISSN: 1920-4159
Research Article - (2023)Volume 15, Issue 5
Natural biopolymers are the most likely choice for biomedical applications. Starches consider the best materials for such applications. This came from the fact of their natural origin and the high biodegradable behavior. Native starches have weak hydrogen bonding make it not likely for drug delivery application as well as to leaching behavior. To make starch useful as drug delivery carrier, this hydrogen bonding must get stronger. In this work native sweet potato starch was used. The hydrogen bonding between starch molecules was enhanced by using glycerol as hydrogen bonding source and Sodium Alginate (SA) as thickener phase. This blend was tested using FTIR and DSC, depending on the test results, an improvement with hydrogen bonding was take place. A microfluidic capillary was used to form microspheres using total flow rates ranging from 0.00062 cm/sec-0.00031 cm/sec. The starch/SA/ glycerol was used as dispersed phase and PVA+tween 80 was used as continuous phase. Starch microspheres was successfully formed with diameter range from 151 μm-263 μm.
Biopolymer; Starch; Alginate; Glycerol; Rheology; Microfluidic; Microsphere
Two types of difficulties arise when working with biopolymer solutions; the phase diagrams are not universally established and need to be redrawn for any new sample and immiscibility of synthetic polymers in organic solvents is based on the Flory- Huggins lattice theory (FH). Polymer microspheres are one of the most common types and hold several advantages including encapsulation for many types of drugs such as small molecules, proteins and nucleic acids and are easily administered through a syringe needle.
Starches are composed of α-d-glucose with the general chemical composition (C6H10O5)n and consists of two different polysaccharide molecules (the linear amylose and the highly branched amylopectin). As starch granules exposed to hot water they swell, loss their crystallinity and leaching amylose as they absorb water. As amylose content increase in starch, its swelling ability will decrease as well as to poor gel formation. To improve starch ability to dissolve in water the modified due to chemical and physical modification processing methods to produce functional groups including cross-linked, oxidized, acetylated, hydroxypropylated, partially hydrolyzed molecules. The modification process help strengthening hydrogen bonding that enhanced the ability of starch to form stable gel without leaching.
SA forms hydrogen bonding with water as well as to inter/intramolecular hydrogen bonding within SA. These bonds are break up upon heating making SA pass through three states: Hydrogen bonded with water → hydrogen bonded with O5 → relatively free, this confirms the existence of inter/intra-molecular hydrogen bonds relating to hydroxyl groups in SA chains. Besides the strong hydrogen bonding between starch and SA, low concentrations of glycerol decrease mobility of starch molecules because of increasing hydrogen bonding that enhanced intermolecular interaction [1].
Microfluidic flow focusing devices using two distinct methods of flow control: I. Control of the flow rates of the two phases and II. Control of the inlet pressures of the two phases. The flow focusing devise is very popular in microfluidics because it able to deliver bubbles at frequencies exceeding 105 bubbles per second.
Iraqi sweet potato starch, Polyvinyl Alcohol (PVA) (Mw-1, 24000- Da) purchased from Sigma Aldrich (New Delhi, India), tween 80 and medical glycerol. De Ionized water DI.
Method of microspheres phases preparation
Continuous phase (Phase 1): 3 g of PVA was dissolved in 100 ml of DI water using magnetic stirrer for 1 hour at room temperature followed by adding 3 ml of Tween 80 with continuous stirring for another 15 minute. The solution kept to rest for 30 minutes before using.
Dispersed phase (Phase 2): The dispersed phase was the solutions prepared as following:
Potato starch was extracted from Iraqi sweet potato. The potato was smashed into thin slices and washed with water to allow starch to settle down in the bottom of container. Then the starch washed 5 times in DI water and let to settle down to pour the water. The resulting starch dried in oven at 50°C for 10 hr. Then solutions of the concentrations show in Table 1 were dissolved in DI water and stirred at 100°C for 15 minute till the starch become lightly transparent, followed by adding glycerol with stirring at 100°C for 20 minute. This method was applied for each concentration. A sealed glass beaker was used to prepare the samples followed by adding ethanol to solution and stirring for 15 minute before cooling to room temperature. The samples cooled to room temperature and left for 5 days before using (Figure 1) [2].
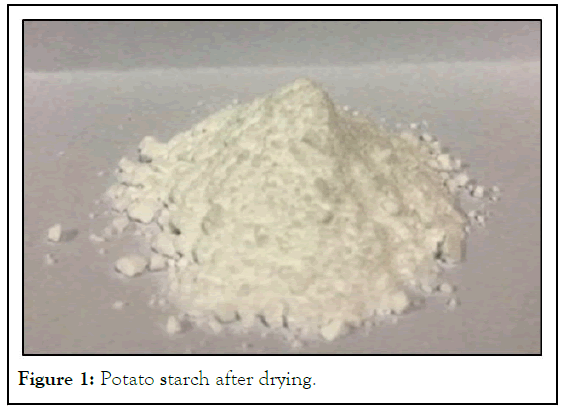
Figure 1: Potato starch after drying.
To enhance starch flow properties and to raise its viscosity to be able to flow from microfluidic device, sodium alginate was added to solution from beginning of processing. Since potato starch flow though out microfluidic device was not easy, alginate was used as thickening material because of its ability to increase viscosity of starch at low concentration.
1 gram of potato starch was mixed with 0.5 gram of sodium alginate and added slowly to cold water with stirring to prevent alginate crumpling. The temperature of solution was raised to 100°C with stirring for 30 minute after reaching this degree; the process was take place in a sealed glass beaker. After complete dissolving a 1 ml of ethanol was added to solution with continues stirring for another 15 minute. Caution must be taken in this step because of high evaporation rate of water in the sealed beaker to avoid losing the solution through boiling. The resulted solution was cooled and left to settle down before using (Figures 2 and 3).
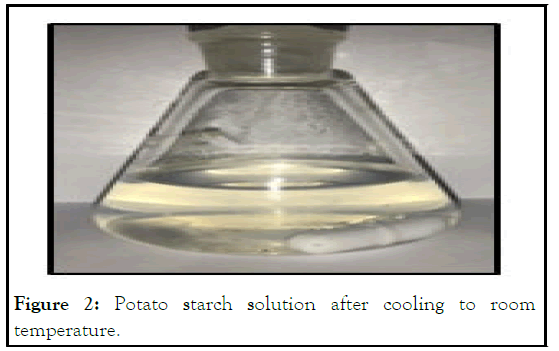
Figure 2: Potato starch solution after cooling to room temperature.
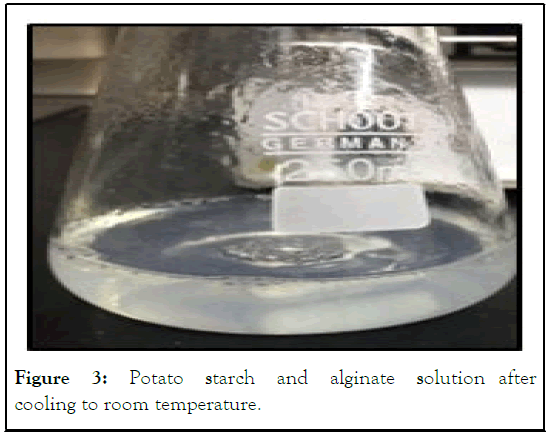
Figure 3: Potato starch and alginate solution after cooling to room temperature.
Microfluidic system
This part of work includes assembling process the microfluidic system. This system consist two main units; the microfluidic capillary; the syringe pumps. The main part of this system in spite of its tiny shape was the microfluidic capillary, in which the rheology of biopolymer nano composite was studied experimentally and numerically. A glass micro capillary with L shape and flow focusing regime. The dimensions of micro capillary is (60 mm of 300 μm inner diameter × 36 mm of 400 μm inner diameter) with flow focusing chamber of (4 mm × 6 mm) that help in microsphere formation. The capillary geometry and dimension as Sin D, et al. used with slight modification in microfluidic capillary geometry (Figure 4) [3].
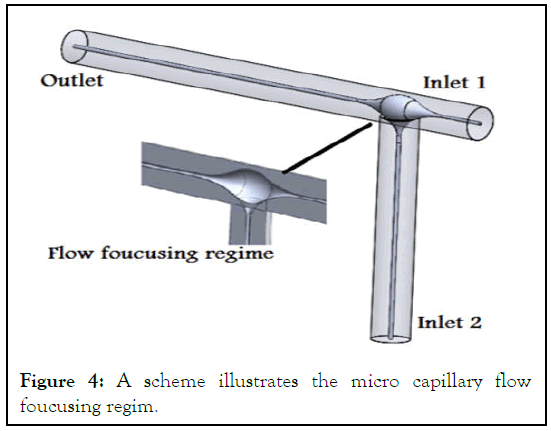
Figure 4: A scheme illustrates the micro capillary flow foucusing regim.
Two syringe pumps were used, one is connected to the inlet 1 (Phase 2, disperse phase) and the other was connected to the inlet 2 (Phase1, continuous phase). The outlet was connected to tube that ends to collecting beaker contain phase 1 solution as collecting phase. A medical rubber sealing was used to fix the needles from moving. Teflon tubes were used to deliver the dispersed phase (Figure 5) [4].
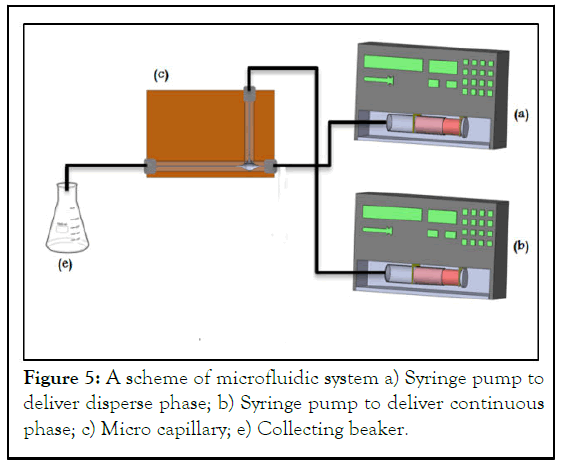
Figure 5: A scheme of microfluidic system a) Syringe pump to deliver disperse phase; b) Syringe pump to deliver continuous phase; c) Micro capillary; e) Collecting beaker.
Characterization
Fourier-transform infrared spectroscopy FTIR: This test used to investigate the starch interaction with different compounds. The test held out using (Shimatzu instrument).
Differential scanning calorimetry DSC: DSC used to study thermal degradation of microspheres (DSC-60, Shimadzu).
Optical microscope: Morphology of microspheres were investigate using microscope using wet mode, where the microspheres floating in continuous phase.
Fourier-transform infrared spectroscopy results
The potato starch functional groups were confirmed by comparing to a reference starch FTIR spectra. The bands was almost similar (Figures 6 and 7).
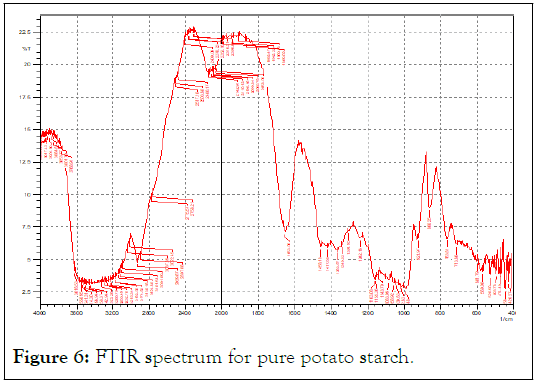
Figure 6: FTIR spectrum for pure potato starch.
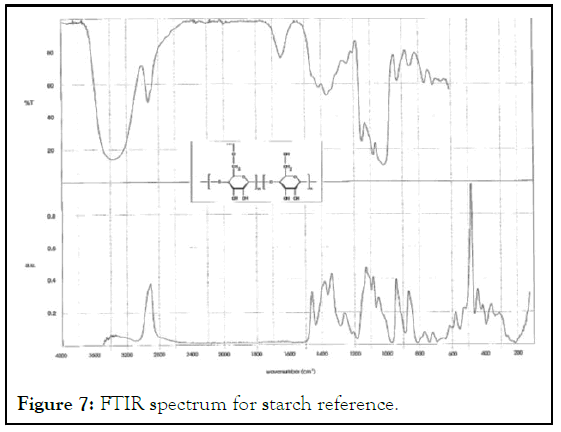
Figure 7: FTIR spectrum for starch reference.
Figure 8 of pure potato starch and several concentrations of this starch showed a sharp band at different wavelengths 3379 cm-1-3387 cm-1, indicating strong OH group, this is a result for the existence of hydrogen bonding interaction with starch molecules as comparing to native starch. This hydrogen bonding came from glycerol that containing three hydrophilic alcoholic hydroxyl groups causing its water solubility and hygroscopic nature (Figures 8 and 9) [5].
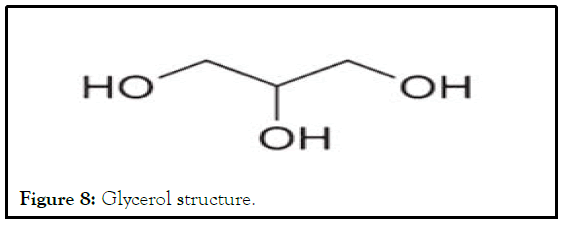
Figure 8: Glycerol structure.
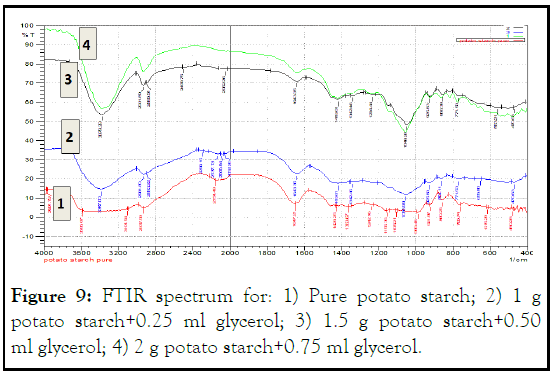
Figure 9: FTIR spectrum for: 1) Pure potato starch; 2) 1 g potato starch+0.25 ml glycerol; 3) 1.5 g potato starch+0.50 ml glycerol; 4) 2 g potato starch+0.75 ml glycerol.
Another band appeared at 1049 cm-1-1059 cm-1 for C-O stretch in -C-O-C-. -C-OH groups, (Figure 8).
By adding alginate to solution and with comparing to pure starch and plasticized starch, another sharp band appeared around 1612 cm-1 referring to carboxylate anions produce strong stretching vibrations, this is an evident of interaction between sodium alginate and potato starch (Figure 10).
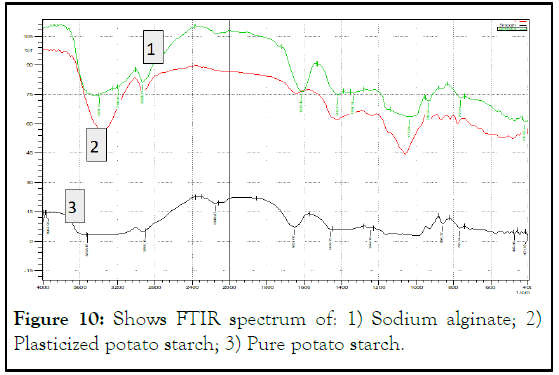
Figure 10: Shows FTIR spectrum of: 1) Sodium alginate; 2) Plasticized potato starch; 3) Pure potato starch.
Differential Scanning Calorimetry (DSC) results
This test was used to investigate the interaction between starch and glycerol to form partially modified starch. Glass transition temperature Tg was the increased from 50.29°C for native starch to 66.01°C for partially modified starch and to (69.72°C) for sodium alginate-starch solution. This increasing in Tg is an indicator of presence of hydrogen bonding between starch molecules that need to more energy to glass transition and overcome the intermolecular interactions causing high Tg (Figures 11-13) [6].
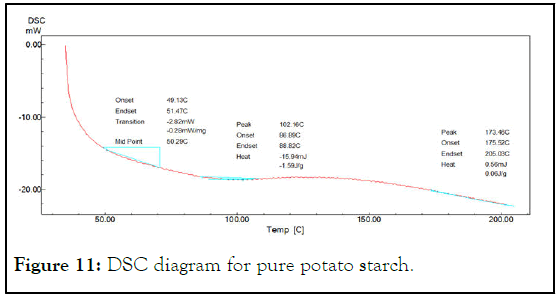
Figure 11: DSC diagram for pure potato starch.
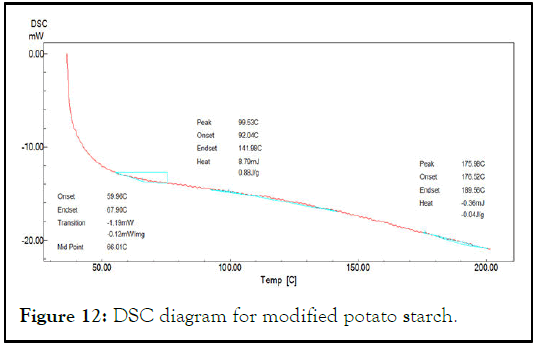
Figure 12: DSC diagram for modified potato starch.
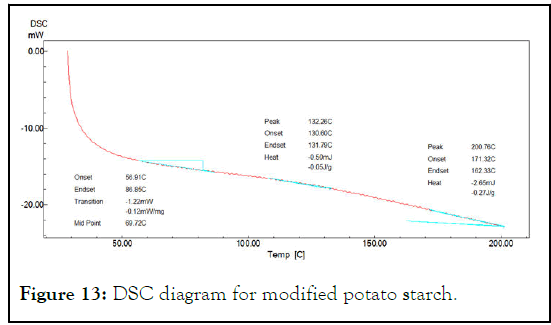
Figure 13: DSC diagram for modified potato starch.
Cone plate viscometer results
Continuous phase: Prediction of flow rates for both dispersed and continuous phases were done rheologically using cone plate viscometer using CPA-42 Z spindle. Viscosity decreased with shear rate increasing gives an indicator to flow rate of syringe pumps (Figure 14) [7].
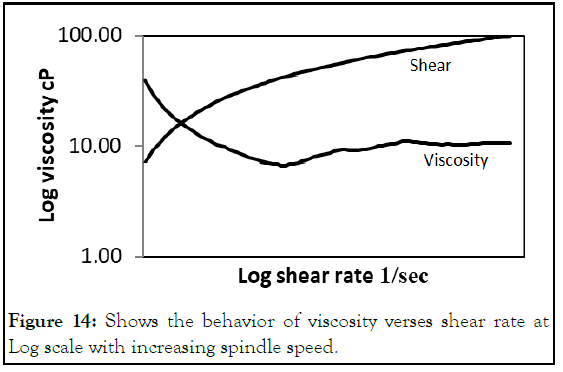
Figure 14: Shows the behavior of viscosity verses shear rate at Log scale with increasing spindle speed.
Dispersed phase: Since potato starch was naturally extracted, its behavior was not clear or justified (Table 1). To identify behavior of potato starch, three concentrations of were evaluated using cone plate viscometer as following:
| Concentration % | Temperature °C | Viscosity (cP) |
|---|---|---|
| 1 | 20 | 7.05 |
| 1.5 | 20 | 12.09 |
| 2 | 20 | 24.78 |
Table 1: Viscosity of potato starch at different concentrations.
The viscosity increased with concentration increasing, this it standard behavior of starch. By blotting viscosity versus shear rate at Log scale, the behavior exhibited shear thinning; the viscosity decreased by shear rate increasing (Figure 15) [8].
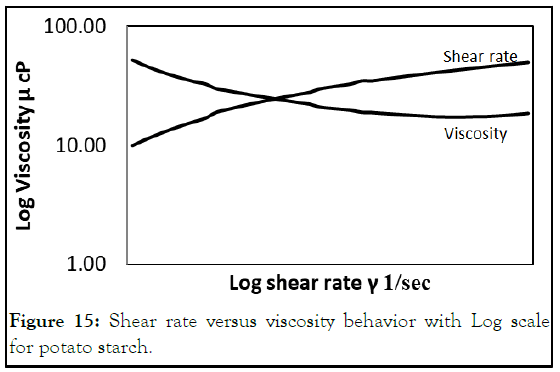
Figure 15: Shear rate versus viscosity behavior with Log scale for potato starch.
Adding SA as thickening phase to potato starch increased the viscosity of this solution sharply as compared to potato starch +glycerol solution. The viscosity-shear rate behavior still shear thinning where viscosity decreased with shear rate increasing (Figure 16).
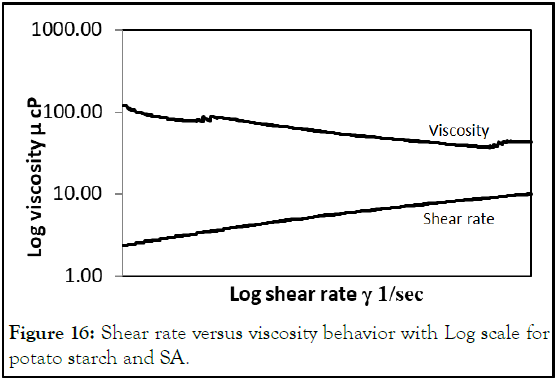
Figure 16: Shear rate versus viscosity behavior with Log scale for potato starch and SA.
Break up phenomenon: Since potato starch flow though out microfluidic device was not easy, alginate was used as thickening material because of its ability to increase viscosity of starch at low concentration. This ability gives the potato starch to form spherical shape. Beside this, Sodium Alginate (SA) forms strong hydrogen bonding due to heating by the formation of inter/ intramolecular hydrogen bonding within its chains, such as O3H3…O5 and O2H2…O=C-O- (Figures 17 and 18) [9].
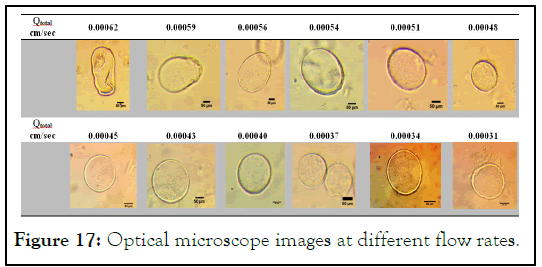
Figure 17: Optical microscope images at different flow rates.
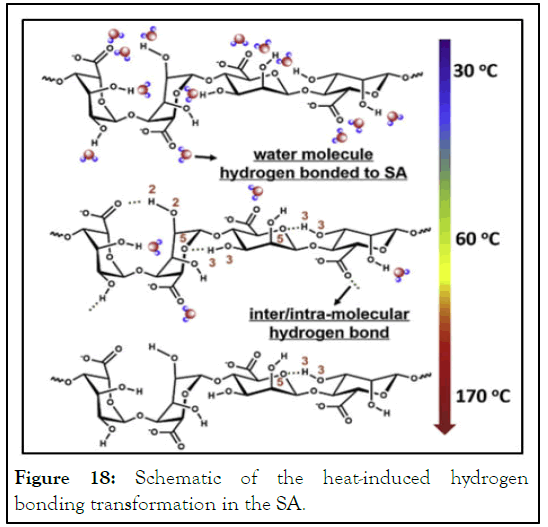
Figure 18: Schematic of the heat-induced hydrogen bonding transformation in the SA.
As shown in Figure 18, SA forms hydrogen bonding with water as well as to inter/intra-molecular hydrogen bonding within SA. These bonds are break up upon heating making SA pass through three states: Hydrogen bonded with water → hydrogen bonded with O5 → relatively free, this confirms the existence of inter/ intra-molecular hydrogen bonds relating to hydroxyl groups in SA chains. Besides the strong hydrogen bonding between starch and SA, low concentrations of glycerol decrease mobility of starch molecules because of increasing hydrogen bonding that enhanced intermolecular interaction [10].
Using multiphase flow creates two flow rates; Qc for continuous phase and Qd for dispersed phase. The total flow rate can be calculated using equation (1).

The flow of a fluid through a microfluidic channel can be characterized by the Reynolds number. Reynolds number for microfluidic device can be defined as following:

Where ρ continuous phase density, U is sphere velocity, a is the sphere radius flow through microchannel and μ is liquid viscosity.

The characteristic velocity of the flow is the relation between flow rate devided by capillary area. Depending on Reynolds number in which less than 102, the flow can be considered laminar. Blotting Reynolds number versus flow rate at Log-scale shows that Reynolds numbers is proportional to flow rate (Figure 19).
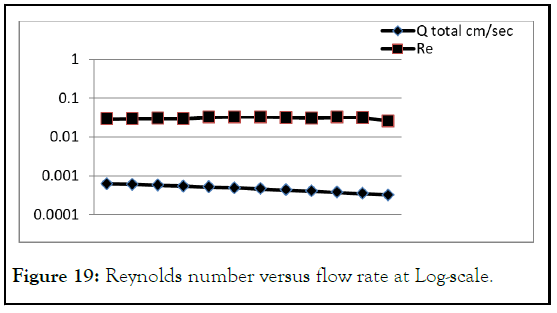
Figure 19: Reynolds number versus flow rate at Log-scale.
The total microspheres diameter was blotted against flow rate, Figure 19. The diameter of microspheres was decreased with flow rate decreasing and rises again; this point can be called critical flow rate for this reason. This is mean that flow rate less than 0.00048 cm/sec has microsphere diameter from 151 μm-180 μm. this range raise again from 195 μm-263 μm at higher flow rate. At very low flow rates, it was noticed that microspheres shell become weak and starts to leach core. This behavior refer to low shear rate that was not enough to gain the shell to have uniform shape (Figures 20 and 21) [11].
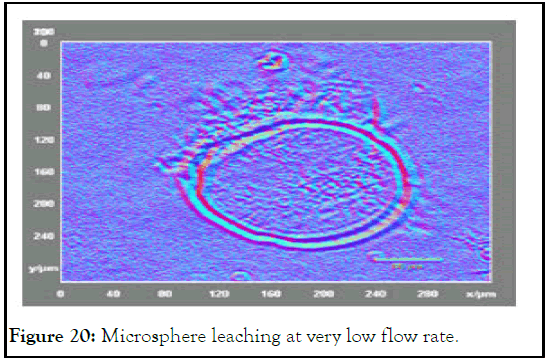
Figure 20: Microsphere leaching at very low flow rate.
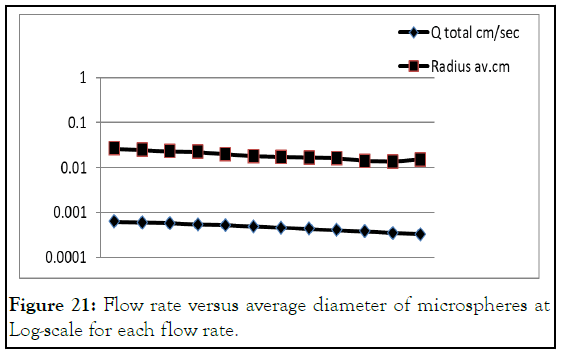
Figure 21: Flow rate versus average diameter of microspheres at Log-scale for each flow rate.
The shape of microsphere was much related to flow rate, where the microspheres shape ranged from oval to complete sphere with varying flow rates. At high flow rate microspheres didn’t take the spherical shape and elongate forming oval shape (Figure 22) [12].
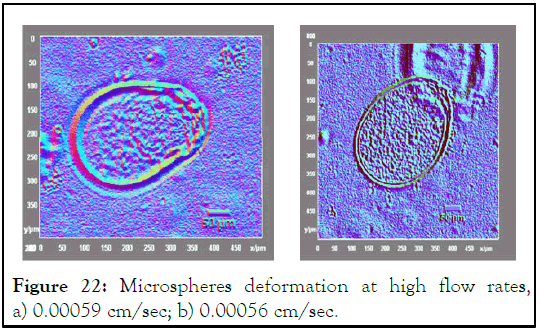
Figure 22: Microspheres deformation at high flow rates, a) 0.00059 cm/sec; b) 0.00056 cm/sec.
This deformation in shape came from the high hydrodynamic forces that overcome the interfacial tension of the microsphere and change its shape or even breakup (Figure 23) [13].
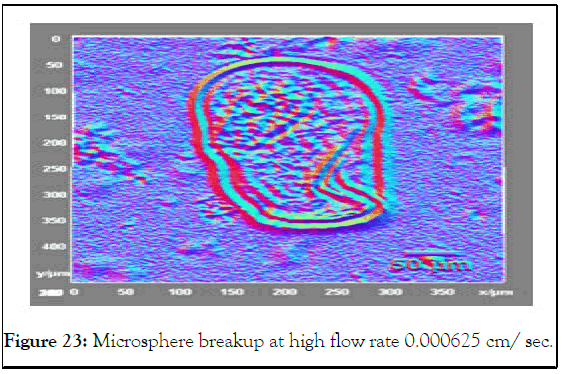
Figure 23: Microsphere breakup at high flow rate 0.000625 cm/ sec.
At low viscosity, the microsphere tend to back to the sphere radius a by the effect of interfacial tension of the microsphere core, in conjunction with slowing down the motion by the continuous phase. This make the microsphere does not have the enough relaxation time to fully developed as sphere (Figure 24) [14].
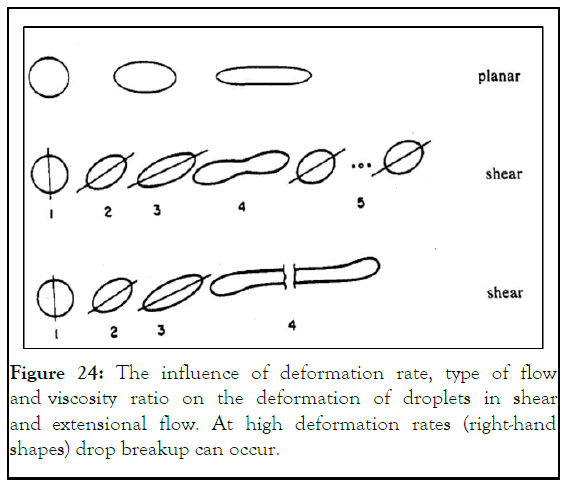
Figure 24: The influence of deformation rate, type of flow and viscosity ratio on the deformation of droplets in shear and extensional flow. At high deformation rates (right-hand shapes) drop breakup can occur.
Strengthening starch molecular structure by enhancing hydrogen bonding will make starch more acceptable for microsphere formation using microfluidic device. Flow and shear rates were the controlling parameters of microspheres shape and morphology. Low starch concentrations with assistance of sodium alginate modify the viscosity at this concentration. At high shear rates microspheres deforms and shift up from oval to spherical shape. By decreasing flow rates, the microsphere starts to have a spherical shape and then leach at the lowest flow rate causing their failure.
This work supported by training and financial assistant provided by the collage of material engineering, polymers and petrochemical engineering, Iraq.
[Crossref] [Google Scholar] [PubMed]
[Crossref] [Google Scholar] [PubMed]
[Crossref] [Google Scholar] [PubMed]
[Crossref] [Google Scholar] [PubMed]
[Crossref] [Google Scholar] [PubMed]
[Crossref] [Google Scholar] [PubMed]
[Crossref] [Google Scholar] [PubMed]
Citation: Mohammed R, Hadi N, Al-Zubiedy A (2023) Partially Modified Potato Starch for Drug Delivery Applications. J Appl Pharm. 15:382.
Received: 28-Aug-2023, Manuscript No. JAP-23-1769; Editor assigned: 02-Sep-2023, Pre QC No. JAP-23-1769 (PQ); Reviewed: 16-Sep-2023, QC No. JAP-23-1769; Revised: 01-Nov-2023, Manuscript No. JAP-23-1769 (R); Published: 29-Nov-2023 , DOI: 10.35248/1920-4159.23.15.382
Copyright: © 2023 Mohammed R, et al. This is an open-access article distributed under the terms of the Creative Commons Attribution License, which permits unrestricted use, distribution, and reproduction in any medium, provided the original author and source are credited.